

Dynamic simulation and response analysis of LNG-based BOG re-liquefaction coupled with ORC power generation
 0
0 
Abstract
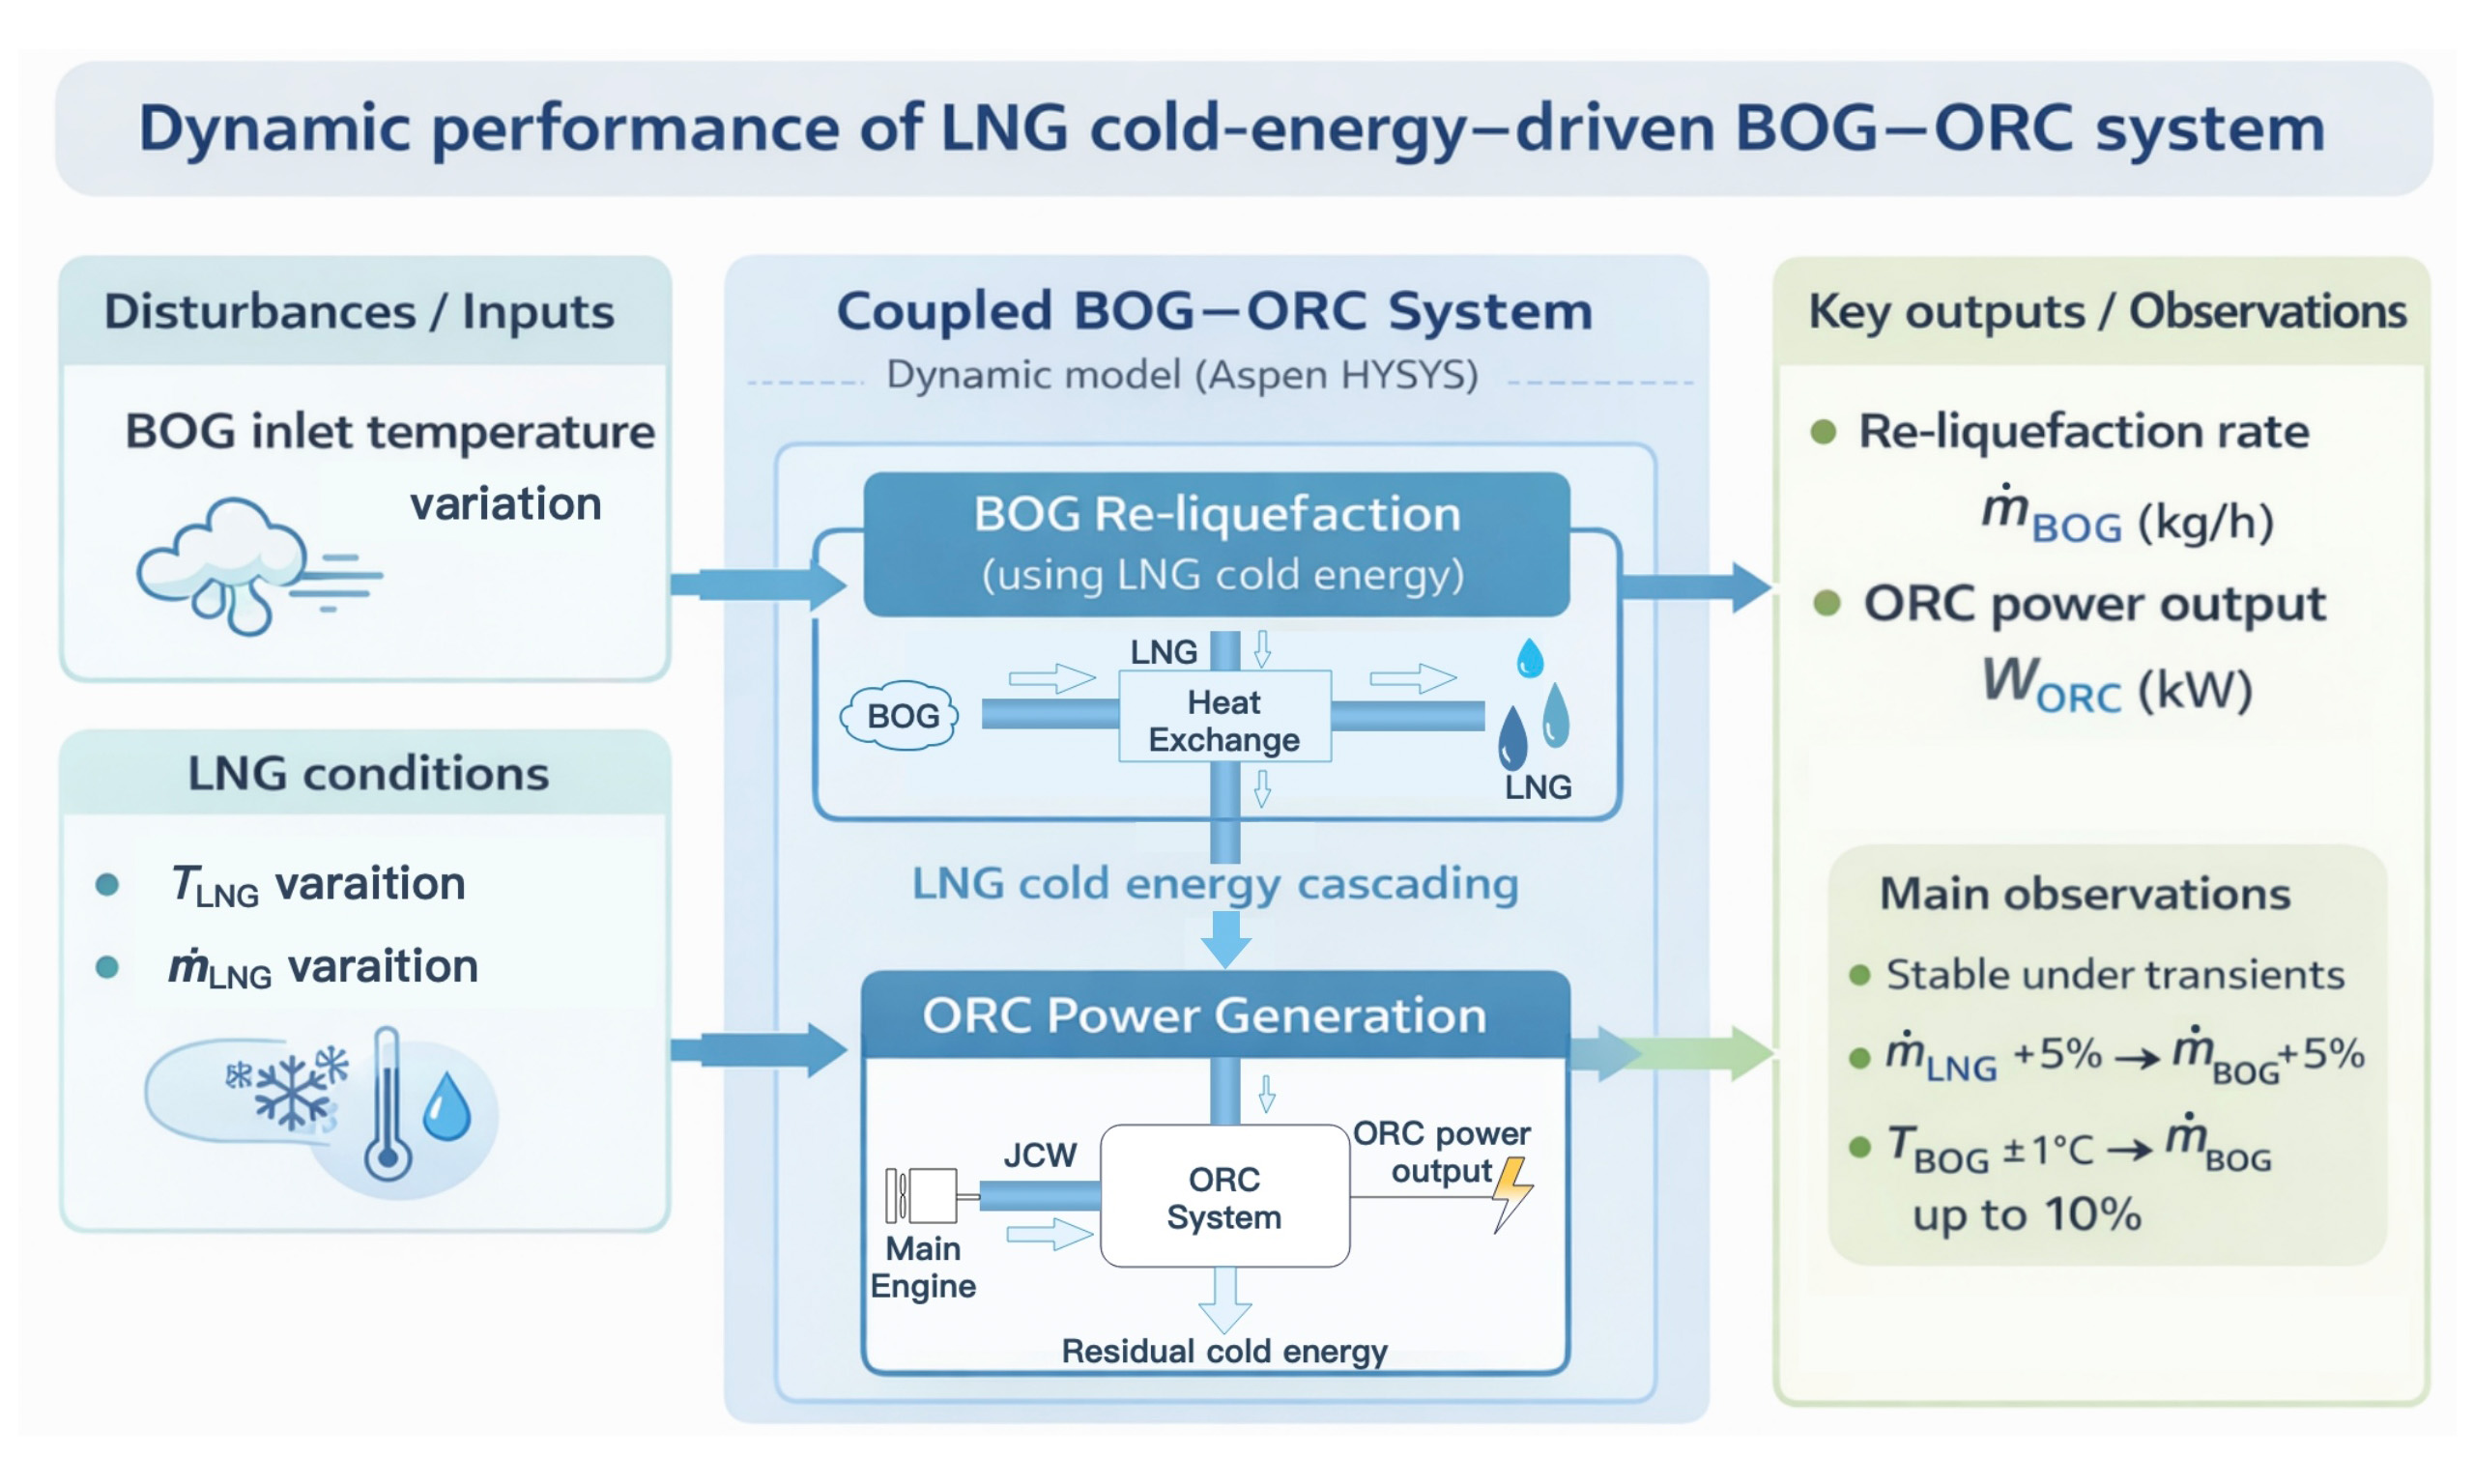
The utilization of liquefied natural gas (LNG) cold energy represents an important approach to improving the efficiency of the LNG value chain. Existing research on LNG cold energy utilization has mainly focused on steady-state simulations and key parameter optimization, while studies on dynamic simulation remain relatively limited. To address this gap, this study develops a dynamic model of a boil-off gas (BOG) re-liquefaction system coupled with an Organic Rankine Cycle (ORC) power generation unit driven by LNG cold energy, with particular emphasis on system dynamic stability. The effects of disturbances in certain parameters, such as temperature and mass flow rate, on system stability and dynamic response are investigated. The results indicate that when the LNG mass flow rate increases by 5%, the BOG re-liquefaction rate rises from 2,006 kg/h to approximately 2,100 kg/h (about 5%), while the ORC power output even increases from 60 kW to around 65 kW (about 8%), demonstrating the importance of sufficient cold energy for the ORC system. In contrast, a ±1 °C variation in BOG temperature has a limited impact on ORC power output (generally less than 2%), but it significantly affects the BOG re-liquefaction rate, which can increase by up to 10%. This study provides valuable insights into the dynamic operational characteristics of the BOG-ORC system and highlights the potential of utilizing LNG cold energy for both BOG re-liquefaction and power generation.
Keywords
1. INTRODUCTION
With the rapid growth of the global economy, energy demand continues to increase[1]. However, the extensive consumption of conventional fossil fuels has resulted in a substantial rise in greenhouse gas emissions, posing growing challenges to the global ecological environment. To achieve carbon peak and carbon neutrality targets, many countries are actively promoting energy structure transformation and seeking cleaner and more efficient low-carbon energy utilization pathways[2]. In this context, natural gas, owing to its relatively lower carbon emissions, is widely regarded as an important transitional energy source in the long-term shift from fossil fuels to renewable energy[3]. For instance, replacing coal with liquefied natural gas (LNG) for power generation or industrial heating can theoretically reduce carbon emissions by approximately 550 g CO2-eq per kWh. Meanwhile, the geographic mismatch between natural gas production and consumption has made cross-regional LNG trade an essential component of global energy supply. Through liquefaction, the volume of natural gas is significantly reduced, enabling long-distance transportation and connecting exporting regions with energy-importing markets. With the acceleration of the global energy transition, LNG trade has become increasingly important for enhancing energy security, optimizing supply chains, and promoting low-carbon energy substitution[4]. In recent years, the large-scale deployment of LNG carriers and the rapid development of LNG receiving terminals have further driven investment in storage and transportation infrastructure, supporting the continued expansion of the international LNG market[5].
Before combustion, LNG must be vaporized, during which its temperature increases from -162 °C to near ambient conditions, releasing approximately 830 kJ/kg of cold energy[6]. This cold energy, characterized by low temperature and high exergy, exhibits significant potential for cascade utilization and has attracted considerable attention in energy engineering research[7]. Current applications of LNG cold energy include power generation, air conditioning, industrial cooling, air separation, seawater desalination, and onboard boil-off gas (BOG) re-liquefaction. Among these applications, BOG re-liquefaction and power generation are generally regarded as the most valuable pathways for LNG cold energy recovery[8].
During transportation, LNG inevitably absorbs environmental heat, generating BOG[9]. If not properly managed, BOG can lead to economic losses, safety hazards, and environmental issues[10]. Large LNG carriers, particularly Q-Flex and Q-Max vessels, are typically equipped with BOG re-liquefaction systems to process the gas, reducing losses and improving energy efficiency during transport. Studies have shown that re-liquefaction technology plays an important role in enhancing ship energy efficiency and reducing operating costs, providing theoretical support for system optimization[11]. In industrial applications, common BOG handling methods include the reverse Brayton cycle (RBC), dual Claude cycle, and Joule-Thomson condensation[12,13]. The RBC system generates low-temperature cooling by compressing, cooling, and expanding nitrogen, which then exchanges heat with evaporating BOG to achieve condensation. With nitrogen as the working fluid, RBC offers high safety, strong stability, and adaptability to dynamic ship operating conditions[14], and it has been widely applied in BOG re-liquefaction systems of large LNG carriers. Parameterized evaluations have been conducted to optimize equipment and operational parameters to maximize BOG recovery and minimize energy consumption[15]. However, RBC systems still face disadvantages such as low energy efficiency, complex system structures, large equipment volumes, and high operational costs. For LNG-fueled carriers, utilizing LNG cold energy for BOG re-liquefaction can not only reduce energy consumption but also simplify system structure, thereby lowering equipment complexity and maintenance costs. When coupled with an Organic Rankine Cycle (ORC) or carbon capture and storage (CCS) systems, LNG cold energy can be utilized in a multilevel manner[8].
In research, the modeling and simulation analysis of BOG re-liquefaction systems has become a hotspot. Using commercial process simulation software such as Aspen HYSYS®, researchers have built steady-state thermodynamic models to evaluate the performance of different cycle configurations[16]. Meanwhile, an increasing number of dynamic simulation studies have focused on system responses under disturbance conditions and corresponding control strategies. For example, in LNG terminal operations, precise dynamic modeling can describe non-equilibrium phenomena within re-liquefaction units, improving operational accuracy and stability[17]. For LNG tank cooling and loading, model predictive control (MPC) can simultaneously regulate tank temperature and pressure by adjusting the vapor outlet flow and LNG injection, thereby maintaining stable cooling and preventing excessive BOG generation and sudden pressure changes[18]. Furthermore, plant-wide dynamic simulations combined with multi-case analyses can determine optimal operating temperatures under different subcooling conditions, minimizing BOG generation and maximizing recovery while balancing environmental sustainability and energy economics[19]. Such simulations not only validate industrial designs but also provide valuable guidance for optimizing future shipboard re-liquefaction system control strategies[20].
In the utilization of LNG cold energy on ships, BOG re-liquefaction recovers part of the cold energy in LNG tanks; however, due to thermodynamic limitations, a portion of the cold energy remains underutilized. To fully exploit this remaining cold energy and realize cascade utilization, several studies have proposed introducing ORC systems into shipboard cold energy recovery processes[21]. ORC can convert low-temperature heat sources into electricity, turning otherwise wasted cold energy into usable power, further improving LNG cold energy utilization and providing an economical and efficient auxiliary energy recovery pathway for ships. Under the concept of LNG cold energy cascade utilization, high-grade cold energy at lower temperature levels is first used for BOG re-liquefaction, while the residual medium- and low-grade cold energy can be used to drive the ORC system to generate electricity, thereby achieving maximum cascade utilization. Recent studies[22] have shown that mixed working fluids can improve thermodynamic efficiency, though determining the optimal compositions and ratios remains complex, limiting practical applications. Other studies[23,24] have analyzed the effects of different heat source temperatures and cooling methods on ORC thermodynamic performance. For LNG-powered ships, ORC-based cold energy power generation systems have demonstrated that exergy efficiency is an appropriate performance evaluation metric, with R142b showing superior performance. Additionally, dual-stage ORC systems generally outperform single-stage systems in thermal efficiency, with some studies reporting efficiency improvements exceeding 27%, though the increased system complexity poses economic challenges[25]. These findings indicate that cold energy-driven ORC systems outperform conventional thermal recovery systems in terms of thermodynamic performance, environmental benefits, and system feasibility[26]. Nonetheless, due to the significant impact of working fluid properties and heat exchanger temperature differences, further investigation into the optimal design and dynamic characteristics of ORC systems is required to achieve efficient and controllable LNG cold energy recovery.
Compared with steady-state simulations, dynamic modeling enables a more comprehensive analysis of system responses under disturbances. Although dynamic simulation studies on LNG cold energy utilization remain relatively limited, existing research has conducted dynamic modeling for related systems, including solar, geothermal, and BOG recovery systems[27]. For example, Kurle et al.[19] developed a dynamic model of a BOG compression system to study disturbance effects on compressor performance. Wang et al.[28] conducted experiments and dynamic modeling on the high-pressure fuel gas supply system (HP-FGSS) of LNG-fueled ships, focusing on transient performance under load variations and environmental disturbances. The results showed significant gas pressure fluctuations under large load changes, with buffer tank volume and fuel composition critically influencing pressure response and steady-state gas temperature, while violent sloshing could trigger cavitation. He et al.[29] established a dynamic model of a dual-stage series ORC system and analyzed the effects of control strategies and key parameters on system stability. Their results showed that cascaded control effectively mitigates disturbances, with LNG mass flow fluctuations exerting the greatest influence. These studies provide valuable references for the dynamic modeling in the present study.
In this work, a dynamic simulation model of a coupled BOG-ORC system is developed, with BOG re-liquefaction as the first stage of LNG cold energy utilization and the cold energy of LNG after heat exchange driving the ORC system to generate power, further recovering shipboard cold energy. The model considers multiple key control valves and separator settings to ensure stable operation and equipment safety under dynamic fluctuating conditions. Section 2 details the dynamic simulation model and methodology; Section 3 presents the results and discussion, analyzing system performance under disturbances; and Section 4 concludes the study and proposes directions for future research.
2. METHODS
2.1 Dynamic process description
This study employs the process simulation software Aspen HYSYS V14 to investigate the ORC-BOG system. To simplify the simulation and analysis, the following assumptions are made:
• All equipment operates under adiabatic conditions.
• Thermodynamic calculations are based on the Peng-Robinson equation of state.
• Flow friction and heat losses are neglected.
• The mole fractions of the ship’s LNG fuel are 98.6% methane, 1.18% ethane, 0.1% propane, 0.02% isobutane, and 0.1% nitrogen.
• The mole fractions of the BOG are 97.86% methane and 2.14% nitrogen.
• The isentropic efficiencies of the turbine, pump, and compressor are set as 72%, 75%, and 78%, respectively.
The Q-Flex is a large LNG carrier widely used for transporting LNG over long distances. It serves as a key vessel type in global LNG trade due to its high capacity and efficiency. The ship has an overall length of
Ship parameters
| Parameter | Value |
| Exhaust gas temperature | 222 °C |
| Exhaust gas flow rate | 8,558 kg/h |
| BOG processing rate | 2,678 kg/h |
| LNG flow rate | 4,008 kg/h |
| LNG temperature | -162 °C |
| Seawater temperature | 30 °C |
| JCW temperature | 95 °C |
Based on previous studies, the system is modeled on an LNG-fueled carrier. During the storage and transportation of LNG, BOG is inevitably generated due to heat ingress and pressure variations, necessitating efficient re-liquefaction or utilization. Figure 1 presents the schematic diagram of the proposed dynamic BOG-ORC system, which consists of both the BOG re-liquefaction process and the ORC power generation process.
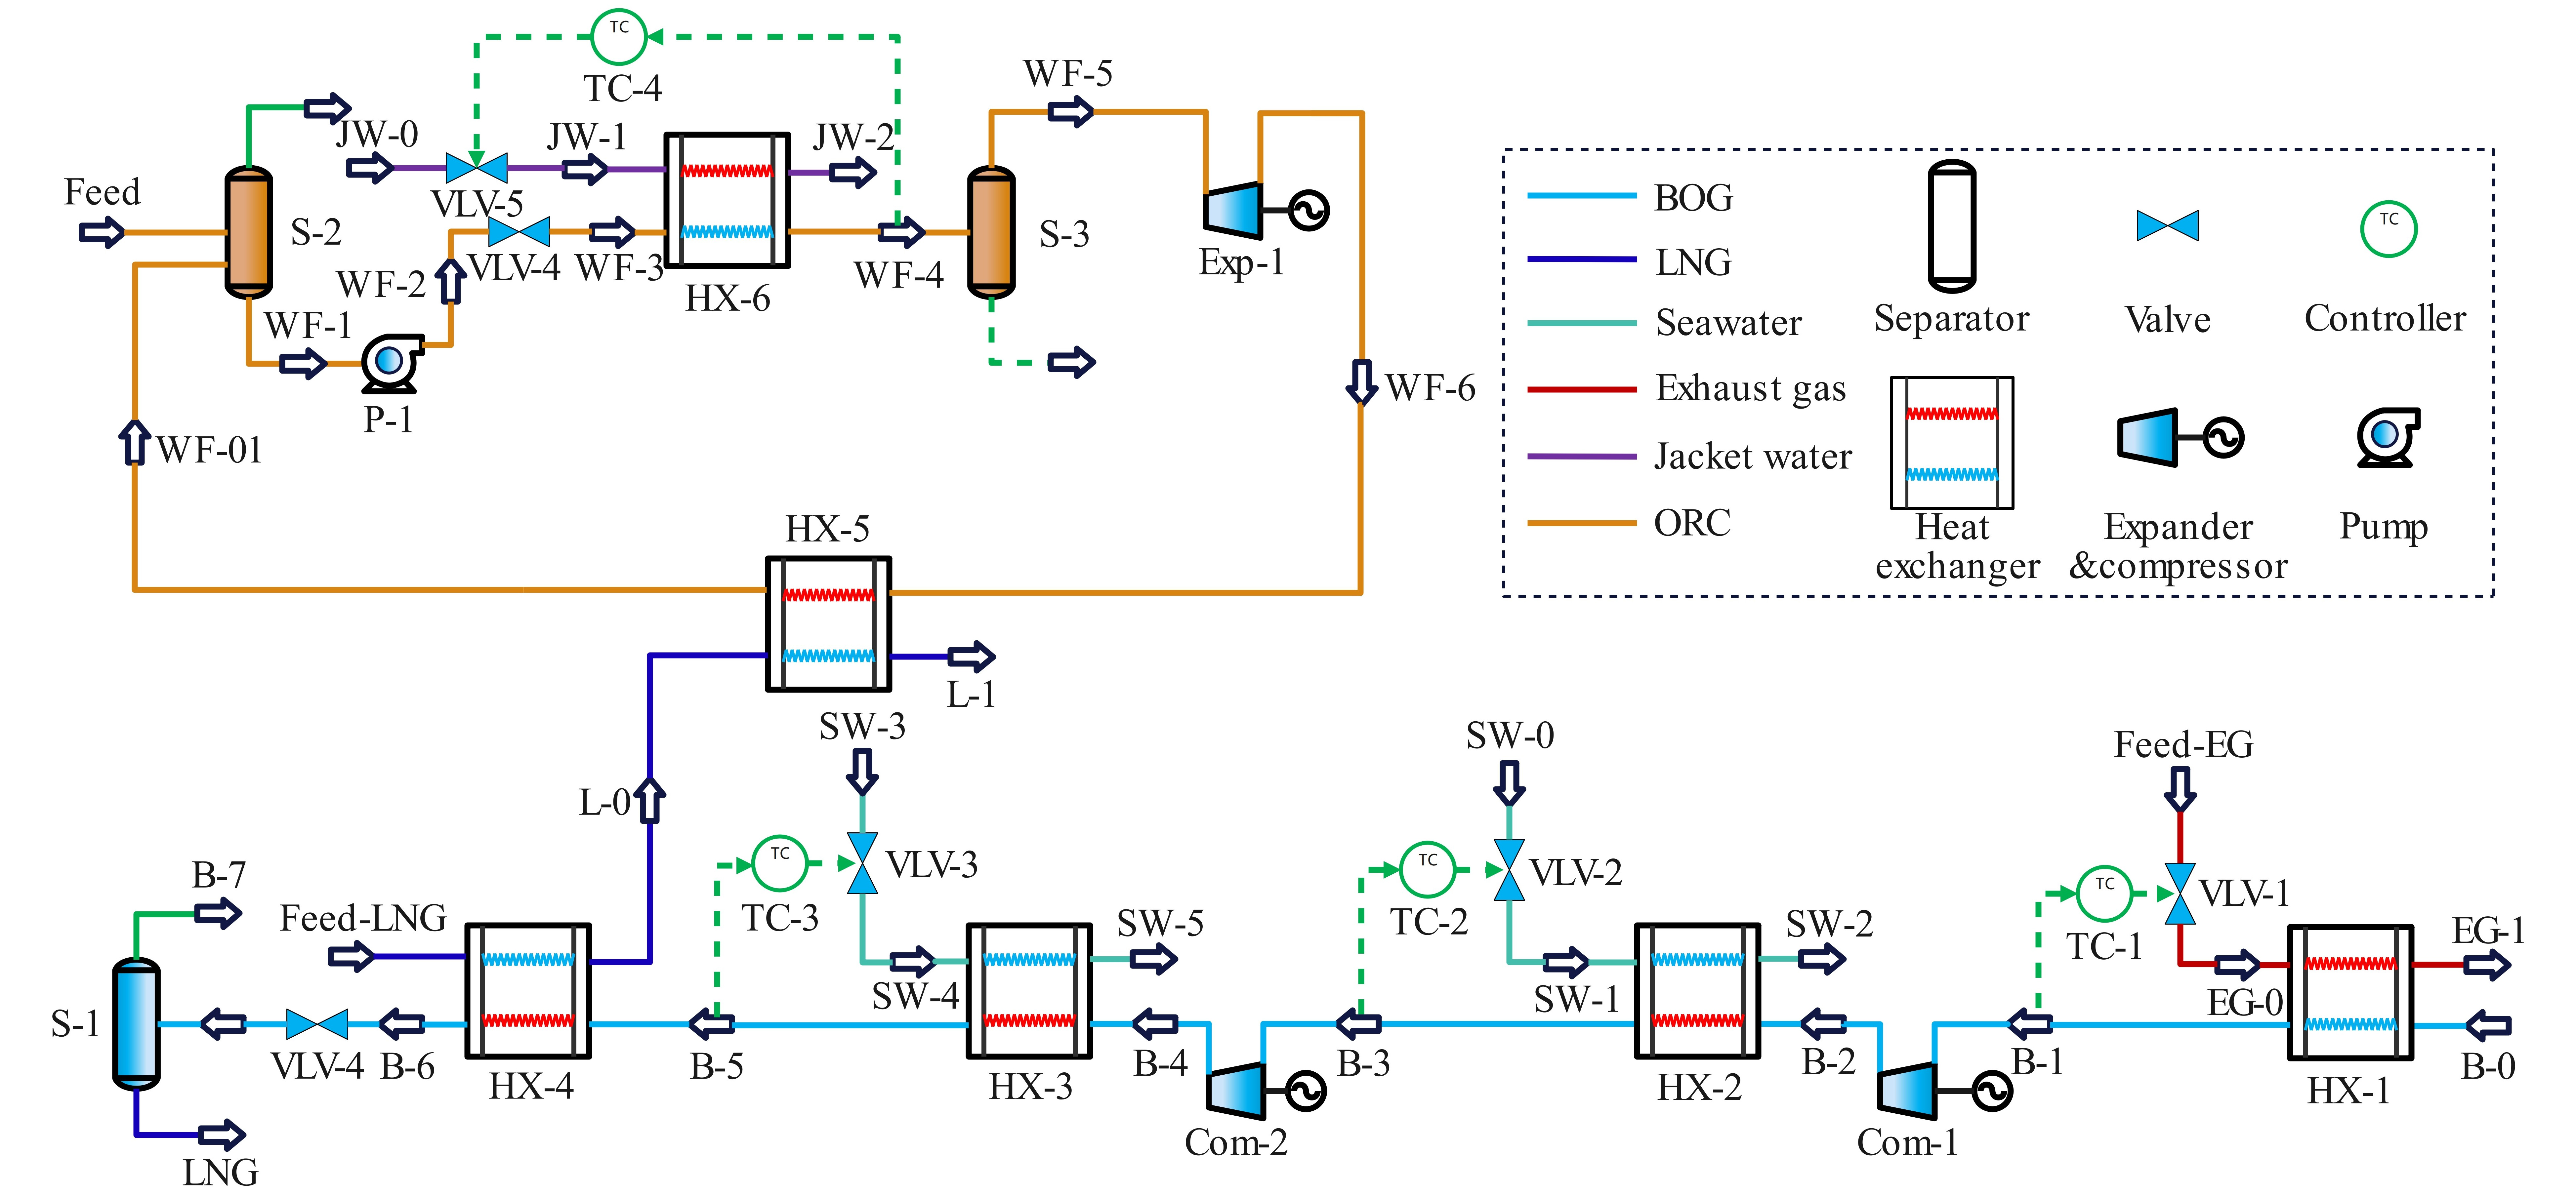
Figure 1. Dynamic model of the BOG-ORC process. BOG: Boil-off gas; ORC: organic rankine cycle; LNG: liquefied natural gas.
The BOG re-liquefaction subsystem constitutes the first stage of LNG cold energy utilization. The BOG (B-0, pressure 150 kPa) exists in a gas-liquid coexistence state at -125 °C. To ensure complete vaporization before entering the compressor, the BOG is first heated in heat exchanger HX-1 using exhaust gas from the main engine as the heat source. The heated BOG (B-2, 40 °C, 150 kPa) then undergoes two-stage isentropic compression and is subsequently cooled by seawater. The compressed BOG (B-5, 40 °C) is further cooled to a saturated liquid state by LNG (Feed-LNG, -162 °C, 150 kPa) in heat exchanger HX-4. The liquefied BOG (B-6) then passes through a pressure-reducing valve into the separator (S-1) to remove excess vapor. Finally, the LNG is fed into the cargo tank to maintain tank pressure.
The ORC subsystem represents the second stage of LNG cold energy utilization. The heat source is jacket cooling water (JCW) at 95 °C, and propane (R290) is selected as the working fluid. The LNG (L-0), after heat exchange with BOG, enters the ORC system as the cold source. Liquid R290 (WF-01) is pressurized by pump P-1 and then heated in HX-6 using heat supplied by the main engine’s JCW. The heated R290 (WF-4) expands through turbine Exp-1 to generate electricity.
Figure 1 also depicts the system’s dynamic control structure. In the BOG re-liquefaction subsystem, the control valve (VLV-1) regulates the flow of main engine exhaust to ensure complete vaporization of BOG and protect the compressor from damage. Control valves (VLV-2 and VLV-3) adjust the seawater flow rate to maintain the BOG cooling temperature at 40 °C. In the ORC subsystem, separators (S-2 and S-3) are installed upstream of the pump (P-1) and turbine (Exp-1), respectively, ensuring that only pure gas or liquid enters the subsequent processes. On the heat source side, the control valve (VLV-4) is used to ensure that the working fluid reaches the desired temperature.
2.2 Dynamic models of the equipment
2.2.1 Material stream
Dynamic simulation differs fundamentally from steady-state simulation in that the flow behavior of the working fluid is governed by a coupled pressure-flow relationship. Variations in pressure and mass flow rate are not independent; changes in one variable inevitably influence the other during transient operation.
In practice, material streams in dynamic simulation can be established using two basic driving strategies. One approach is to prescribe the inlet flow conditions, while the outlet pressure is determined implicitly based on the resulting pressure drop across the system. Alternatively, the pressure levels at both the inlet and outlet can be specified, and the corresponding mass flow rate is then calculated from the imposed pressure difference.
By appropriately defining the pressure-flow relationships, stable and physically reasonable stream behavior can be maintained throughout the system, avoiding excessive, insufficient, or unrealistic flow regulation. In most cases, it is sufficient to define material stream boundary conditions only at the system interfaces, while internal stream behavior is automatically resolved during the dynamic calculation.
2.2.2 Expander/Compressor
In dynamic simulations, the behavior of compressors and expanders is described by linking power exchange with the mass flow rate passing through the equipment. For modeling simplicity, the isentropic efficiency and the pressure ratio of both compressors and expanders are commonly treated as constant parameters. Under this assumption, these quantities are considered independent of variations in inlet mass flow during operation.
Based on these assumptions, the isentropic power of the compressor or expander can be evaluated using the following expression[30]:
Where hin, Pin, Pout, and ρin denote the inlet specific enthalpy, inlet pressure, outlet pressure, and inlet density, respectively. The terms h’out and ρ’out represent the specific enthalpy and density at the outlet state evaluated under isentropic conditions corresponding to the inlet entropy. In addition, ṁ refers to the mass flow rate, and Np is the volume exponent.
2.2.3 Pump
In the dynamic model, the pump is treated as a device that provides a prescribed pressure increase to the liquid stream. Rather than explicitly modeling internal compression mechanisms, pump behavior is characterized by maintaining a specified pressure rise across the unit during operation. This approach ensures stable liquid transport under transient conditions and enables proper control of the downstream pressure level.
Pump efficiency is defined by comparing the theoretical power required to achieve the pressure increase with the actual power transferred to the working fluid. Once the efficiency is specified, the relationship between pressure rise and enthalpy change across the pump can be expressed as follows[31]:
where ηP, vin, and ΔP are the pump efficiency, the specific volume of the working fluid at the pump inlet, and the pressure difference, respectively.
2.2.4 Heat exchanger
Equations 4 and 5 represent the transient energy balances of the hot and cold streams in the heat exchanger, respectively. The left-hand side accounts for the enthalpy change due to mass flow and the inter-stream heat transfer, while the right-hand side describes the temporal accumulation of energy within the control volume, enabling the dynamic thermal behavior of the heat exchanger to be captured. The energy balance of the hot stream is expressed as follows[32]:
The energy balance of the cold stream is expressed as follows[32]:
where U, A, and Qhc are the heat transfer coefficient, heat transfer area, and heat flow rate between the hot and cold streams, respectively.
2.2.5 Valve
In the dynamic simulation, throttle valves are represented using a simplified linear valve model. The primary role of the valve is to regulate the mass flow by imposing a pressure drop across the component. Instead of modeling detailed internal valve characteristics, the valve behavior is described through a functional relationship between the pressure drop and the resulting mass flow rate.
Based on this modeling approach, the dynamic valve equation can be written as follows[32]:
where Cv and ρ are the valve flow coefficient and the working fluid density, respectively.
2.2.6 Separator
In the dynamic simulation framework, the separator is introduced not only to achieve phase separation between BOG and LNG, but also to provide intermediate storage capacity within the system. This buffering effect allows transient imbalances between inlet and outlet mass flow rates to be accommodated during dynamic operation.
Accordingly, the dynamic behavior of the separator is described by the following model[32]:
where ṁv and ṁl are the mass flow rates of vapor and liquid phases, respectively.
2.2.7 Proportional-integral-derivative controller
In dynamic simulations, control loops are introduced to regulate key process variables and maintain stable operation under both transient and steady-state conditions. In this study, proportional-integral-derivative (PID) controllers are employed as a practical control strategy to adjust manipulated variables based on deviations from specified setpoints.
The control action is generated by combining proportional, integral, and derivative responses, with the relative influence of each term determined by the controller parameters. By tuning these parameters, different feedback behaviors can be achieved to accommodate the dynamic characteristics of the system. The corresponding PID control formulation is given in Equation 9[33].
where OP(τ), E(τ), Kc, ti, and td are the controller output, control error (deviation), proportional gain, integral time, and derivative time, respectively.
Here, the sign of the feedback action depends on whether the control response tends to reduce or amplify the deviation between the controlled variable and its set point. If the manipulated variable changes in a direction that counteracts the deviation and drives the controlled variable back toward the set point, the loop operates under negative feedback. Conversely, if the control action amplifies the deviation and drives the controlled variable further away from the set point, the loop is considered positive feedback.
2.3 Validation of dynamic simulation results
In dynamic simulations, unlike steady-state processes, both working fluid properties and equipment parameters may fluctuate. Therefore, it is essential to validate several key parameters in the proposed dynamic process. Table 2 presents the values of these parameters and their deviations.
Comparison of steady-state and dynamic parameters
| Parameter | Steady-state | Dynamic | Deviation |
| BOG Re-lique¬faction (kg/h) | 2,051 | 2,006 | -2.2% |
| BOG inlet (kg/h) | 2,678 | 2,668 | -0.37% |
| Re-liquefaction Rate (%) | 77.6 | 75.2 | -2.4 percentage points |
| Exp-1 power (kW) | 68.69 | 59.93 | -12.7% |
| ORC working fluid flow (kg/h) | 2,055 | 1,984 | 3.4% |
| WF-4 temperature (°C) | 93.17 | 93.5 | 0.33 °C |
| L-1 temperature (°C) | -55 | -55.68 | -0.68 °C |
As shown in Table 2, the dynamic simulation performance indicators are slightly lower than those under steady-state conditions. The BOG re-liquefaction rate decreases by 1.4%, and the turbine power output drops by 12.7%. To maintain stable operation, the turbine inlet temperature was slightly increased. After two utilization stages, the LNG stream exits at -55.68 °C, essentially matching the steady-state result.
Overall, apart from the relatively notable reduction in turbine power output, all other deviations remain within 5%. Therefore, the dynamic simulation model developed in this study can be considered reliable.
3. RESULTS
3.1 Full-voyage scenario description (Barrow Island-Shanghai)
Australia is one of the world’s major LNG exporting countries, while China represents an important destination market in Asia[34]. Therefore, LNG transportation routes from Australia to China can be regarded as representative long-haul shipping routes.
Under a representative operating condition corresponding to approximately 75% engine load, the BOG generation rate is 2,668 kg/h, while the re-liquefaction rate reaches 2,006 kg/h, resulting in a BOG re-liquefaction ratio of about 75%. For a typical Barrow Island-Shanghai LNG transportation route with a sailing distance of approximately 3,322 nautical miles[35], the voyage duration is about 7 days at a cruising speed of 20 knots, leading to an estimated total LNG fuel consumption of around 666 t over the entire voyage. During the same period, approximately 443 t of BOG is generated, of which about 333 t can be re-liquefied, significantly reducing BOG losses during transportation. The remaining approximately 110 t of BOG can be directly utilized as propulsion fuel or employed for pressure control and safety management, depending on the vessel configuration.
However, along a typical LNG transportation route from Australia to China, vessels usually traverse a wide range of latitudes, often passing through tropical, subtropical, and temperate regions. Due to significant seasonal temperature differences between winter and summer, the ambient conditions surrounding the LNG cargo tanks can vary substantially during the voyage. For LNG carriers, prolonged exposure to varying environmental temperatures affects the thermal load on cargo tanks and the BOG generation rate, potentially causing fluctuations in LNG temperature. Such temperature drift can further impact downstream re-liquefaction systems and processes that utilize cold energy. Therefore, when investigating the dynamic characteristics of BOG-ORC or re-liquefaction systems, it is important to fully consider BOG temperature variations induced by route and seasonal changes.
Meanwhile, during actual navigation, vessel speed is continuously adjusted according to operating conditions, which leads to dynamic fluctuations in the main engine load. Since the fuel consumption rate is directly related to engine load, LNG consumption for propulsion is not constant. Variations in fuel demand further affect the LNG flow supplied to the cold energy utilization system, causing fluctuations during operation. Consequently, studying the impact of LNG flow disturbances on BOG-ORC system performance is of clear engineering relevance and can provide guidance for ensuring stable operation and optimizing control strategies under real-world navigation conditions.
Based on these considerations, the independent variables selected in this study include BOG and LNG temperature variations, as well as LNG flow fluctuations.
3.2 Disturbance of the BOG inlet temperature
Under varying ambient temperatures, the BOG temperature may fluctuate to some extent. Considering that the initial BOG temperature in this study is -125 °C, this work further examines the effects of a 1 K increase and a 1 K decrease relative to this baseline on the BOG re-liquefaction rate and the power output of the ORC system.
Figure 2 illustrates the dynamic response of the ORC power output to variations in BOG temperature. Since the BOG side is not directly coupled with the ORC side, the ORC power output exhibits only minor fluctuations and remains overall stable.
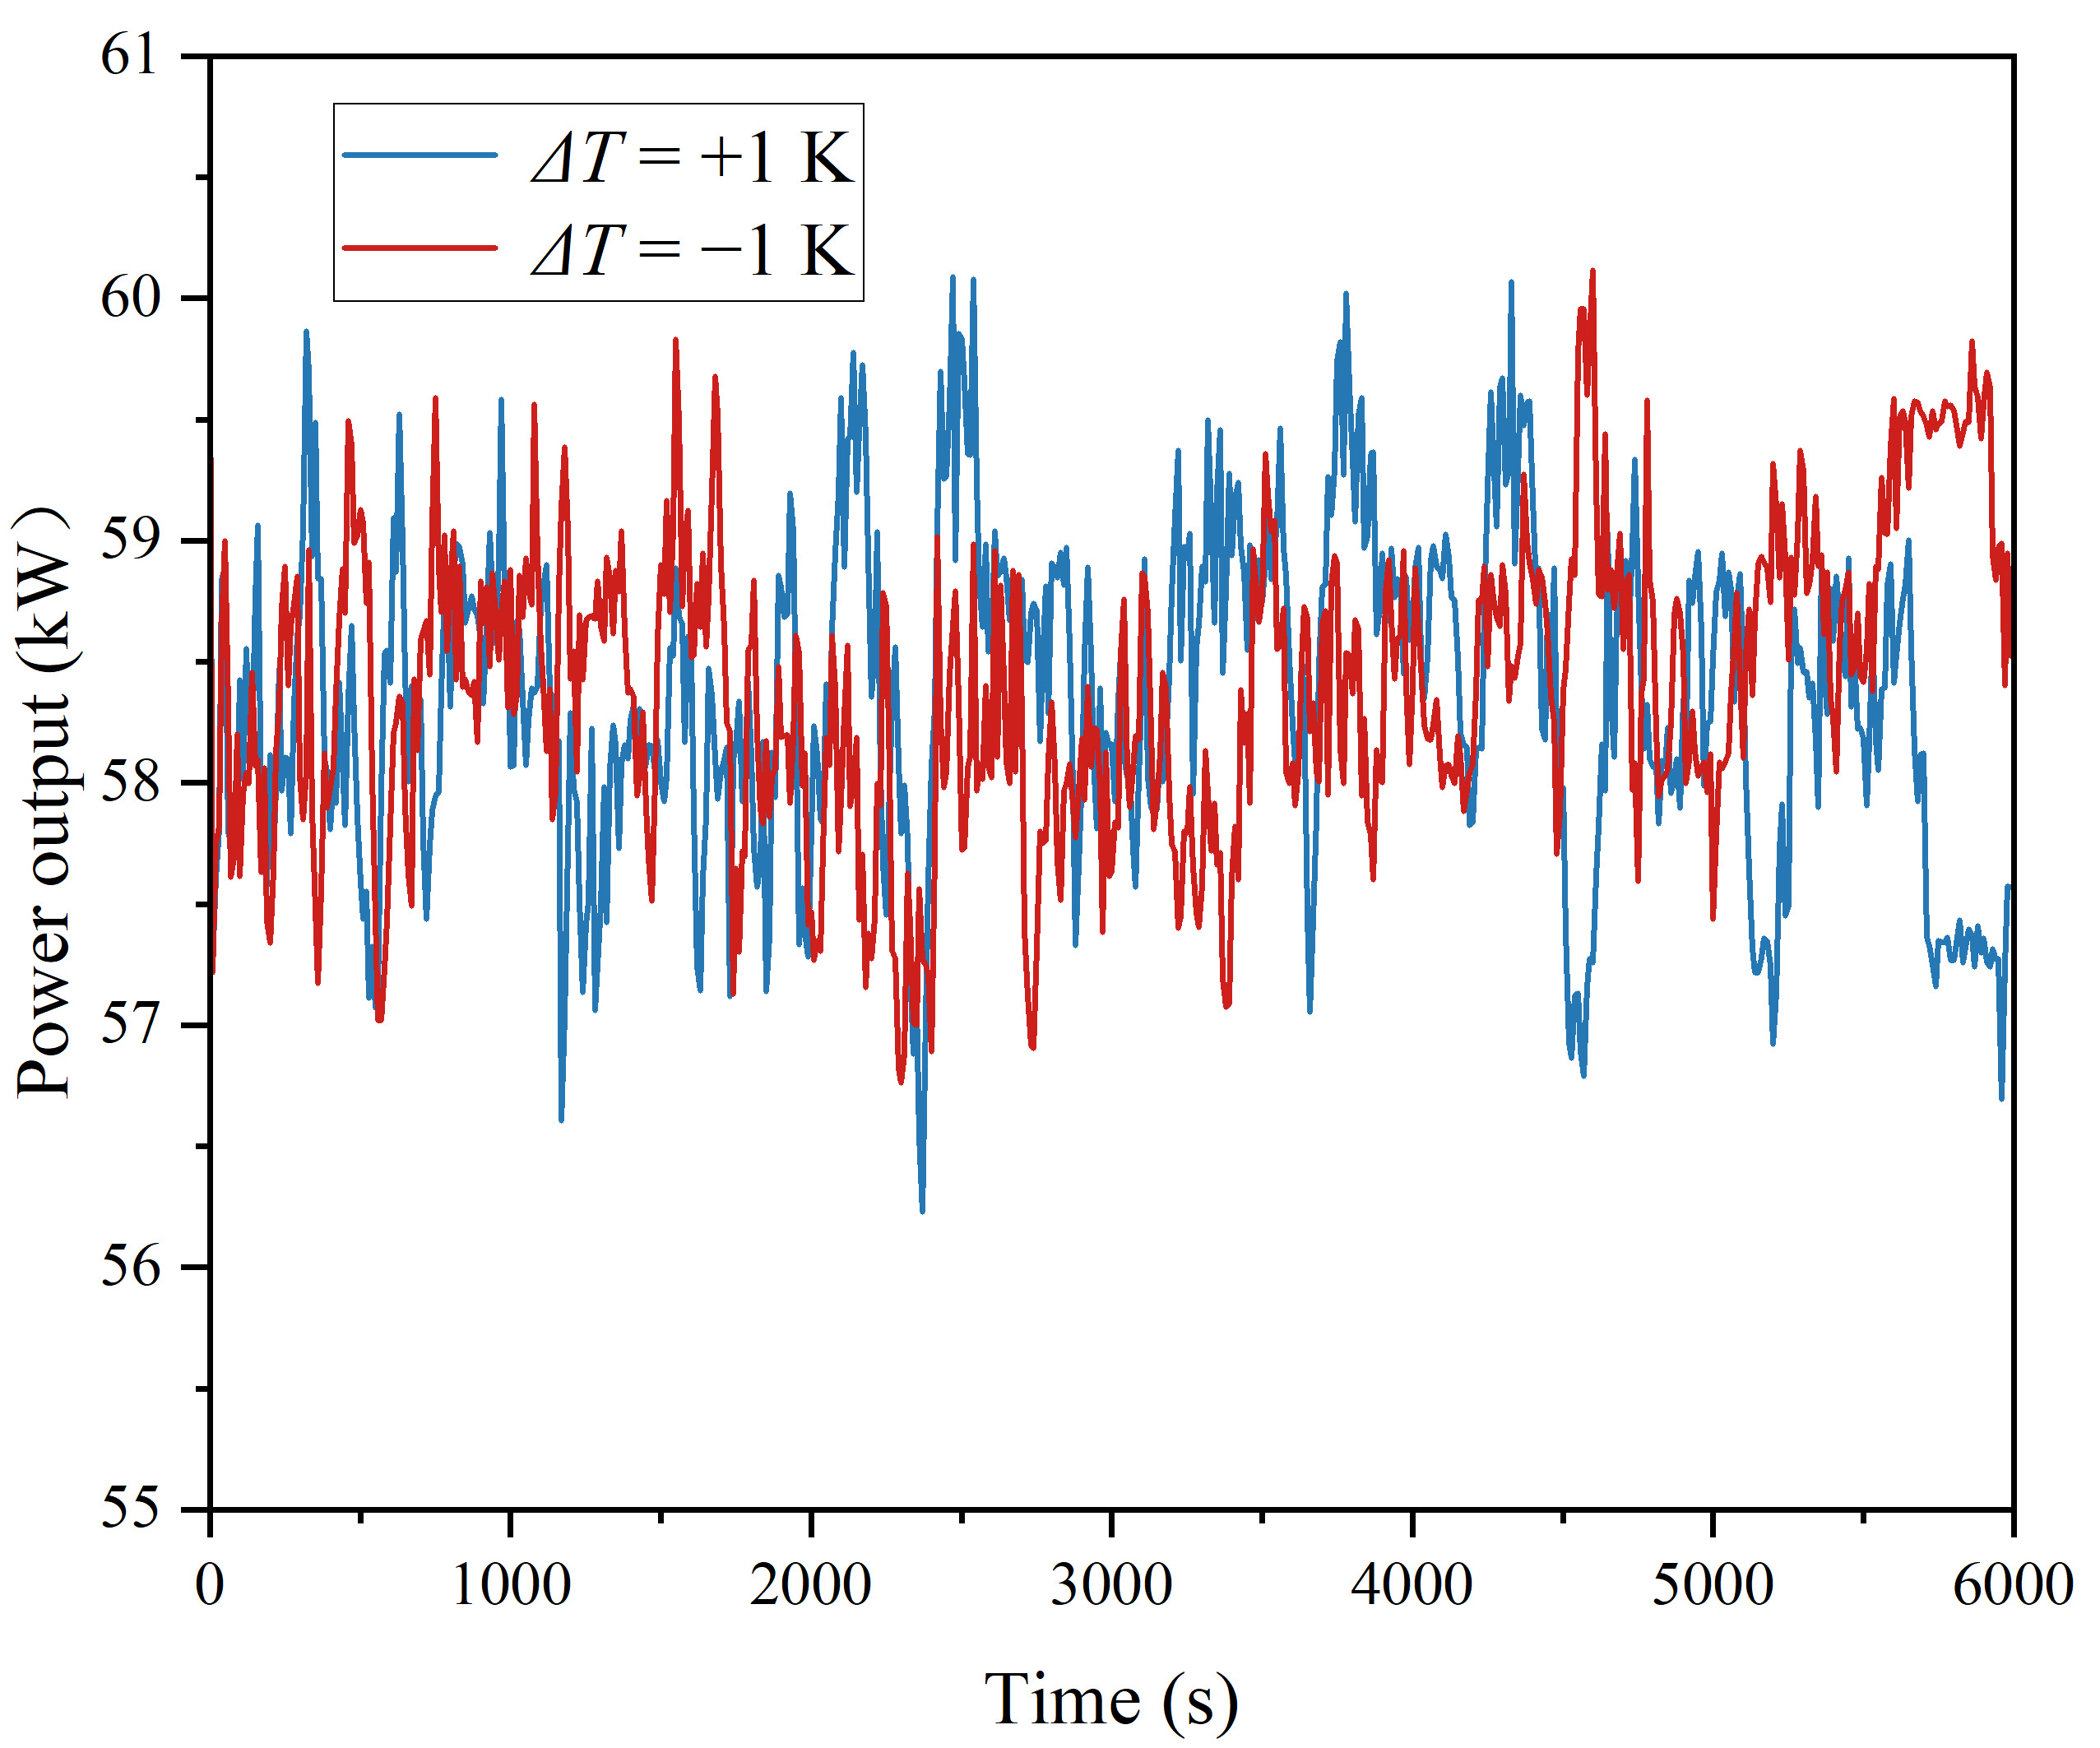
Figure 2. ORC power output. ORC: Organic rankine cycle.
Figure 3 shows the dynamic response of the BOG re-liquefaction rate to changes in BOG temperature. During the first hour, the re-liquefaction rates under different temperature disturbances remain nearly identical, as the temperature variations introduced at the BOG inlet are partially buffered by the separator through changes in internal holdup and require time to propagate through the downstream process units. After approximately one hour, the influence of the inlet temperature disturbance becomes more pronounced: the re-liquefaction rate increases when the BOG temperature decreases, while it decreases when the BOG temperature increases, resulting in a flow difference of approximately 350 kg/h.
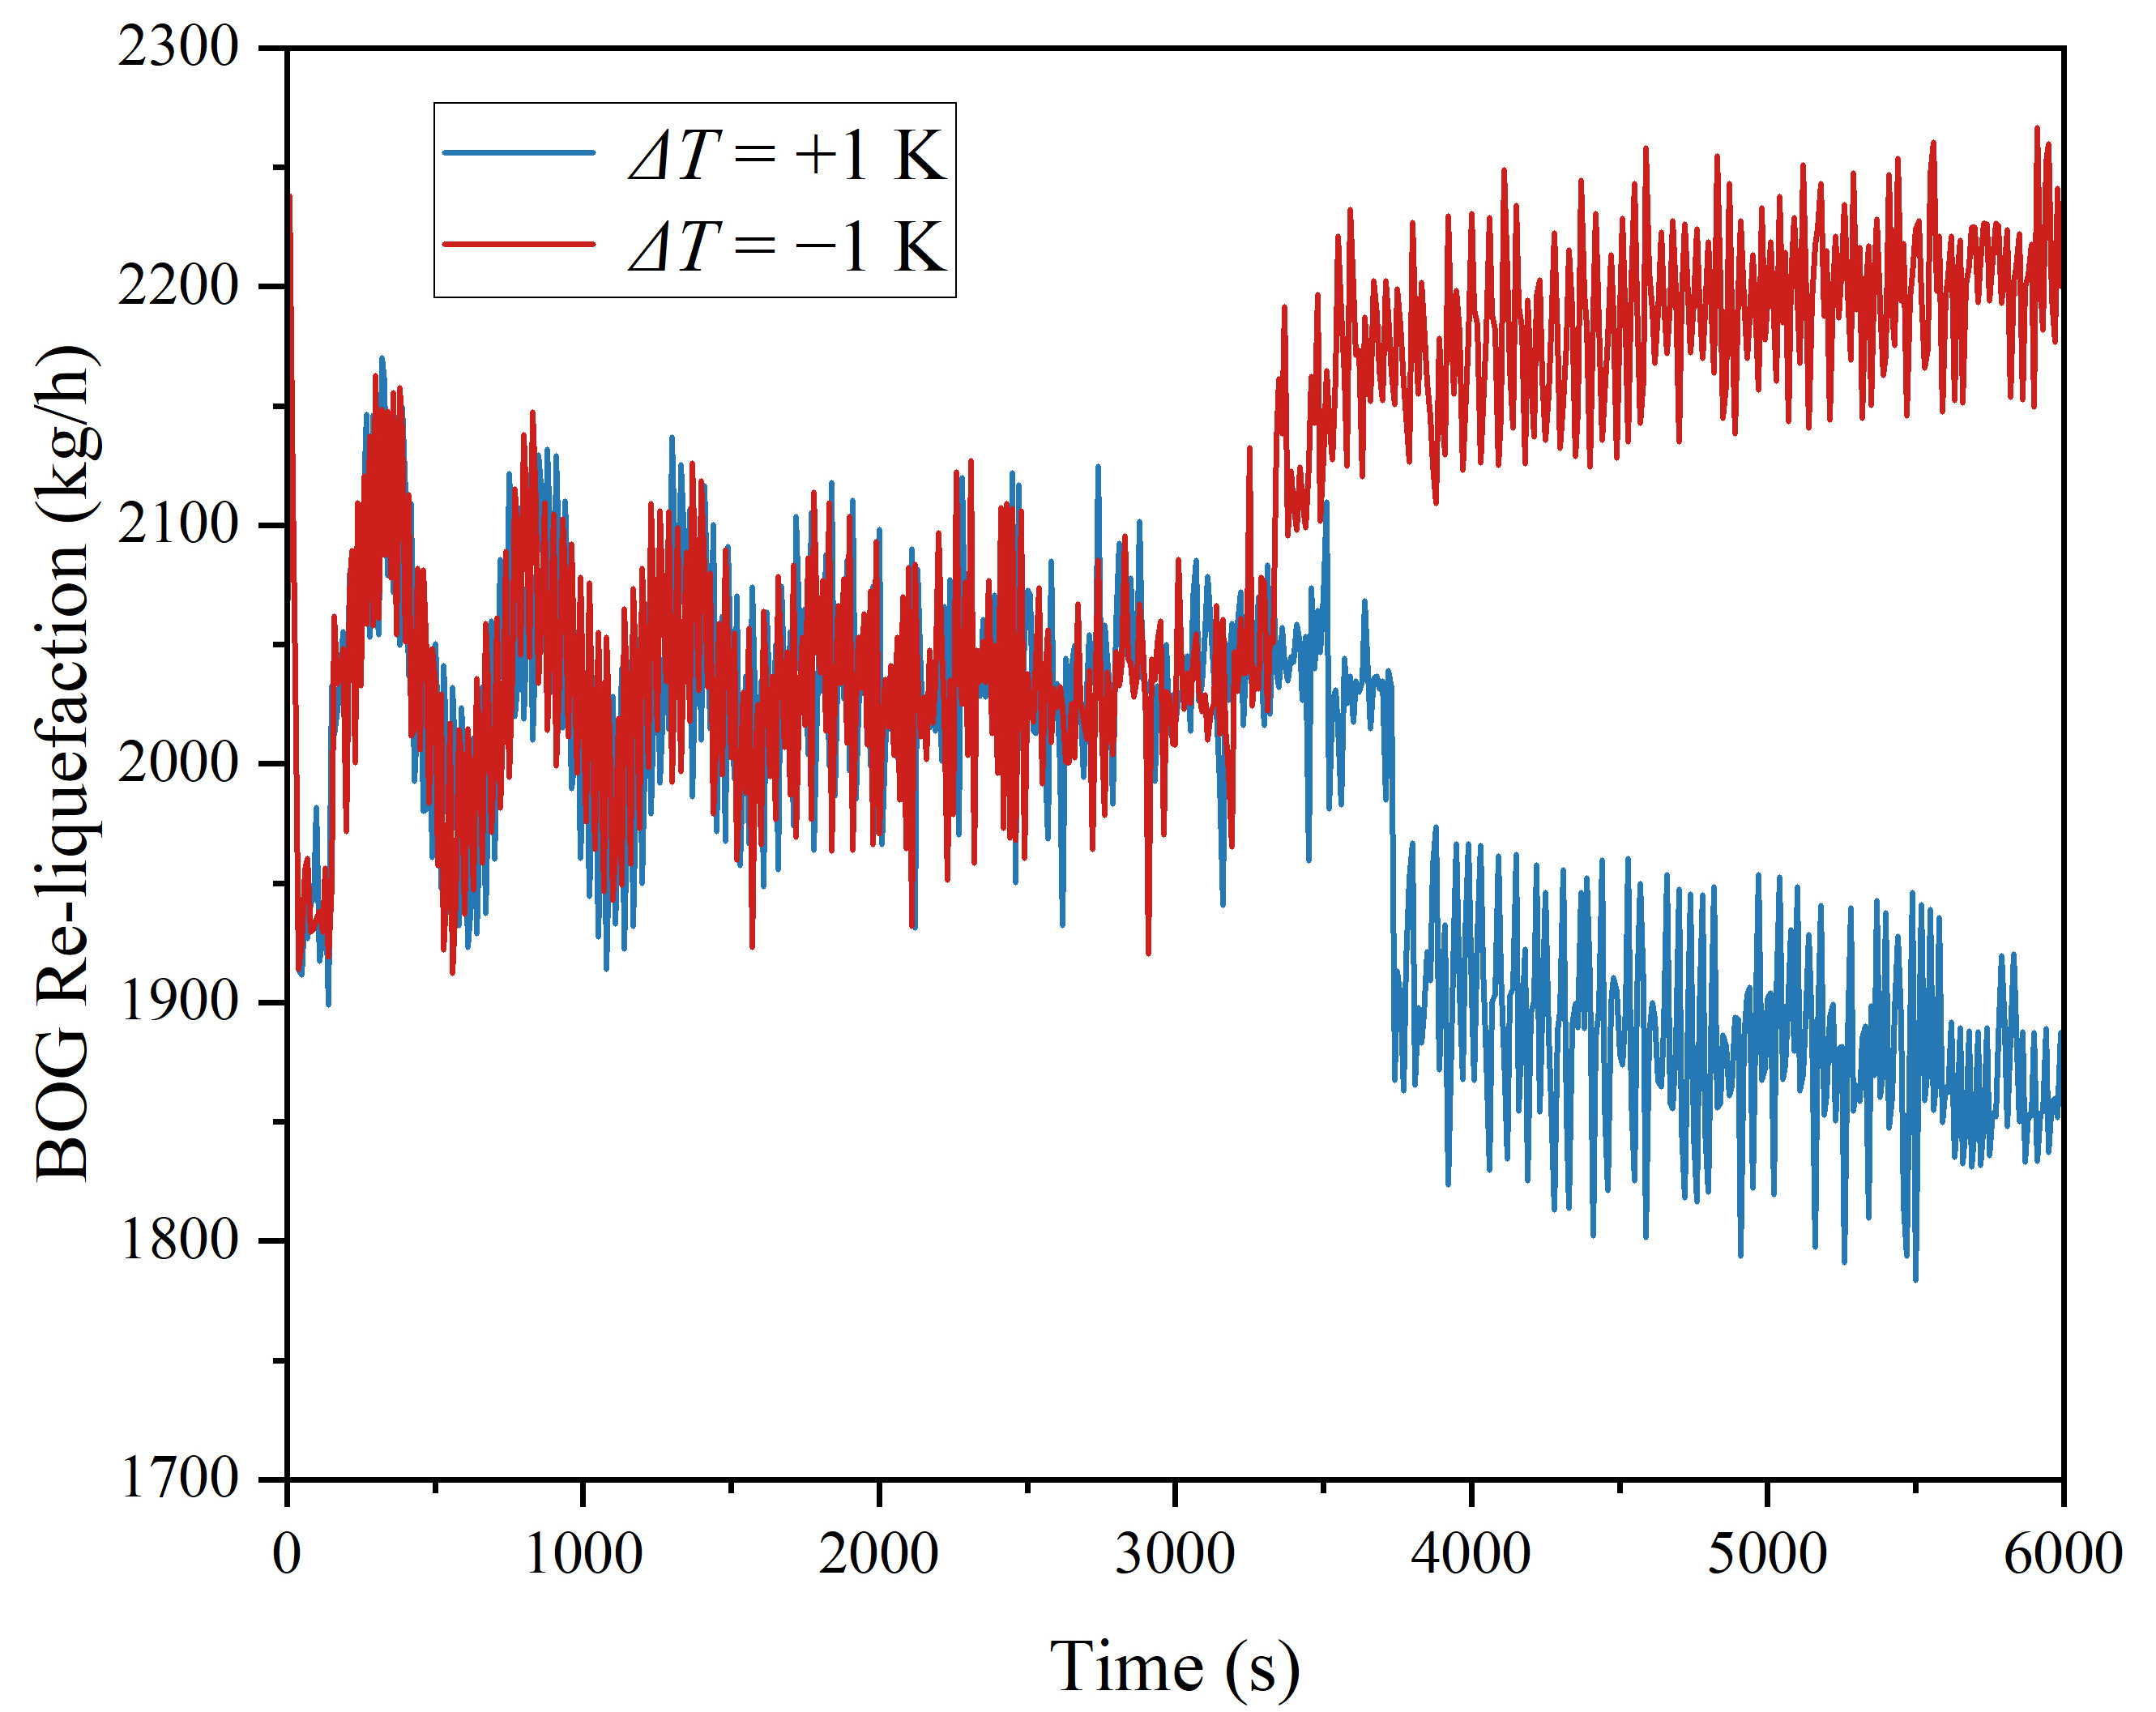
Figure 3. BOG Re-liquefaction. BOG: Boil-off gas.
3.3 Disturbance of LNG temperature
LNG spans two major subsystems, directly affecting both the BOG re-liquefaction process and the supply of cold energy to the ORC system. Based on an initial LNG temperature of -162 °C, this section further examines the dynamic responses of the BOG re-liquefaction rate and the ORC power output when the LNG temperature is increased or decreased by 1 K.
Figure 4 illustrates the dynamic response of ORC power output to variations in LNG temperature. A decrease in LNG temperature enhances the availability of cold energy, thereby maintaining a sufficient temperature difference in the ORC heat exchangers and supporting stable power generation. In contrast, an increase in LNG temperature reduces the effective cold-energy potential, leading to a gradual decline in ORC power output.
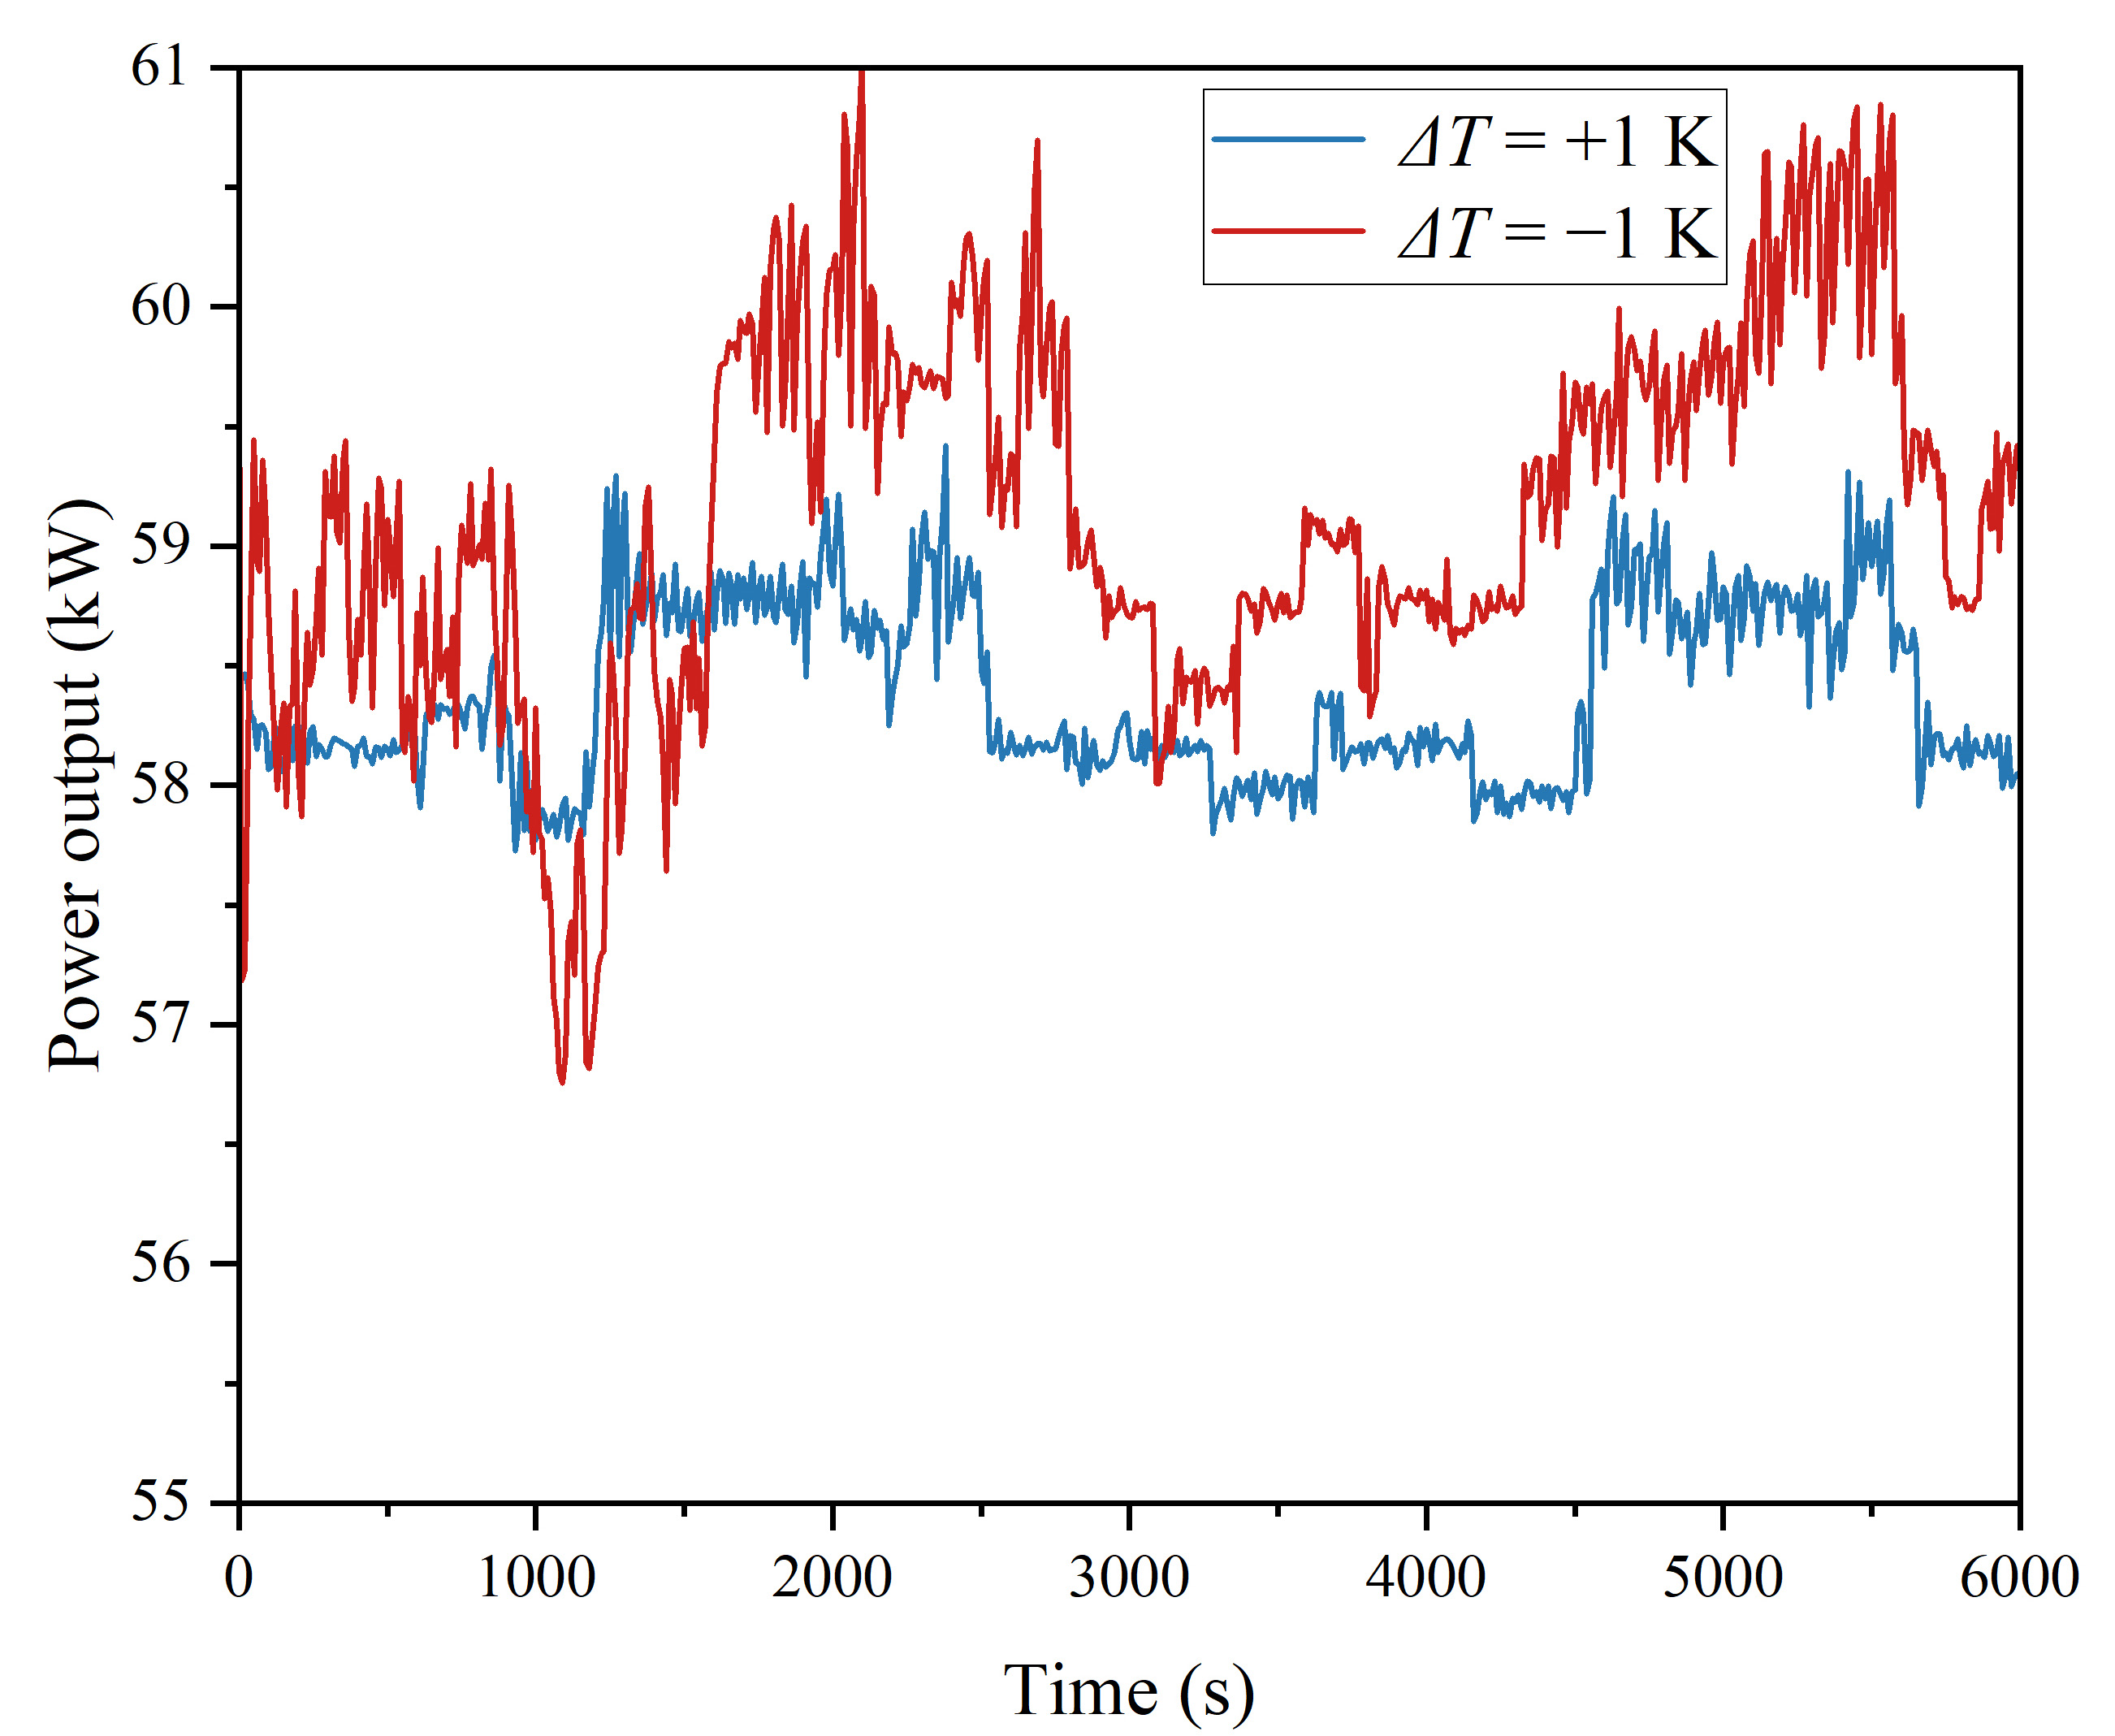
Figure 4. ORC power output. ORC: Organic rankine cycle.
Figure 5 presents the dynamic response of the BOG re-liquefaction rate to LNG temperature disturbances. As LNG is involved in the downstream stage of the BOG re-liquefaction process, temperature variations at this point induce a pronounced feedback effect on system performance. Following the initial disturbance, the combined influence of system thermal inertia and control actions drives the system toward a new equilibrium. When LNG temperature decreases, the availability of cold energy increases, gradually boosting re-liquefaction rates after transient fluctuations. Conversely, when LNG temperature increases, the reduced cooling capacity causes the system to stabilize at a lower re-liquefaction level after approximately 30 min.
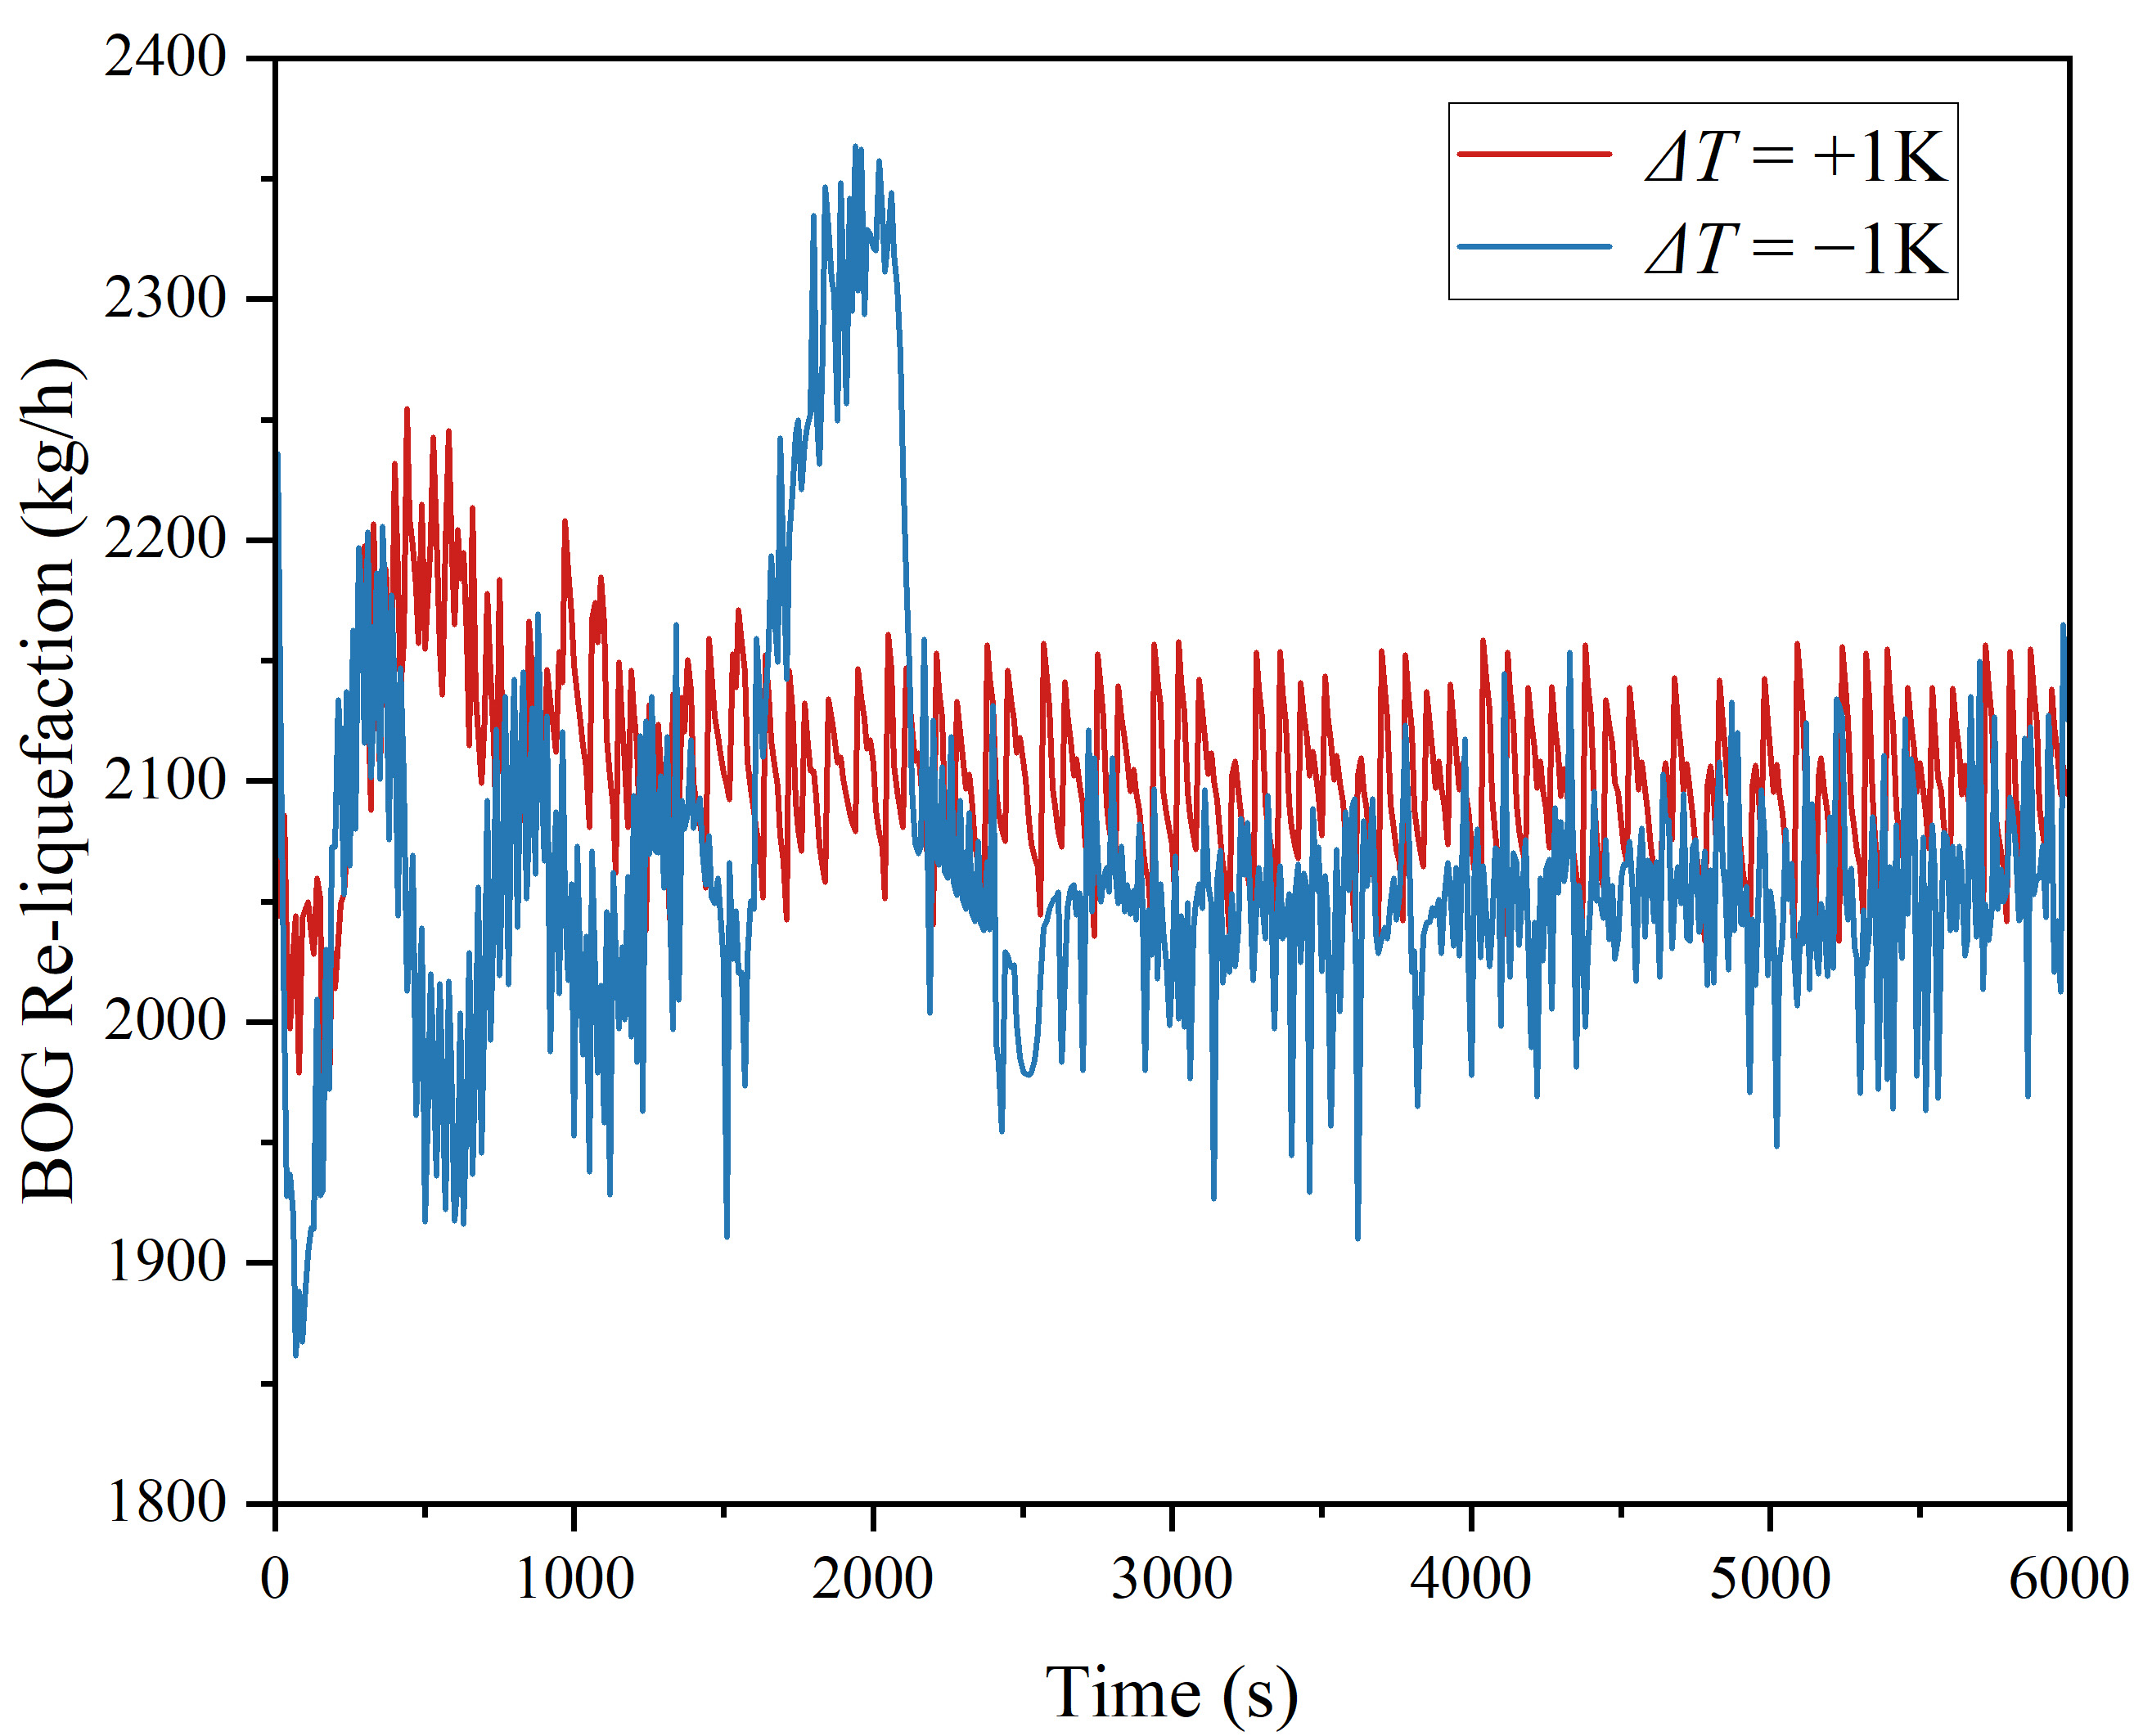
Figure 5. BOG Re-liquefaction. BOG: Boil-off gas.
3.4 Disturbance of LNG flow rate
This section examines the dynamic responses of BOG re-liquefaction and ORC power output when the LNG flow rate - initially set at 4,008 kg/h - is subjected to a ± 5% disturbance.
Figure 6 illustrates the dynamic response of the ORC power output under variations in the LNG flow rate. When the LNG flow rate increases, the available cold energy for the ORC subsystem increases accordingly, leading to a temporary rise in ORC power output. After initial fluctuations caused by system thermal inertia and control adjustments, the ORC power gradually stabilizes at approximately 66 kW after about 30 min. In contrast, a reduction in LNG flow rate decreases the available cold energy, resulting in a rapid decline in ORC power output, which eventually stabilizes at approximately 52 kW.
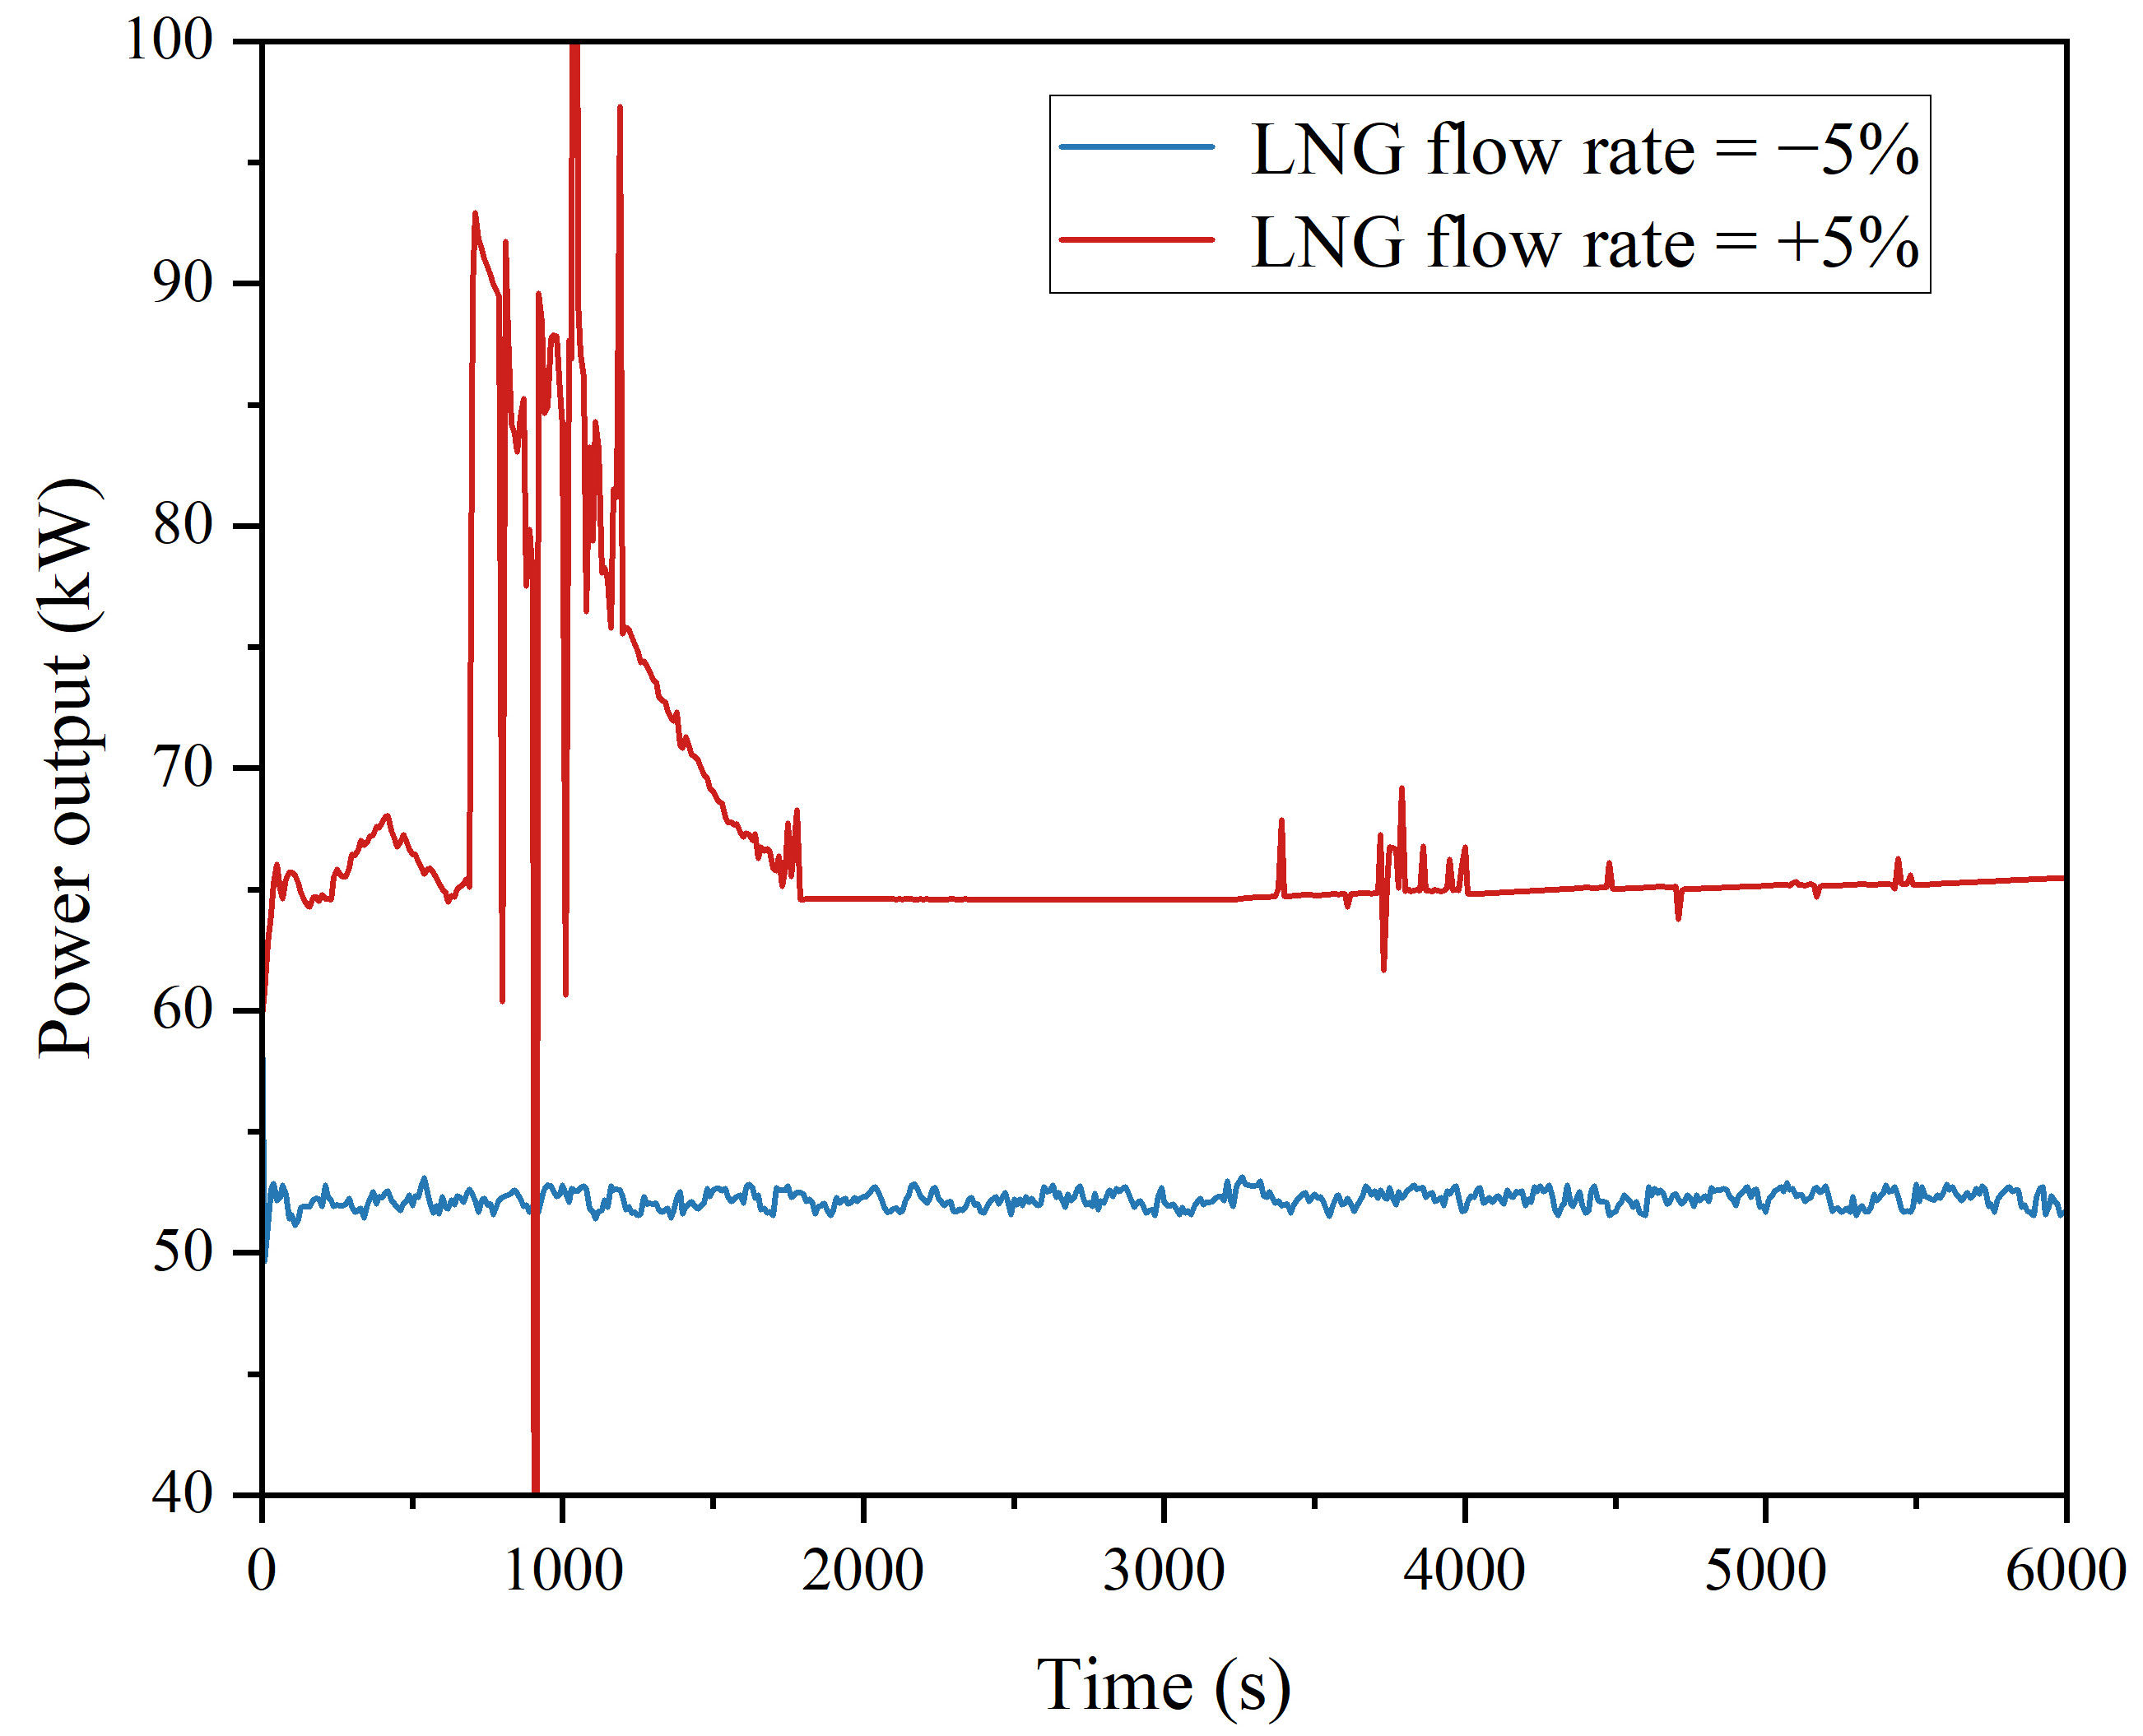
Figure 6. ORC power output. ORC: Organic rankine cycle; LNG: liquefied natural gas.
Figure 7 presents the dynamic response of the BOG re-liquefaction rate under changes in the LNG flow rate. Since the LNG flow directly determines the available cold energy for BOG condensation, an increase in LNG supply enhances the heat-transfer driving force and improves the re-liquefaction process, thereby increasing the re-liquefaction rate. Conversely, a reduction in LNG flow rate leads to insufficient cold energy to sustain effective BOG re-liquefaction, resulting in a decrease in the re-liquefaction rate until a new steady-state condition is reached.
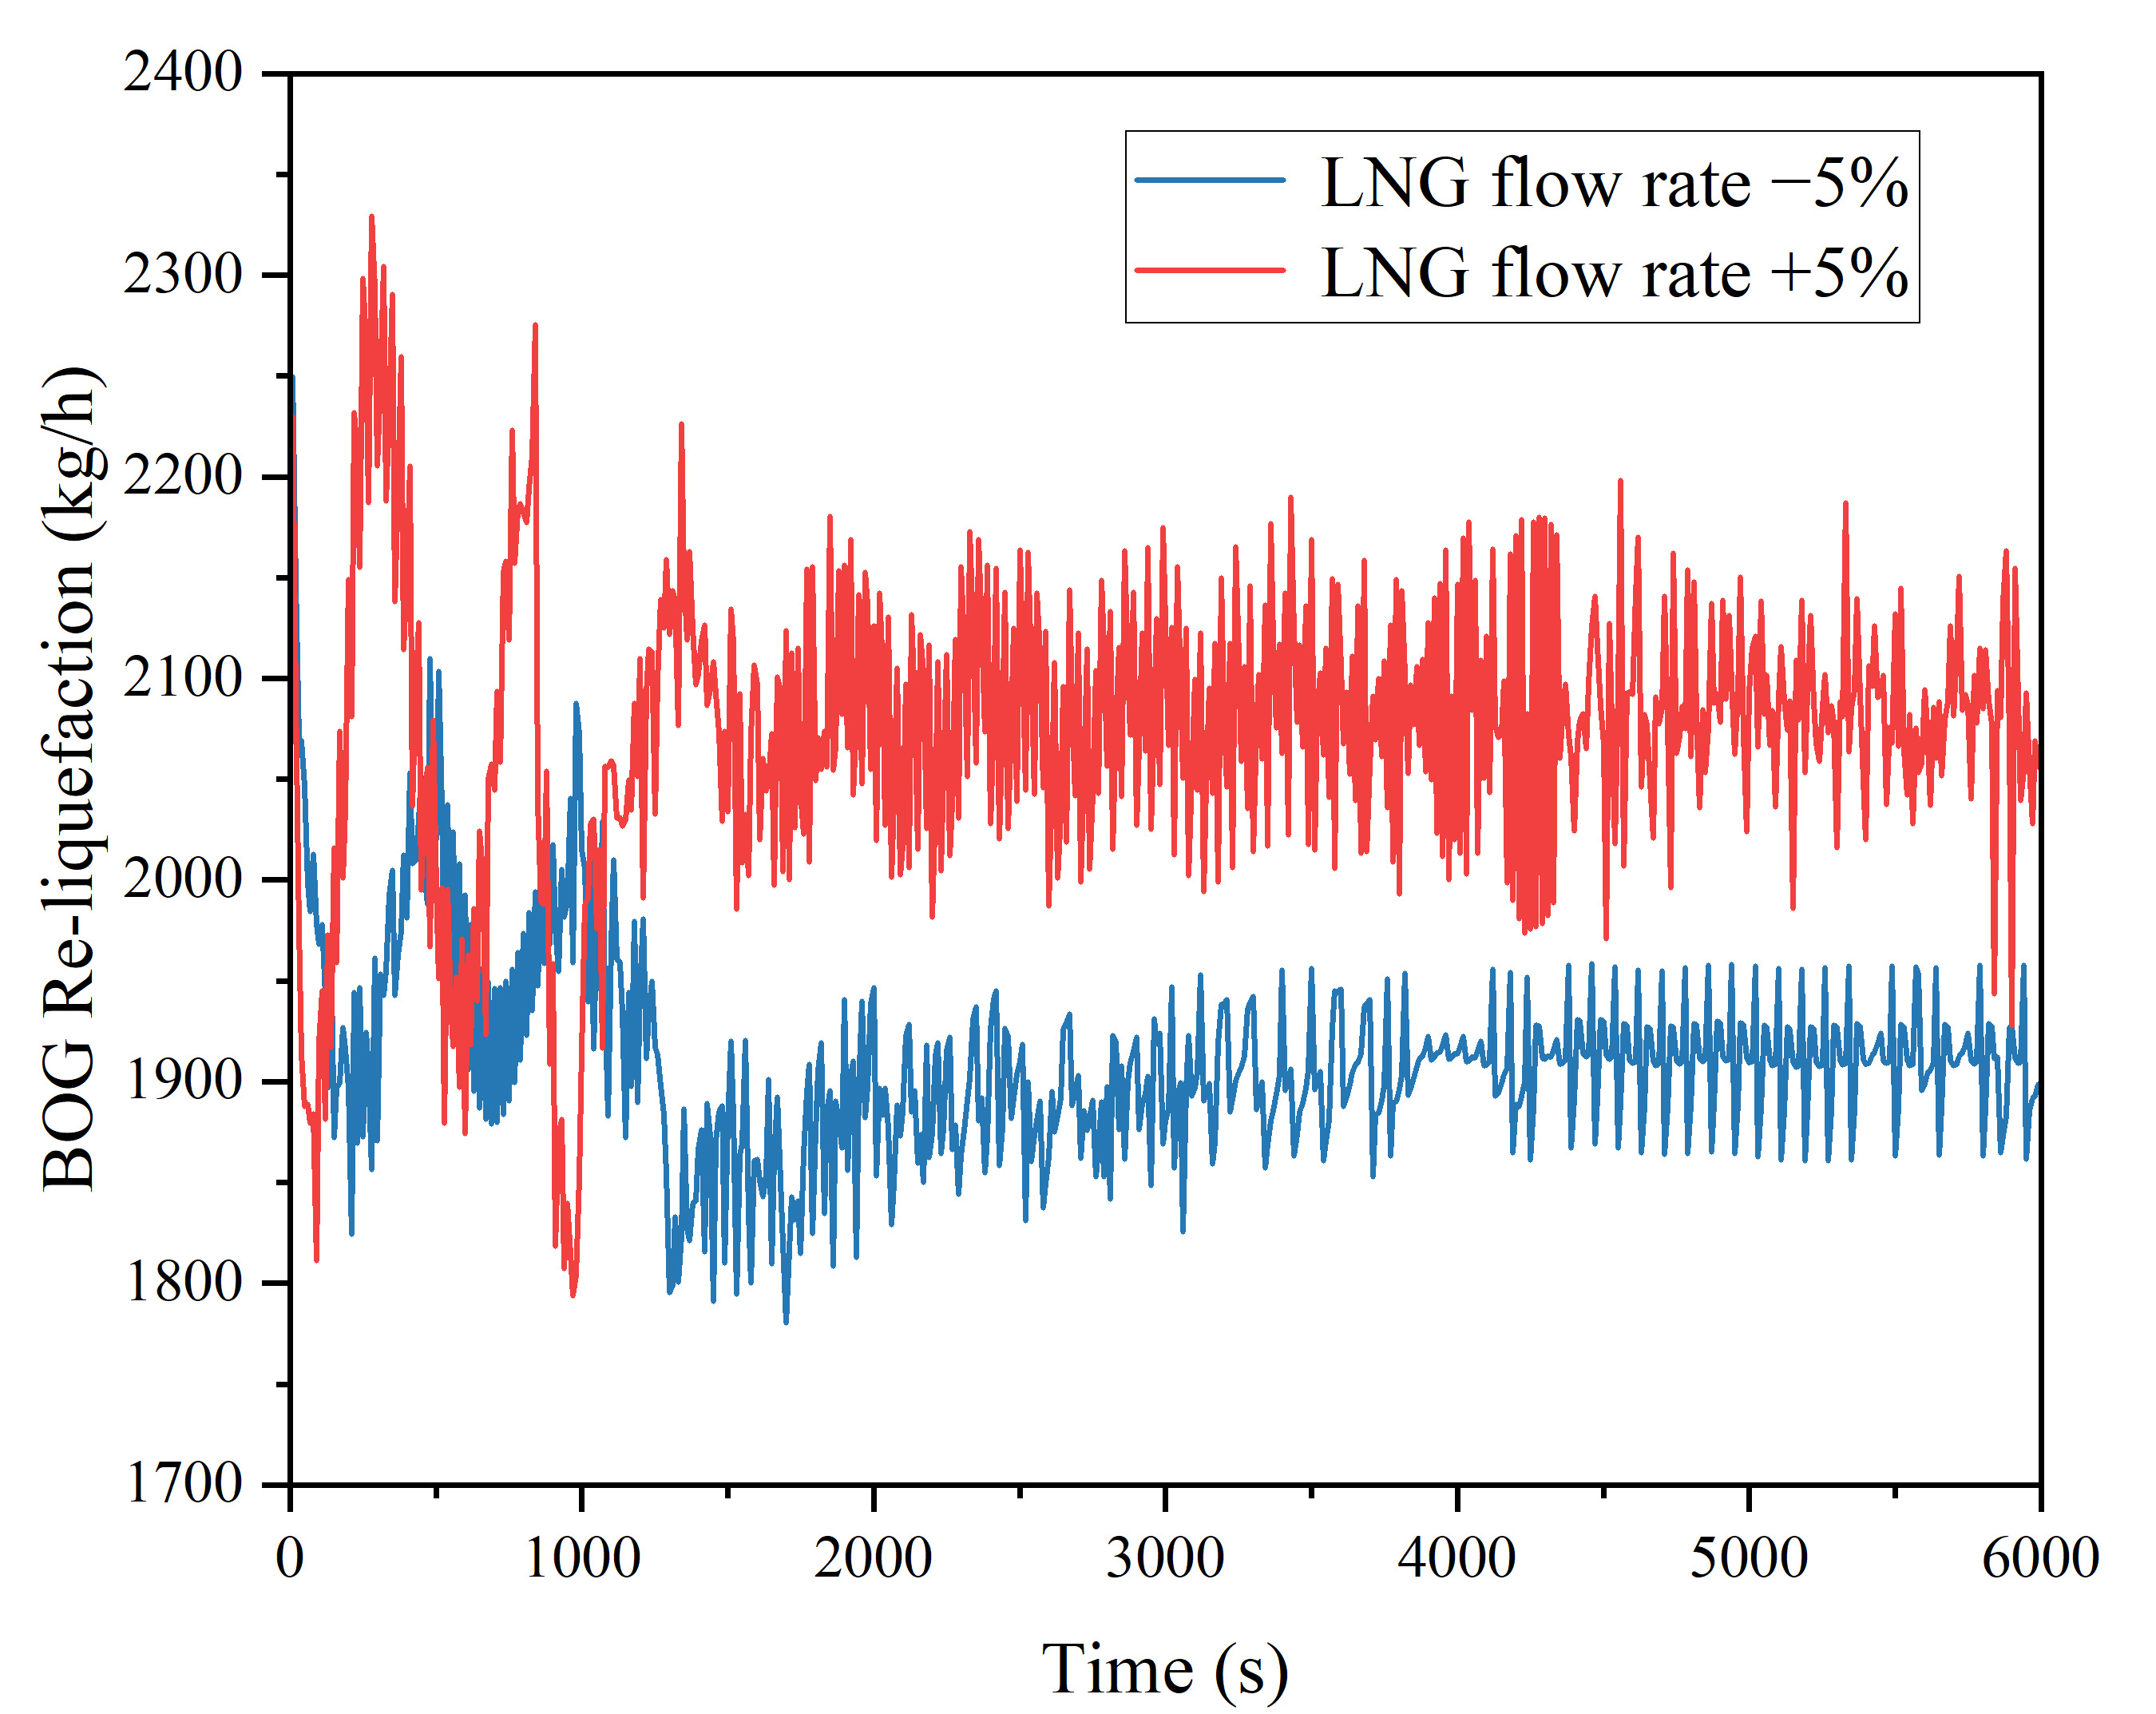
Figure 7. BOG Re-liquefaction. BOG: Boil-off gas; LNG: liquefied natural gas.
4. DISCUSION
This study establishes a dynamic model of a coupled BOG-ORC system driven by LNG cold energy to investigate the transient response characteristics of BOG re-liquefaction and ORC power generation. Particular attention is given to the effects of variations in BOG inlet temperature and LNG operating conditions on the dynamic behavior of the system. The dynamic simulation results indicate that, under the considered disturbance scenarios, all key operational parameters remain within acceptable ranges, demonstrating satisfactory operational stability of the proposed system.
Quantitative analysis shows that variations in LNG mass flow have a pronounced impact on both the BOG re-liquefaction rate and the ORC power output. As the LNG mass flow increases, the BOG re-liquefaction rate exhibits an approximately proportional rise, while the corresponding increase in ORC power output is relatively more significant. In contrast, fluctuations in BOG inlet temperature have only a limited influence on ORC power output but lead to noticeable variations in the BOG re-liquefaction rate. These results suggest that, under transient operating conditions, the availability of LNG cold energy plays a dominant role in determining the overall performance of the coupled BOG-ORC system.
In our research group’s previous studies, the thermodynamic performance and economic characteristics of the BOG-ORC system under steady-state conditions were evaluated. However, even under nominally steady operating conditions, discrepancies can be observed between dynamic simulation results and steady-state simulations performed in Aspen HYSYS. Such discrepancies provide valuable information for improving the accuracy of thermodynamic performance evaluation and economic analysis. Furthermore, the present study demonstrates the influence of LNG and BOG disturbances on system performance, which lays a foundation for future investigations involving full-route energy consumption and economic assessment of LNG-fueled vessels.
Several limitations of the present study should be acknowledged. Constant isentropic efficiencies are assumed for compressors and expanders, and heat losses in LNG storage tanks and pipelines are neglected, which may lead to deviations between model predictions and practical operation. In addition, after two stages of cold-energy cascading, the LNG temperature remains relatively low, indicating that the residual cold-energy potential has not been fully utilized. Finally, since the dynamic simulations are initiated from a steady-state operating condition, cold-start operation is not considered in the current model.
5. CONCLUSIONS
A dynamic model of a coupled BOG-ORC system utilizing LNG cold energy was developed and analyzed. The simulation results indicate that the system maintains stable operation under transient variations in LNG mass flow and BOG inlet temperature. Variations in LNG mass flow rate have a pronounced effect on both the BOG re-liquefaction rate and the ORC power output, whereas changes in BOG temperature mainly influence the re-liquefaction performance. The proposed system demonstrates promising engineering applicability for LNG-fueled vessels by enabling effective BOG management and the recovery of LNG cold energy for power generation.
DECLARATIONS
Authors’ contributions
Performed the system modeling, simulations, data analysis, and manuscript drafting: Dong, H.
Conceived the research topic, supervised the overall study, and contributed to manuscript review and revision: Tian, Z.
Availability of data and materials
The data supporting the findings of this study were generated through dynamic simulations conducted using Aspen HYSYS. The simulation results depend on model configurations, initial conditions, and numerical solution procedures; therefore, the raw simulation data are not publicly available. However, relevant data and model details can be made available from the corresponding author upon reasonable request.
AI and AI-assisted tools statement
During the preparation of this manuscript, the AI tool ChatGPT (ChatGPT 5.5, released 2026-4-23) was used solely for language editing. The tool did not influence the study design, data collection, analysis, interpretation, or the scientific content of the work. All authors take full responsibility for the accuracy, integrity, and final content of the manuscript.
Financial support and sponsorship
This work was supported by the National Natural Science Foundation of China (No.52476011) and the Shanghai Rising-Star Program (23QA1404400). The authors also acknowledge support from the Shanghai Frontiers Science Center of “Full Penetration” Far-reaching Offshore Ocean Energy and Power.
Conflicts of interest
All authors declared that there are no conflicts of interest.
Ethical approval and consent to participate
Not applicable.
Consent for publication
Not applicable.
Copyright
© The Author(s) 2026.
REFERENCES
1. Gür, T. M. Carbon dioxide emissions, capture, storage and utilization: review of materials, processes and technologies. Progr. Energy. Combust. Sci. 2022, 89, 100965.
2. Du, X. Thoughts on strategies and paths to achieve carbon peaking and carbon neutrality in China. Front. Energy. 2023, 17, 324-31.
3. Abrahams, L. S.; Samaras, C.; Griffin, W. M.; Matthews, H. S. Life cycle greenhouse gas emissions from U.S. liquefied natural gas exports: implications for end uses. Environ. Sci. Technol. 2015, 49, 3237-45.
4. Lin, N.; Ouyang, X. Global liquified natural gas trade under energy transition. Energies 2021, 14, 6617.
5. Yarlagadda, B.; Iyer, G.; Binsted, M.; Patel, P.; Wise, M.; McLeod, J. The future evolution of global natural gas trade. iScience 2024, 27, 108902.
6. He, T.; Chong, Z. R.; Zheng, J.; Ju, Y.; Linga, P. LNG cold energy utilization: prospects and challenges. Energy. 2019, 170, 557-68.
7. Wang, Z. Progress of LNG cold energy cascade utilization research. Acad. J. Sci. Technol. 2025, 14, 196-200.
8. Tian, Z.; Zhou, Y.; Bolat, P.; Zhang, Y.; Gao, W. Responding to low-carbon shipping via a novel BOG-ORC-CCS system onboard LNG carrier: 4E analyses and optimization. J. Clean. Prod. 2024, 478, 143959.
9. Syauqi, A.; Uwitonze, H.; Chaniago, Y. D.; Lim, H. Design and optimization of an onboard boil-off gas re-liquefaction process under different weather-related scenarios with machine learning predictions. Energy. 2024, 293, 130674.
10. Li, N.; Wang, J.; Liu, R.; Höök, M. Methane emission reduction in China’s natural gas industry: construction of technology inventory and selection of optimal technology programs. Sustain. Prod. Consum. 2024, 44, 39-54.
11. Gómez, J. R.; Gómez, M. R.; Garcia, R. F.; Catoira, A. D. M. On board LNG reliquefaction technology: a comparative study. Pol. Marit. Res. 2013, 21, 77-88.
12. Kochunni, S. K.; Chowdhury, K. Use of dual pressure Claude liquefaction cycles for complete and energy-efficient reliquefaction of boil-off gas in LNG carrier ships. Energy 2020, 198, 117345.
13. Guo, T.; Liu, L.; Shen, J.; et al. Optimization and control strategy of BOG re-liquefaction process for LNG vessels. Int. J. Refrig. 2023, 153, 253-65.
14. Kim, J. S.; Kim, D. Y. Energy, exergy, and economic (3E) analysis of boil-off gas re-liquefaction systems using LNG cold energy for LNG-fueled ships. J. Mar. Sci. Eng. 2023, 11, 587.
15. Kochunni, S. K.; Chowdhury, K. LNG boil-off gas reliquefaction by Brayton refrigeration system - Part 1: exergy analysis and design of the basic configuration. Energy 2019, 176, 753-64.
16. Son, S. H.; Kim, K. Simulation model of regenerative LNG refrigeration system for Re-liquification of BOG. Energies 2020, 13, 3894.
17. Lee, S.; Jeon, J.; Lee, U.; Lee, C. J.; Han, C. A novel dynamic modeling methodology for boil-off gas recondensers in liquefied natural gas terminals. J. Chem. Eng. Jpn. 2015, 48, 841-7.
18. Shin, K.; Son, S.; Moon, J.; Jo, Y.; Kwon, J. S. I.; Hwang, S. Dynamic modeling and predictive control of boil-off gas generation during LNG loading. Comput. Chem. Eng. 2022, 160, 107698.
19. Kurle, Y. M.; Xu, Q.; Palanki, S. Dynamic simulation study for boil-off gas minimization at liquefied natural gas exporting terminals. Ind. Eng. Chem. Res. 2018, 57, 5903-13.
20. Noor Akashah, M. H.; Rozali, N. E. M.; Mahadzir, S.; Liew, P. Y. Utilization of cold energy from LNG regasification process: a review of current trends. Processes 2023, 11, 517.
21. Kanbur, B. B.; Xiang, L.; Dubey, S.; Choo, F. H.; Duan, F. Cold utilization systems of LNG: a review. Renew. Sustain. Energy. Rev. 2017, 79, 1171-88.
22. Qyyum, M. A.; Khan, A.; Ali, S.; et al. Assessment of working fluids, thermal resources and cooling utilities for organic Rankine cycles: state-of-the-art comparison, challenges, commercial status, and future prospects. Energy. Convers. Manage. 2022, 252, 115055.
23. Sun, Z.; Lai, J.; Wang, S.; Wang, T. Thermodynamic optimization and comparative study of different ORC configurations utilizing the exergies of LNG and low grade heat of different temperatures. Energy 2018, 147, 688-700.
24. Pan, J.; Li, M.; Zhu, M.; Li, R.; Tang, L.; Bai, J. Energy, exergy and economic analysis of different integrated systems for power generation using LNG cold energy and geothermal energy. Renew. Energy. 2023, 202, 1054-70.
25. Joy, J.; Chowdhury, K. Appropriate number of stages of an ORC driven by LNG cold energy to produce acceptable power with reasonable surface area of heat exchangers. Cryogenics 2022, 128, 103599.
26. Zhou, T.; Liu, J.; Ren, J.; Yang, S. Thermodynamic analysis and optimization of a multi-stage Rankine cycle power system combining with hydrate energy storage for liquefied natural gas cold energy utilization. J. Energy. Storage. 2022, 56, 105974.
27. Calise, F.; d’Accadia, M. D.; Vanoli, L.; Vicidomini, M. Exergetic and exergoeconomic analysis of a novel hybrid solar-geothermal polygeneration system producing energy and water. Energy. Convers. Manag. 2016, 115, 200-20.
28. Wang, C.; Zhang, Y.; Hou, H.; Zhang, J.; Xu, C. Transient performance study of high pressure fuel gas supply system for LNG fueled ships. Cryogenics 2022, 125, 103510.
29. He, T.; Ma, J.; Mao, N.; Qi, M.; Jin, T. Exploring the stability and dynamic responses of dual-stage series ORC using LNG cold energy for sustainable power generation. Appl. Energy. 2024, 372, 123735.
30. Aspen Technology, Inc. Aspen HYSYS Unit Operations V11 Reference Guide. Aspen Technology: Bedford, MA, USA, 2019. https://esupport.aspentech.com/S_Article?id=000052892 (accessed 2026-04-28).
31. Obalanlege, M. A.; Xu, J.; Markides, C. N.; Mahmoudi, Y. Techno-economic analysis of a hybrid photovoltaic-thermal solar-assisted heat pump system for domestic hot water and power generation. Renew. Energy. 2022, 196, 720-36.
32. He, T.; Ju, Y. Dynamic simulation of mixed refrigerant process for small-scale LNG plant in skid mount packages. Energy 2016, 97, 350-8.
33. Joseph, S. B.; Dada, E. G.; Abidemi, A.; Oyewola, D. O.; Khammas, B. M. Metaheuristic algorithms for PID controller parameters tuning: review, approaches and open problems. Heliyon 2022, 8, e09399.
34. Liu, Y.; Shi, X.; Laurenceson, J. Dynamics of Australia’s LNG export performance: a modified constant market shares analysis. Energy. Econ. 2020, 89, 104808.
35. The Oxford Institute for Energy Studies. The LNG Shipping Forecast: costs rebounding, outlook uncertain. Oxford, UK; 2018. https://globallnghub.com/wp-content/uploads/2018/03/The-LNG-Shipping-Forecast-costs-rebounding-outlook-uncertain-Insight-27.pdf (accessed 2026-04-22).
Cite This Article
How to Cite
Download Citation
Export Citation File:
Type of Import
Tips on Downloading Citation
Citation Manager File Format
Type of Import
Direct Import: When the Direct Import option is selected (the default state), a dialogue box will give you the option to Save or Open the downloaded citation data. Choosing Open will either launch your citation manager or give you a choice of applications with which to use the metadata. The Save option saves the file locally for later use.
Indirect Import: When the Indirect Import option is selected, the metadata is displayed and may be copied and pasted as needed.
About This Article
Copyright

Data & Comments
Data
0


Comments
Comments must be written in English. Spam, offensive content, impersonation, and private information will not be permitted. If any comment is reported and identified as inappropriate content by OAE staff, the comment will be removed without notice. If you have any queries or need any help, please contact us at [email protected].