


Benefits of photovoltaic development on abandoned mines for carbon neutrality in China
 0
0 Abstract
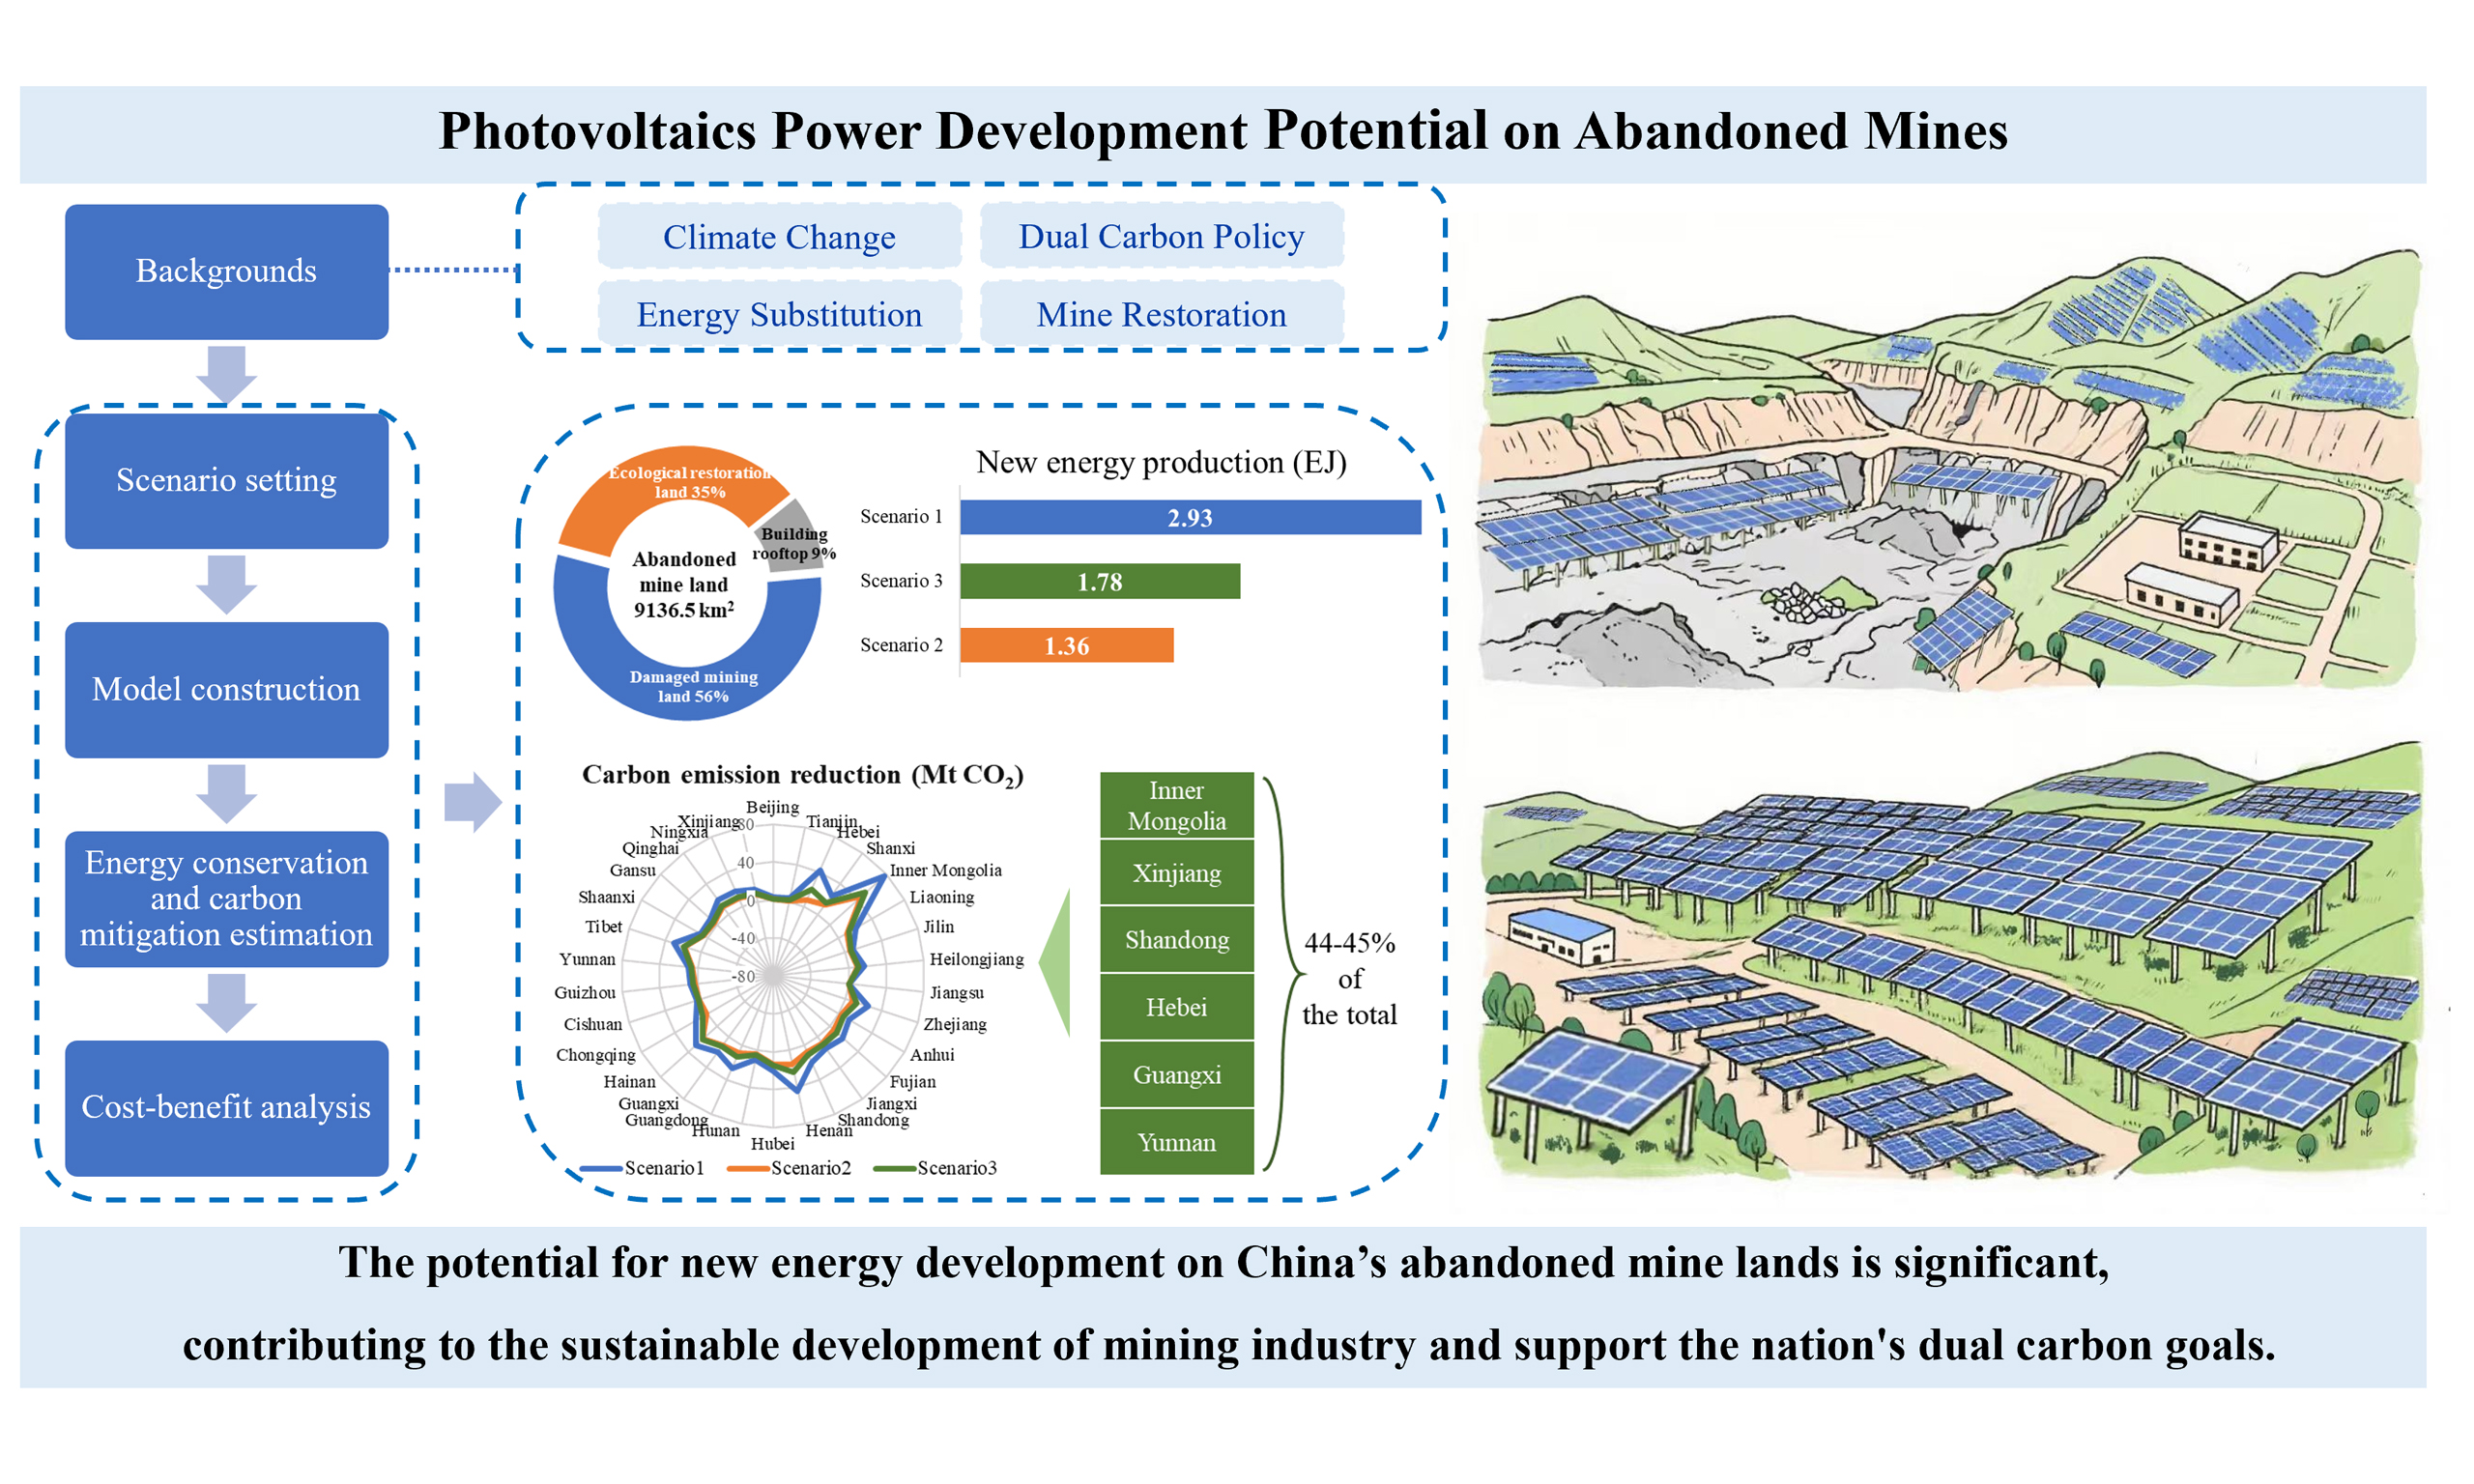
Amid increasing pressure to reduce carbon emissions and address the energy crisis, solar power has emerged as a key alternative to fossil fuels. China possesses extensive abandoned open-pit mines suitable for photovoltaic (PV) power development; however, their carbon mitigation and energy conservation potential remains largely underutilized. In this study, we develop an integrated model to quantify the life-cycle carbon mitigation potential of PV systems on these mines, combining PV power generation with ecological restoration of mine sites. The results indicate that developing PV systems on abandoned open-pit mines in China could generate 1.34-2.93 EJ yr-1 of renewable energy and reduce CO2 emissions by 278.85-613.79 Mt yr-1, accounting for 5.9%-12.8% of China’s coal-fired power generation and 2.8%-6.2% of its carbon emissions in 2020. Replacing conventional electricity with PV power yields greater carbon mitigation (611.63 t CO2 ha-1) than bioenergy alternatives, including biopower (102.96 t CO2 ha-1), ethanol (61.99 t CO2 ha-1), and biodiesel (17.13 t CO2 ha-1). Inner Mongolia, Xinjiang, Shandong, Hebei, Guangxi, and Yunnan were identified as key provinces with high renewable energy production and corresponding CO2 mitigation potential, collectively contributing 44%-45% of the total mitigation potential. Overall, an energy-oriented ecological restoration model, such as the “PV+” scenarios for abandoned open-pit mines, is economically feasible. This study provides geographically tailored information to help decision-makers optimize the use of multifunctional land resources, supporting the green transformation of the mining industry and advancing China’s dual carbon targets.
Keywords
INTRODUCTION
Climate change poses a global challenge to humanity, and mitigation efforts have drawn attention from academia, governments, and industry. The development of renewable energy is crucial in this fight against carbon emissions[1]. Among renewable energy sources, solar photovoltaic (PV) systems are an attractive option for residential, commercial, and industrial applications due to their high adaptability, simple operation, and low maintenance requirements. Additionally, they emit almost no pollutants or greenhouse gases directly during the operational phase[2]. Rapid technological advances and declining PV costs have facilitated widespread PV adoption, accelerating the decarbonization of the power sector[3]. The International Renewable Energy Agency (IRENA) projects that PV will account for approximately 25% of global electricity generation by 2050, becoming one of the dominant energy sources[4]. China has been actively promoting PV development. By the end of 2024, its cumulative installed PV capacity had reached 887 GWac[5], accounting for approximately 39% of the global capacity (2,246 GWp)[6,7]. However, as PV deployment continues to expand, land-use conflicts associated with solar infrastructure are becoming increasingly prominent[8].
Extensive mining activities have resulted in significant land abandonment. Conservative estimates suggest that the area of existing exposed mining sites exceeds 100,000 km2 worldwide[9]. These inadequately remediated sites hinder repurposing efforts and represent an increasingly urgent concern amid intensifying global land-use conflicts. Integrating PV systems with abandoned open-pit mine land offers a mutually beneficial solution that can enhance land utilization while promoting renewable energy generation[9,10]. Countries worldwide are actively redeveloping abandoned mine sites into clean energy hubs. For example, the U.S. Environmental Protection Agency (EPA) has identified 17,756 mine sites spanning 1.5 million acres that are suitable for renewable energy development, which could provide 89 GWp of renewable energy, enough to power about 6.7 million homes[11]. Germany’s Witznitz Energy Park, Europe’s largest solar park, exemplifies the successful shift from coal mining to renewable energy production, with an installed capacity of 650 MWp[12]. At South Korea’s Sangdong mine, the 3 MW PV system installed on the mine tailing dam is estimated to generate 3,509 MWh of electricity annually, providing an efficient option for the sustainable development of abandoned mine land[13]. The world’s largest floating solar power plant was inaugurated in a collapsed coal mine in China, with an installed capacity of 70 MWp, enough to supply electricity to
Under the “polluter pays” principle and the legal obligations for mine ecological restoration, mining enterprises are mandated to carry out environmental rehabilitation. However, conventional restoration approaches typically involve substantial investment with limited financial returns, thereby reducing economic incentives and constraining proactive engagement[20]. Integrating ecological restoration with renewable energy development provides a viable pathway to overcome this dilemma and unlock value from abandoned mines[8]. In the context of the transition from dual controls on energy consumption to dual controls on carbon emissions, and under pressure from the carbon border adjustment mechanism (CBAM), the mining industry is increasingly exploring low-carbon energy technologies to mitigate carbon constraints[21]. Incorporating PV systems into ecological reclamation not only facilitates compliance with carbon control targets but also fulfills mandatory land rehabilitation requirements[22]. This integrated approach promotes sustainable mine restoration and contributes to achieving China’s “dual carbon” targets[10].
China has a large number of abandoned open-pit mines[23]; however, the potential for PV development in these areas remains insufficiently explored and comprehensively evaluated, particularly in the context of mine ecological restoration. This study aims to: (1) construct a multi-scenario framework for synergistic PV development and ecological restoration in mining areas; (2) quantify the energy conservation and carbon mitigation potential of abandoned mines integrated with mine ecological restoration objectives; (3) assess the economic feasibility of PV construction in abandoned mines. These findings will support decision-makers in effectively harnessing the renewable energy potential of such sites and help achieve carbon neutrality.
METHODS
The methodology comprises three steps: First, distinct scenarios for PV power development on abandoned mines were designed, accounting for ecological restoration requirements, variations in land types, and mine development objectives. Subsequently, the potential PV power generation and bioenergy production under each scenario were quantified. Finally, the energy conservation potential, the corresponding carbon-emission reduction potential, and the cost-benefit analysis of different PV development scenarios were determined.
Scenario setting
Mining areas in China exhibit considerable spatial overlap with favorable solar irradiation conditions, as larger mining footprints tend to have higher solar energy potential[23]. When planning PV systems in these mining areas, we consider the geographical features of key latitude zones and topography in PV layout design, while incorporating adaptive designs tailored to different types of mining land[24]. The data on abandoned open-pit mines in China were obtained from publicly available sources [23,25], including three types of damaged mining land (i.e., excavated land, occupied land, and subsided land), ecological restoration land, and building rooftops. The scenario settings adopted in this study are as follows:
Scenario 1 adopts a strategy to maximize standalone PV development by prioritizing all available land for PV array installation to meet the mines’ clean electricity demand. The land used for PV layout comprises three types: damaged mining land, ecological restoration land, and building rooftops.
Scenario 2 employs a hybrid development strategy combining PV with ecological restoration. This approach aims to meet clean energy demand while supporting ecological restoration. To meet the mines’ clean energy demands and underscore the role of abandoned mine sites in building a renewable energy system, the vegetation selected for ecological restoration consists of energy crops. These plants provide biomass for clean energy. In this scenario, PV systems and energy crops are spatially separated with no overlap. Based on the land allocation scheme, ecological restoration land focuses solely on cultivating energy crops without PV layout, while building rooftops and damaged mining land are used for PV installation without vegetation. Cultivated energy crops are used for bioenergy production, including biopower, ethanol, and biodiesel.
Scenario 3 implements a “PV+” coupling model that emphasizes the coordinated development of PV deployment and ecological restoration. Ecological restoration is the primary goal, while PV deployment provides synergistic benefits. In this scenario, PV systems and energy crops coexist on the same land used for ecological restoration and on damaged mining land. To minimize impacts on plant growth, PV panels are installed with a minimum clearance of 2.5 meters above the ground, and a vertical clearance of 3.2 m at the panel center. The spaces beneath and around the panels are efficiently used to cultivate energy crops. Meanwhile, building rooftops are dedicated exclusively to PV deployment, with no vegetation cover. This dual-purpose approach promotes sustainable mine development.
Renewable production estimation
A 600 Wp monocrystalline silicon PV module with a service life of 25 years was selected and installed at a fixed tilt angle, considering module efficiency, technological maturity, and market share[24,26]. The specific module dimensions are 2,172 mm × 1,303 mm × 35 mm[26]. The PV array consists of 44 modules arranged in two vertical rows. The minimum spacing between the front and rear rows of the array is calculated using[24]:
as illustrated in Figure 1. Here, D represents the minimum spacing between the front and rear arrays of the PV module, L denotes the ground projection length of solar radiation, α is the solar altitude angle at 9:00 AM on the local winter solstice, φ represents the local latitude, β is the sun azimuth angle, which is 0° at 9:00 AM on the local winter solstice, δ is the sun declination, set at 3.5° for the winter solstice, and ω is the hour angle, which is 43.24° at 9:00 AM.
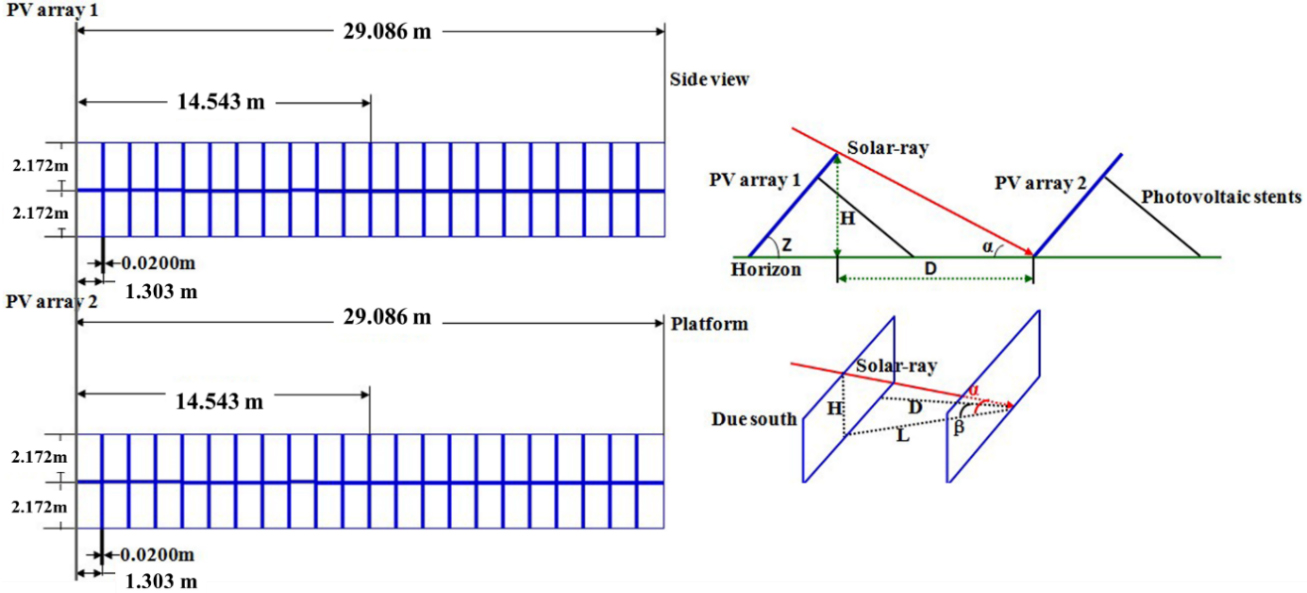
Figure 1. The diagram of the PV module array. PV: Photovoltaic.
PVsyst is a specialized simulation platform widely used in PV system design and performance analysis[27]. In this study, PVsyst is used to determine the optimal installation tilt angle of the PV modules, total solar irradiation, and peak sunshine hours. Subsequently, the minimum static distance between the front and rear rows of PV panels is calculated, as detailed in Supplementary Table 1.
The PV system’s output power is calculated using[24]:
where P is the annual power generation of the PV system, in kWh, W represents the installed capacity, in kWp, H denotes the annual effective operating hours, in h, η is the overall system efficiency coefficient, 0.82[24], ƍ is the module’s annual degradation rate, based on the manufacturer’s measured data: it is 2% in the first year, then stabilizes at 0.45% per year thereafter[24,26], N is the total number of PV panels, Ws is the capacity of a single polysilicon PV module, in kWp, A is the application area per plan, in m2, As is the required space per PV module with correction for open-pit mines, in m2, and Ns is the number of PV panels per module.
Bioenergy production on abandoned mine land is calculated using[28]:
where Mbioenergy-j,k is the amount of type k bioenergy production from type j energy crop, in t or kWh, Ai is the area of type i abandoned mine land, in ha, pi,j is the unit output of type j energy crop on type i abandoned mine land, in t ha-1, and fj,k is the conversion coefficient from type j energy crop to type k bioenergy, in t t-1 or kWh t-1.
Energy conservation and carbon mitigation estimation
The energy conservation potential from PV power generation is calculated using:
where Conp represents the energy conservation due to PV power generation, in MJ, P is the power generation of the PV power station, in kWh, r is the conversion coefficient of the calorific value of electricity,
The energy conservation through bioenergy generation is calculated using[31]:
where Conbioenergy-k is the energy conservation achieved by using type k bioenergy instead of traditional fossil fuels, in MJ, Mbioenrgy is the production of type k bioenergy, in kg, Hk is the calorific value of type k bioenergy, in MJ kg-1 or MJ kWh-1, Hf is the calorific value of traditional fossil fuel that can be replaced by type k bioenergy, in MJ kg-1 or MJ kWh-1, CLCA-f is the energy consumption during the life-cycle of traditional fossil fuel production that can be replaced by type k biomass energy, 11.27 MJ kWh-1 for coal-fired power[29],
The CO2 mitigation of PV power generation is calculated using:
where REGp represents the CO2 mitigation potentials of PV power, in t. P is the power generation of the PV power station, in kWh, ff denotes the CO2 emission coefficient for fossil fuel power production,
CO2 mitigation from bioenergy production throughout the life-cycle is calculated using:
where GRVk is the greenhouse gas (GHG) reduction value of type k bioenergy, in t, and fk is the carbon reduction coefficient of type k bioenergy, reported as 0.9288 × 10⁻³ t CO2 kWh-1 for biopower[34], 1.87 t CO2 t-1 for ethanol[35], and
Cost-benefit calculation
A life-cycle cost-benefit model was used to conduct a comprehensive economic assessment of PV power and bioenergy generation. The Levelized Cost of Electricity (LCOE) is a core indicator for evaluating the economic feasibility of PV projects, reflecting the average cost per unit of electricity generated over the project’s entire life-cycle. The economic model includes four primary cost categories: initial capital investment, operation and maintenance expenditures, financing costs, and other costs. Among these, the total initial investment costs include PV modules, auxiliary equipment, grid connection, installation, and other relevant components. Due to the substantial upfront investment, investors adopt a principal repayment scheme to service the bank loans for renewable energy projects, as given in[37]:
where CI is the initial investment cost of the PV system, CNY, CO&M,n is the annual operation and maintenance costs, CNY, COthers is the other annual related cost, including taxes, fees, and degradation related expenses, CNY, En is the electricity generation in the n-th year, in kWh, r is the discount rate, 5%, n is the operation period of the project, 25 years, WPV is the installed capacity of the PV system, CW is the unit initial investment cost, 2.77 CNY W-1[38], PO&M,n is the operation and maintenance cost per unit, 0.046 CNY W-1[38], CL,n is the annual loan interest payment, CNY, RLoan is the ratio of loans to initial investment, 30%, T is the loan repayment period, 15 years, l is the long-term loan interest rate, 3.5%[39], and ROthers is the ratio of other costs to initial investment, 10%[40].
Revenue is derived from the sale of electricity, ethanol, and biodiesel. Electricity revenue is calculated based on the policy principle of “self-consumption priority with surplus electricity fed into the grid”[41]. The prices of electricity, ethanol, and biodiesel are based on market data. The specific values are determined using:
where Ck is the total life-cycle cost of the type k of energy, CNY, and Cu,k is the unit cost of the type k of renewable energy, 0.3018 CNY kWh-1 for PV power (LCOE), 0.475 CNY kWh-1 for biopower[42],
For comparative analysis, the levelized cost per unit area (LCOA) and energy output per unit area (EOA) were defined for abandoned mine lands, which are expressed as:
where LCOA is the energy production cost per unit area, CNY km-2, Ck is the total life-cycle cost of the type k of energy, CNY, Ak is the land area occupied by raw materials for producing type k energy, in km2, EOA is the energy production per unit area, in PJ km-2, Ek is the k type of energy production, in t or kWh, and Hk is the calorific value of type k renewable energy, in MJ t-1 or MJ kWh-1.
Data collection
Data on abandoned open-pit mine lands across China were obtained from published remote sensing-based monitoring datasets and historical mine verification records[23,25]. The ecological reclamation plan involves three categories of energy crops: cellulose-, carbohydrates-, and oil-producing crops. Biomass productivity for these energy crops on reclaimed mine lands was estimated based on their yields from marginal lands, with a limiting correction factor of 0.8 applied to account for low soil fertility and potential heavy metal contamination at mine sites[24]. The spatial distribution of these energy crops, their unit yield on abandoned mine lands, and corresponding bioenergy conversion coefficients are presented in Supplementary Table 2. The data sources for other parameters are described in the section on parameter accounting formulas. All figures were created using Microsoft Excel 2021 and QGIS Desktop 3.44.0.
RESULTS
Potential renewable energy production on abandoned mines in China
Over the 25-year operational life-cycle of PV systems, annual PV power generation in abandoned open-pit mines in China shows a gradual decline [Figure 2]. Under Scenario 1, the designated PV deployment area of 9,136.48 km2 can accommodate 28.70 million polysilicon PV modules, with a total installed capacity of 757.71 GWp. Considering solar resource availability and various losses, the annual power generation is projected to decrease from 872.75 TWh yr-1 in the first year to 764.97 TWh yr-1 in the 25th year, with an average annual power output of 812.64 TWh yr-1 [Figure 2 and Table 1]. In Scenario 2, 12.91 million polysilicon PV modules are installed across 5,936.67 km2 of abandoned open-pit mine land, yielding an installed capacity of 340.82 GWp, with an estimated average annual power generation of 368.12 TWh yr-1 [Figure 2]. The remaining 3,199.81 km2 of land is allocated to the cultivation of energy crops for bioenergy production. The bioenergy potential varies substantially depending on conversion approaches and planting scale. Specifically, annual biomass yields are 3.75-18.17 Mt yr-1 for cellulose energy crops, 0.35-0.66 Mt yr-1 for oil energy crops, and 1.62-9.60 Mt yr-1 for carbohydrate energy crops. The corresponding bioenergy potential equals 3.75-18.17 TWh yr-1 of biopower from cellulose feedstocks, 0.35-0.66 Mt yr-1 of biodiesel from oil feedstocks, and 1.62-2.94 Mt yr-1 of ethanol from carbohydrate feedstocks [Table 1]. In Scenario 3,
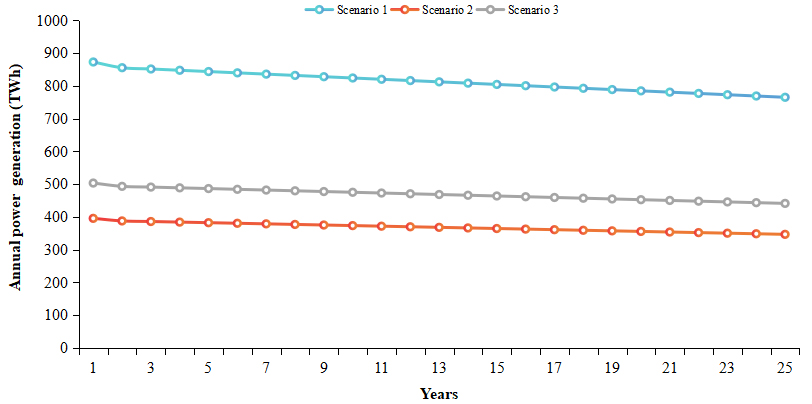
Figure 2. PV power generation in the abandoned open-pit mine land of China over a 25-year usage cycle. PV: Photovoltaic.
The annual renewable energy production and energy substitution potential in abandoned open-pit mine land of China across three scenarios
| Scenario | PV power generation (TWh yr-1) | Bioenergy potential | Substitution potential (EJ yr-1) | Energy consumption (EJ yr-1) | Energy conservation (EJ yr-1) | Carbon reduction (Mt yr-1) | |||
| Energy crops | Biopower (TWh yr-1) | Ethanol (Mt yr-1) | Biodiesel (Mt yr-1) | ||||||
| Scenario 1 | 812.64 | 2.93 | 1.47 | 10.61 | 613.79 | ||||
| Scenario 2 | 368.12 | Cellulose-based | 3.75-18.17 | 1.34-1.39 | 0.67-0.72 | 4.86-5.02 | 281.52-294.92 | ||
| Oil-based | 0.35-0.66 | 1.34-1.35 | 0.67-0.68 | 4.80-4.82 | 278.85-279.59 | ||||
| Carbohydrate-based | 1.62-2.94 | 1.37-1.40 | 0.69-0.71 | 4.90-4.98 | 281.07-283.54 | ||||
| Scenario 3 | 468.49 | Cellulose-based | 8.51-41.23 | 1.72-1.83 | 0.87-0.97 | 6.23-6.61 | 361.75-392.14 | ||
| Oil-based | 1.72-1.75 | 0.86-0.87 | 6.14-6.15 | 355.68-357.36 | |||||
| Carbohydrate-based | 3.67-6.68 | 0.78-1.50 | 1.78-1.87 | 0.90-0.94 | 6.34-6.51 | 360.72-366.34 | |||
Energy substitution potential
The overall renewable energy production potential across the three scenarios varies with research objectives and design configurations, ranging from 1.34 EJ yr-1 to 2.93 EJ yr-1, following the order: Scenario 1 > Scenario 3 > Scenario 2. Under the established modeling framework, PV power accounts for more than 94% of the total renewable energy potential.
In Scenario 1, PV power could offset approximately 2.93 EJ yr-1 of coal-fired power. Throughout the full life-cycle, PV systems require an annual energy input of
Carbon mitigation potential
The total carbon mitigation potential from substituting conventional fossil fuels varies substantially across scenarios, ranging from 283.25 Mt CO2 to 613.79 Mt CO2 [Table 1]. Specifically, Scenario 1 shows the highest mitigation potential at 613.79 Mt CO2, driven primarily by large-scale PV deployment displacing coal-fired power, resulting in an annual carbon reduction of 755.30 kg CO2 per MWh. Scenario 3 lies in the intermediate range, with carbon reductions between 355.68 and 392.14 Mt CO2, where PV power accounts for over 94% of the total mitigation. Scenario 2 shows the lowest carbon reduction potential, ranging from 278.85 to 294.92 Mt CO2. Within Scenarios 2 and 3, carbon reductions vary by bioenergy pathway, ranging from 10.18 Mt to 23.10 Mt CO2 for biopower, 1.18 Mt to 2.68 Mt CO2 for biodiesel, and 4.27 Mt to 9.68 Mt CO2 for ethanol. From a per-unit-area perspective, PV power delivers far greater carbon mitigation potential (611.63 t CO2 ha-1) compared with bioenergy alternatives such as biopower (102.96 t CO2 ha-1), ethanol
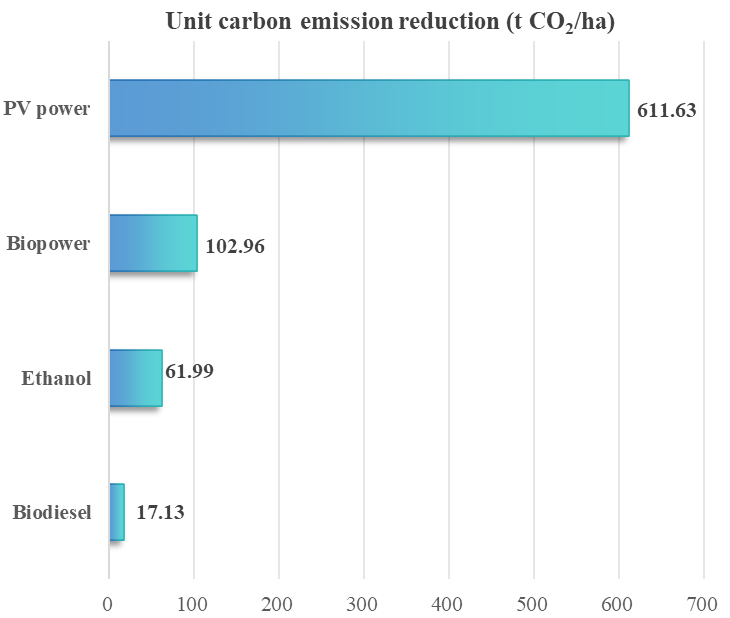
Figure 3. Renewable energy carbon emission reduction per unit area.
Provincial characteristics of renewable energy production effects
Regional potential for renewable energy production on abandoned open-pit mines varies substantially across provinces. In Scenario 1, Inner Mongolia ranks highest, with 369.14 PJ of PV power generation, followed by Xinjiang (210.49 PJ), Shandong (209.88 PJ), and Hebei (200.69 PJ). In contrast, the municipalities of Shanghai and Beijing exhibit the lowest output, accounting for only 0.6%-3.7% of Inner Mongolia’s generation. Scenario 2 shows a similar regional pattern, with Inner Mongolia leading at 217.35 PJ, followed by Xinjiang (104.37 PJ), Guangxi (93.80 PJ), and Shandong (74.44 PJ). This consistent trend underscores the dominant influence of PV power generation on regional renewable energy potential. Scenario 3 adopts an integrated “PV+” coupling model, which further reinforces Inner Mongolia’s leading position (245.24 PJ), followed by Xinjiang (133.00 PJ), Guangxi (97.81 PJ), and Yunnan (95.81 PJ) [Figure 4]. This scenario demonstrates that integrating energy crops can significantly enhance renewable energy potential in key regions.
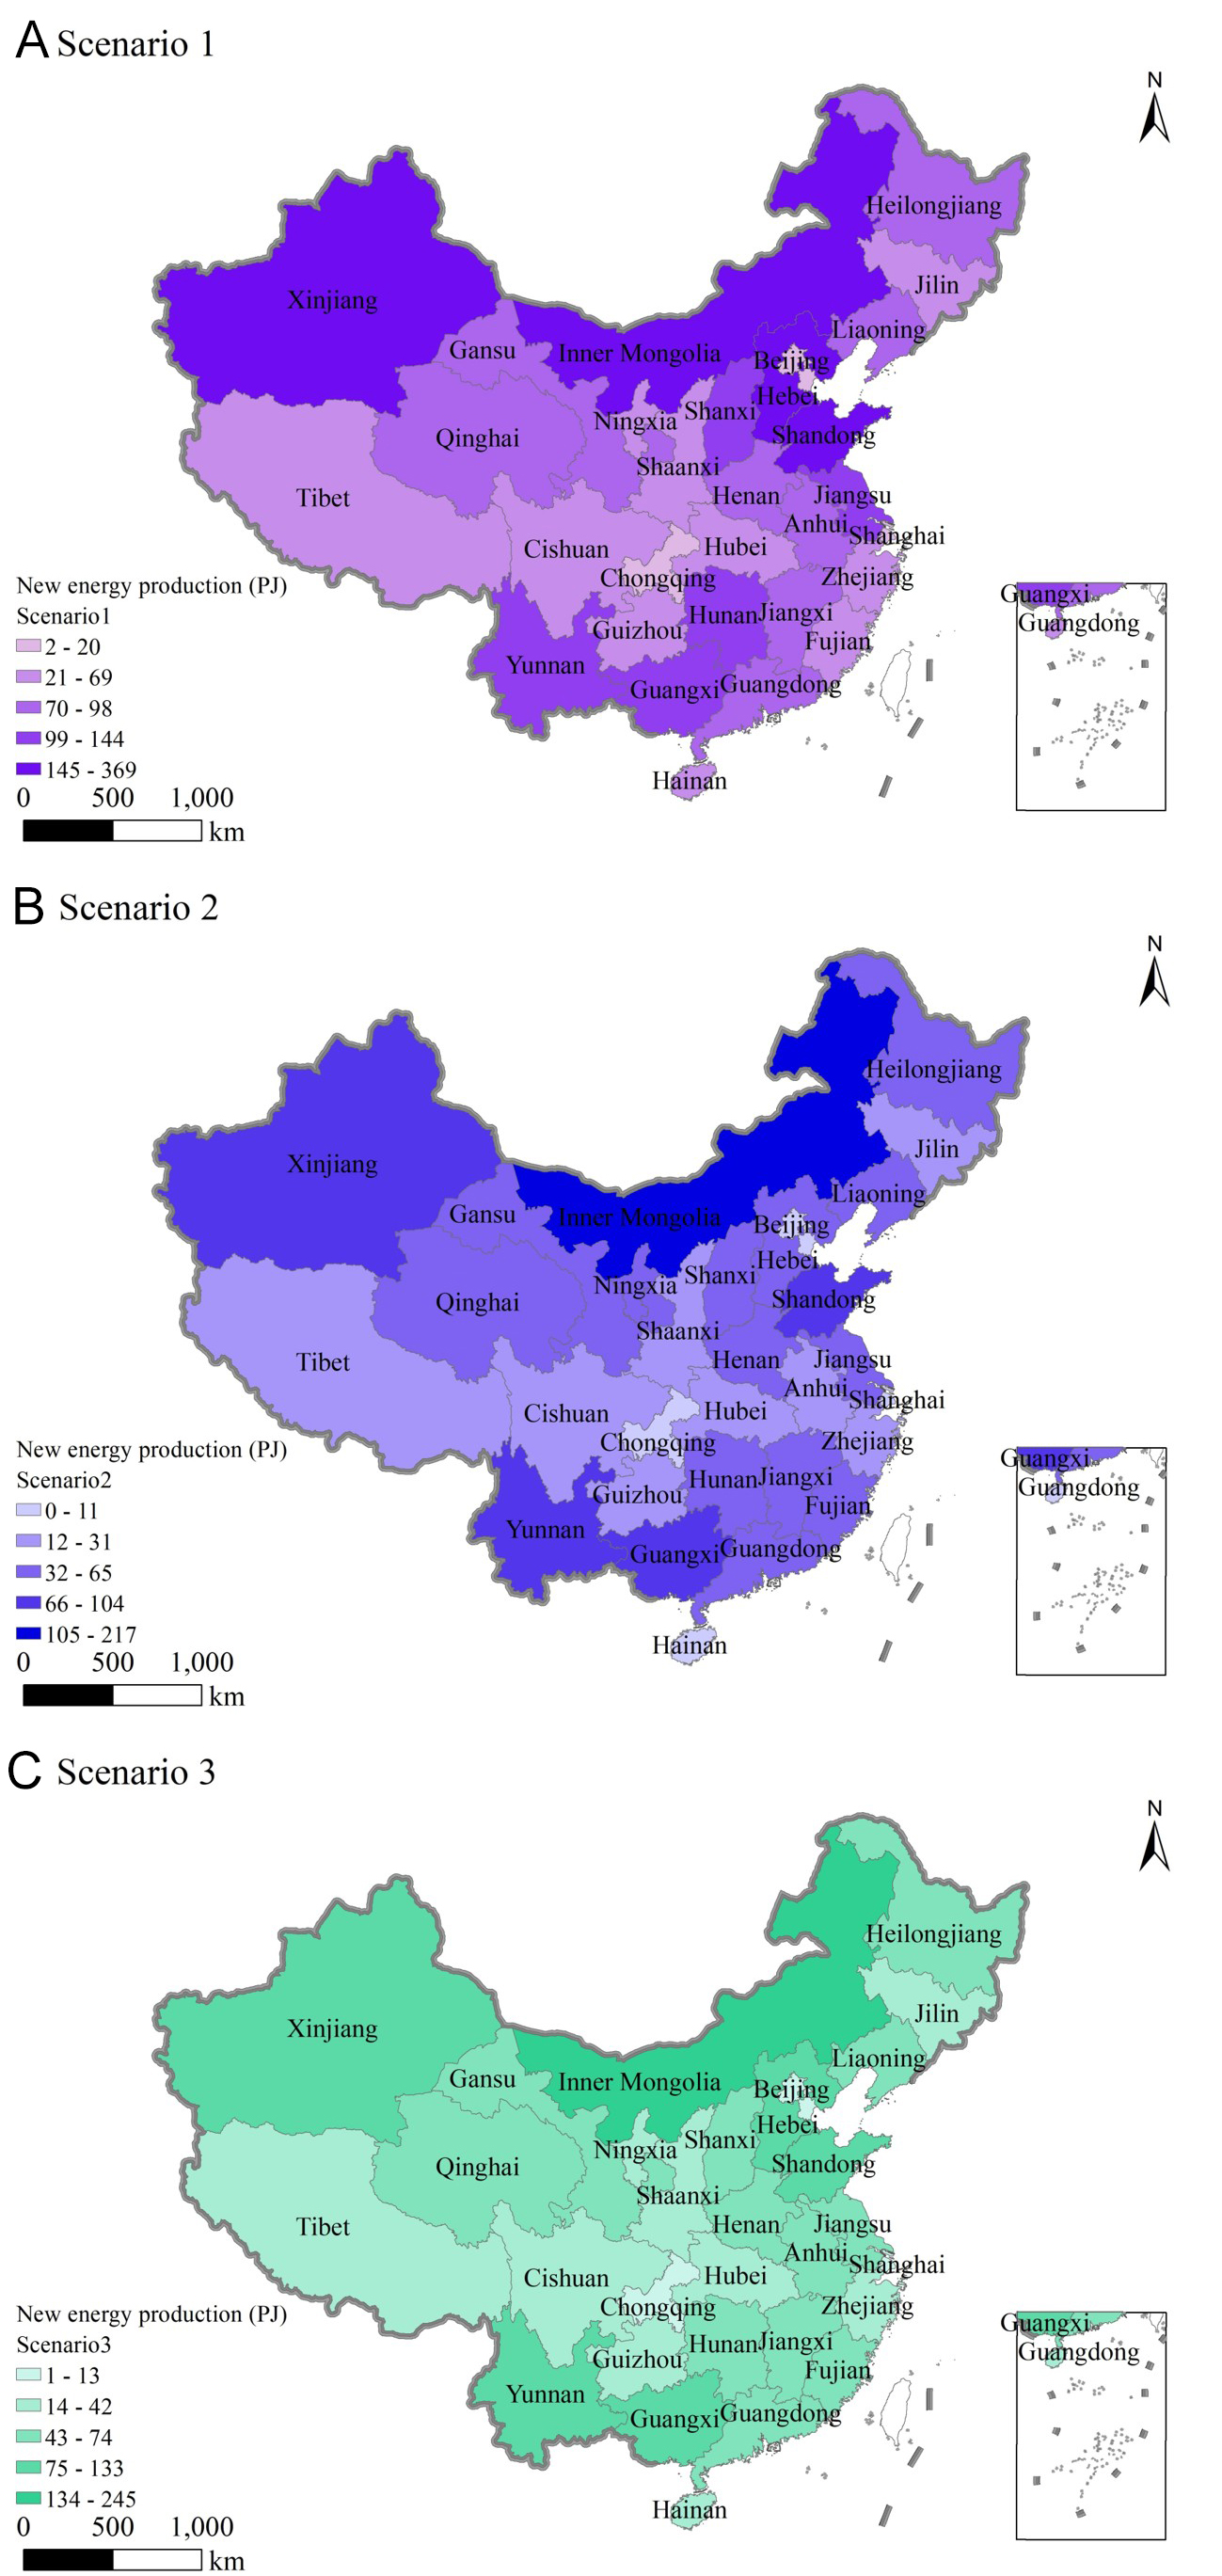
Figure 4. Provincial characteristics of renewable energy development potential in abandoned open-pit mines in China. The base map was sourced from the Ministry of Natural Resources of the People’s Republic of China (http://bzdt.ch.mnr.gov.cn/) with Map Approval No. GS(2023)2767. The base map was used without modification.
This study reveals that the potential for PV power generation varies across provinces, influenced by the distribution and characteristics of abandoned mine lands [Figure 5]. In Scenario 1, Inner Mongolia, Xinjiang, Shandong, and Hebei have the highest PV power generation potential due to their extensive areas of abandoned open-pit mines. When focusing exclusively on damaged mining land, Guangxi emerges as the leading region for PV potential under Scenario 2. With the inclusion of ecological restoration land, Yunnan’s PV power potential is further enhanced. Across all scenarios, Inner Mongolia, Xinjiang, Shandong, Guangxi, Hebei, and Yunnan consistently demonstrate strong potential for renewable energy production, energy conservation, and carbon emission reduction. Therefore, these provinces with abundant abandoned mines should be prioritized for integrated ecological restoration and renewable energy development. Such an approach would not only support provincial and national carbon-neutrality and emissions-reduction targets but also serve as a benchmark for sustainable development in the mining sector.
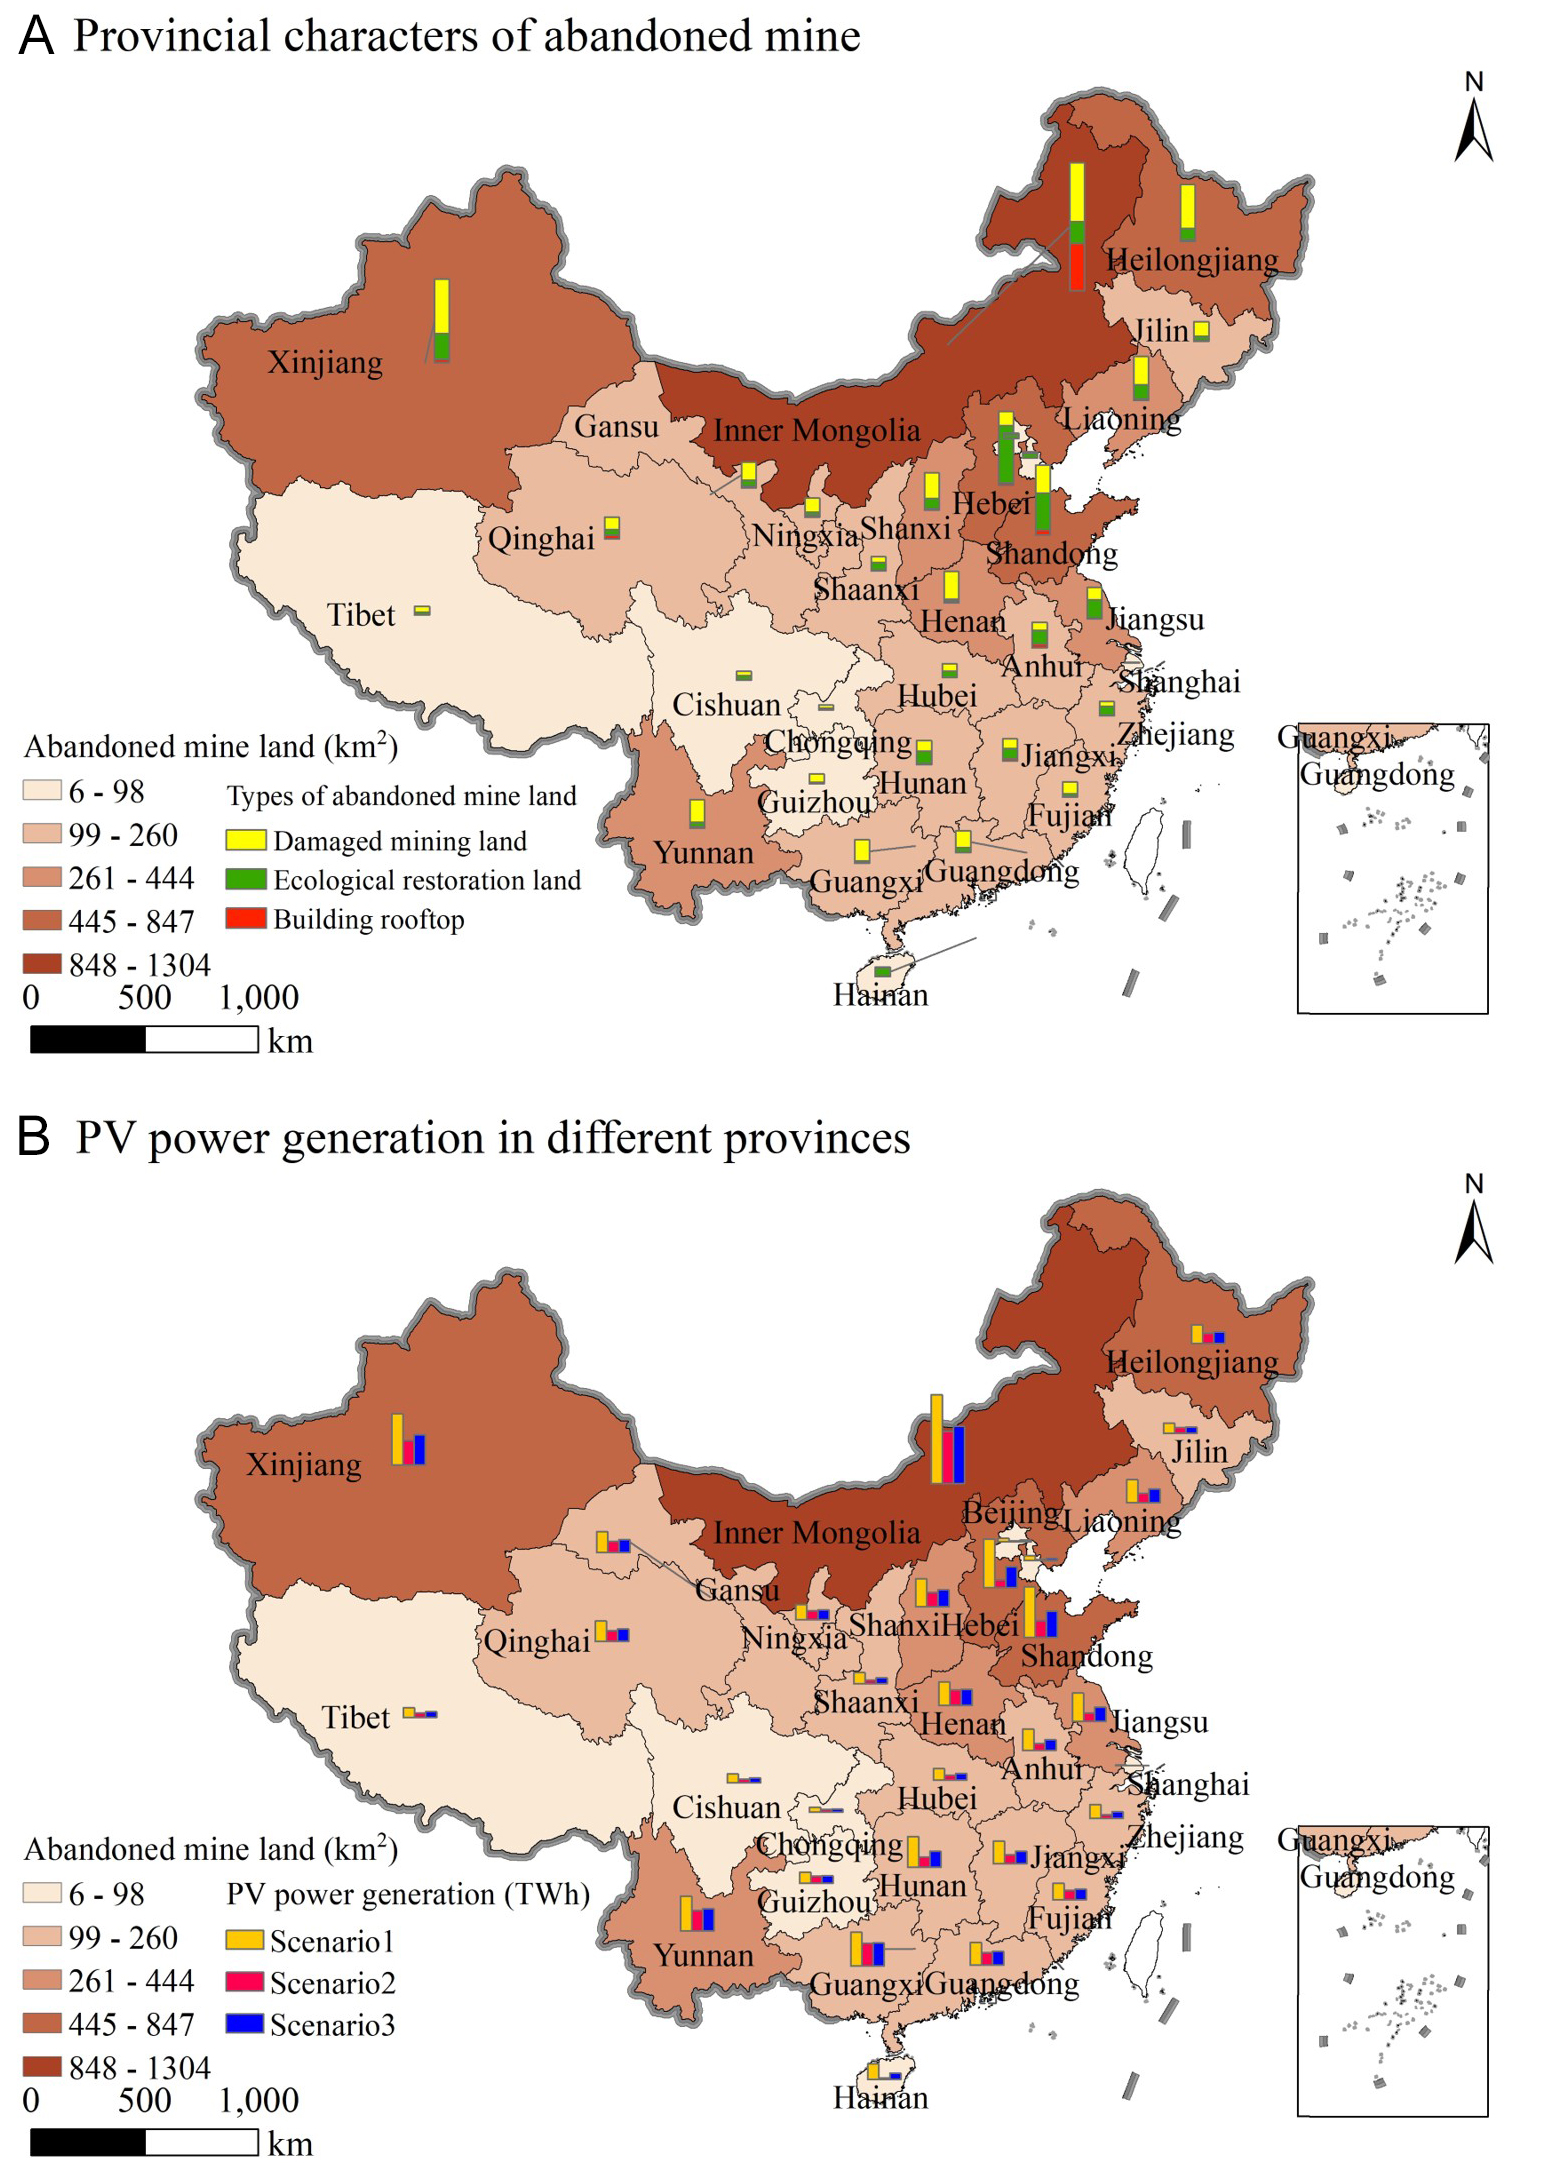
Figure 5. PV power generation and abandoned open-pit mines in different provinces. The base map was sourced from the Ministry of Natural Resources of the People’s Republic of China (http://bzdt.ch.mnr.gov.cn/) with Map Approval No. GS(2023)2767. The base map was used without modification. PV: Photovoltaic.
Renewable energy development, particularly through PV power generation and bioenergy production on abandoned mine lands, displays varying energy conservation potential across provinces. Provinces with higher renewable energy generation also show the greatest energy conservation potential. Specifically, Inner Mongolia and Xinjiang exhibit the greatest potential, saving 1,339.02 PJ and 763.54 PJ under Scenario 1. These values are approximately 1.7 and 2.0 times higher than those under Scenarios 2 (784.87 PJ and
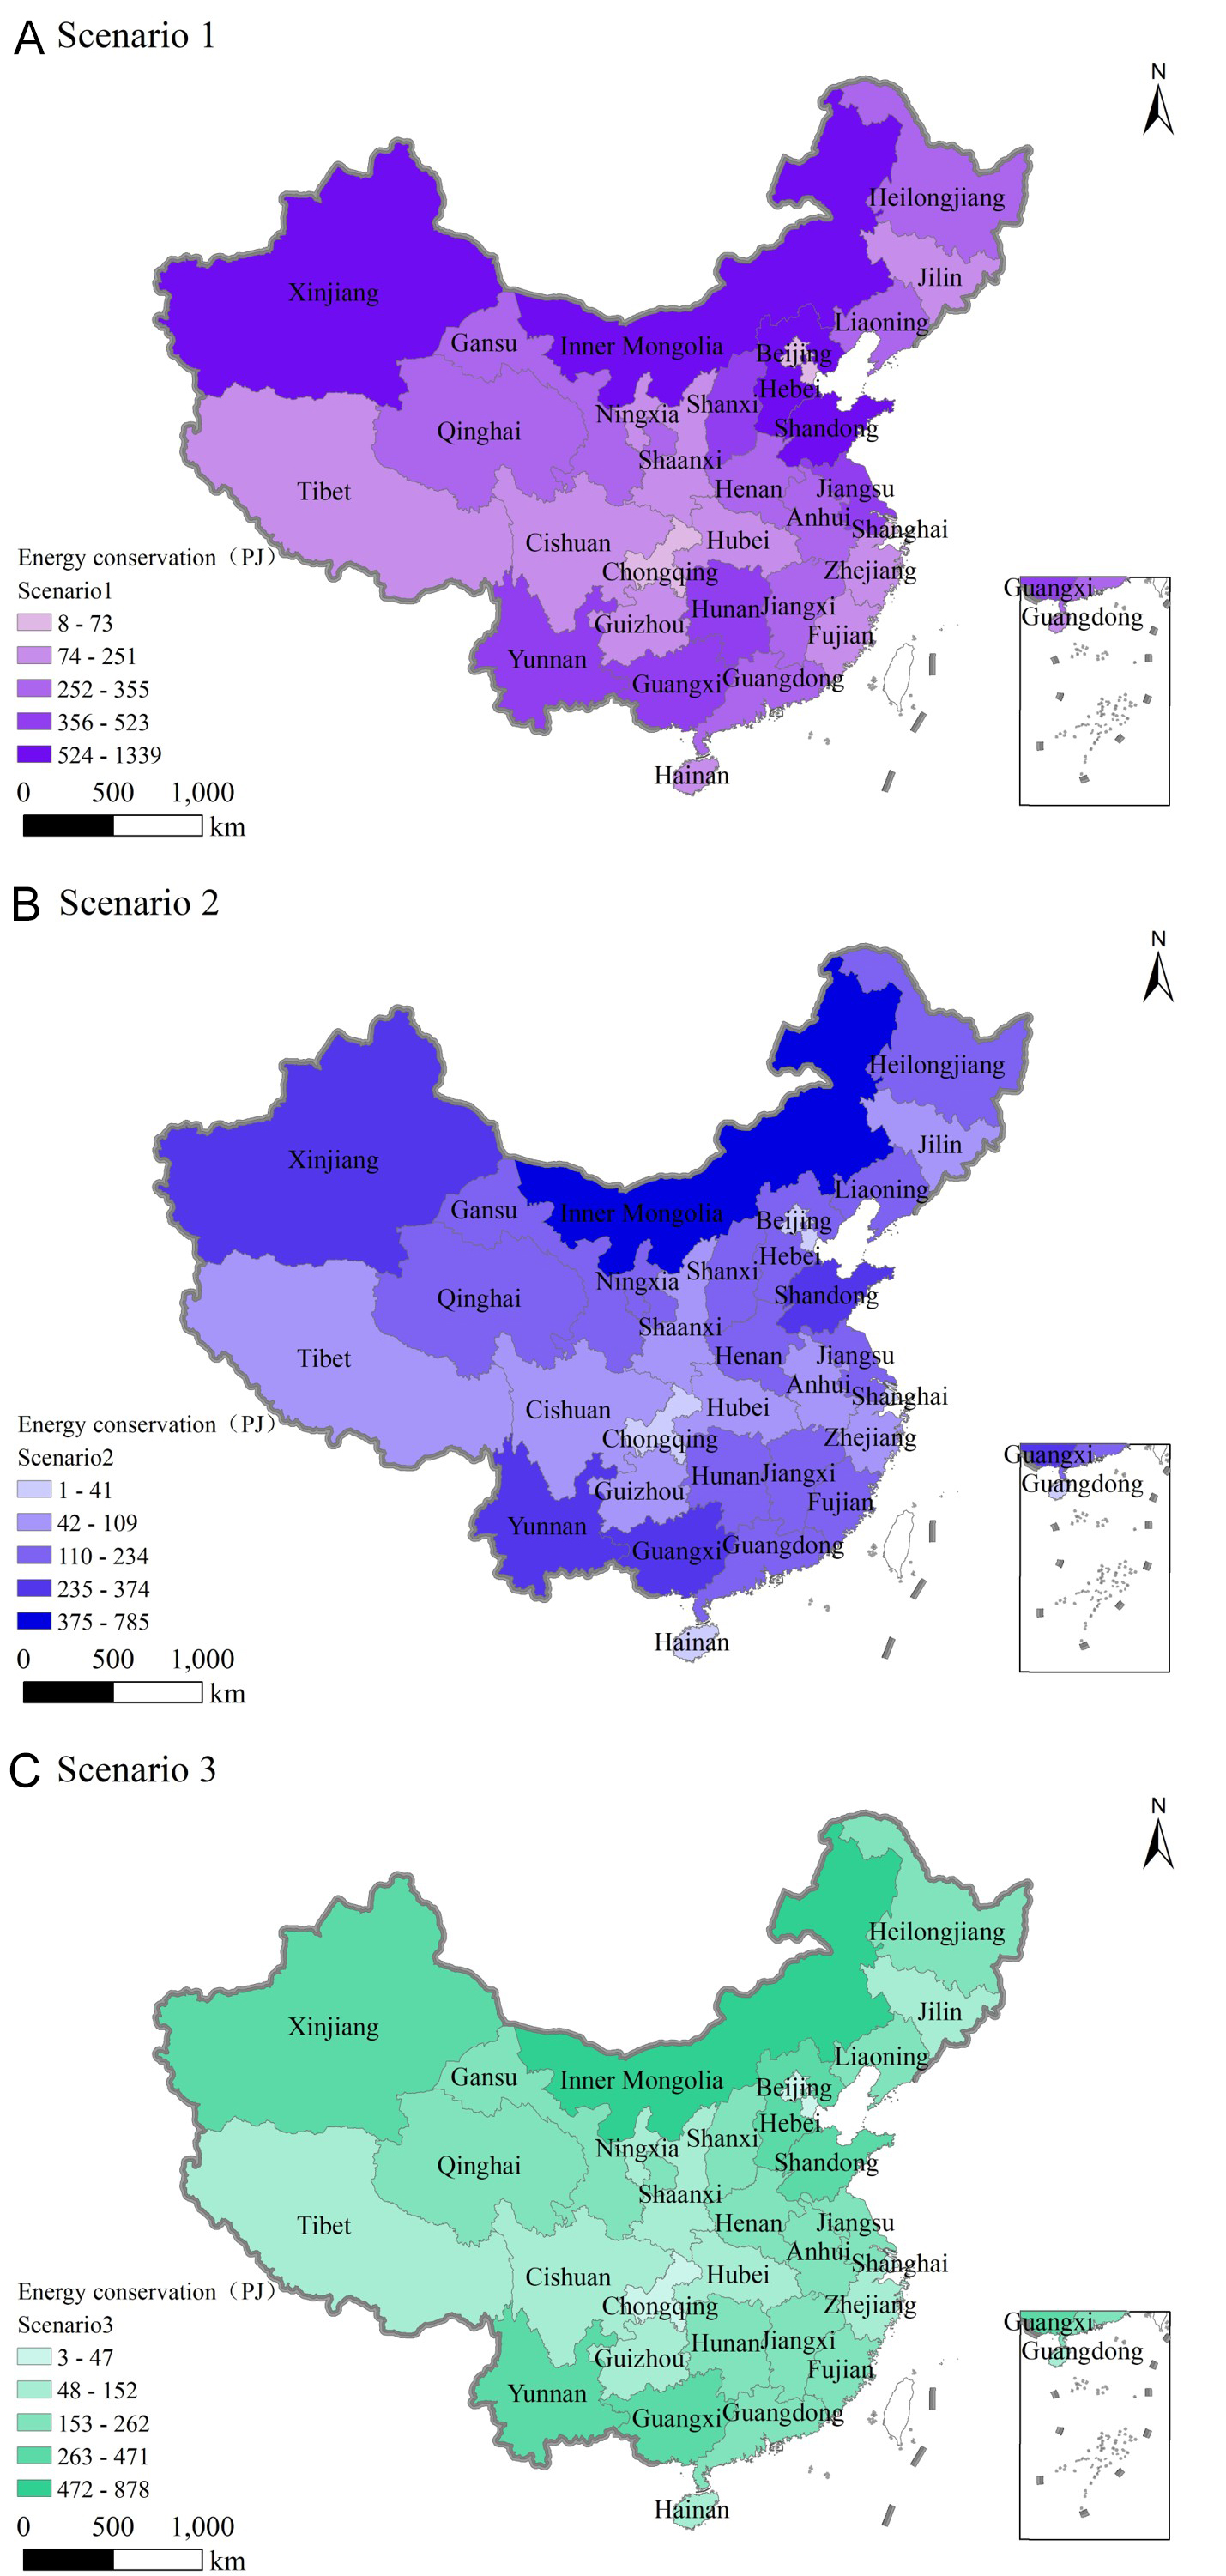
Figure 6. Provincial characteristics of energy conservation and renewable energy development on abandoned open-pit mines of China. The base map was sourced from the Ministry of Natural Resources of the People’s Republic of China (http://bzdt.ch.mnr.gov.cn/) with Map Approval No. GS(2023)2767. The base map was used without modification.
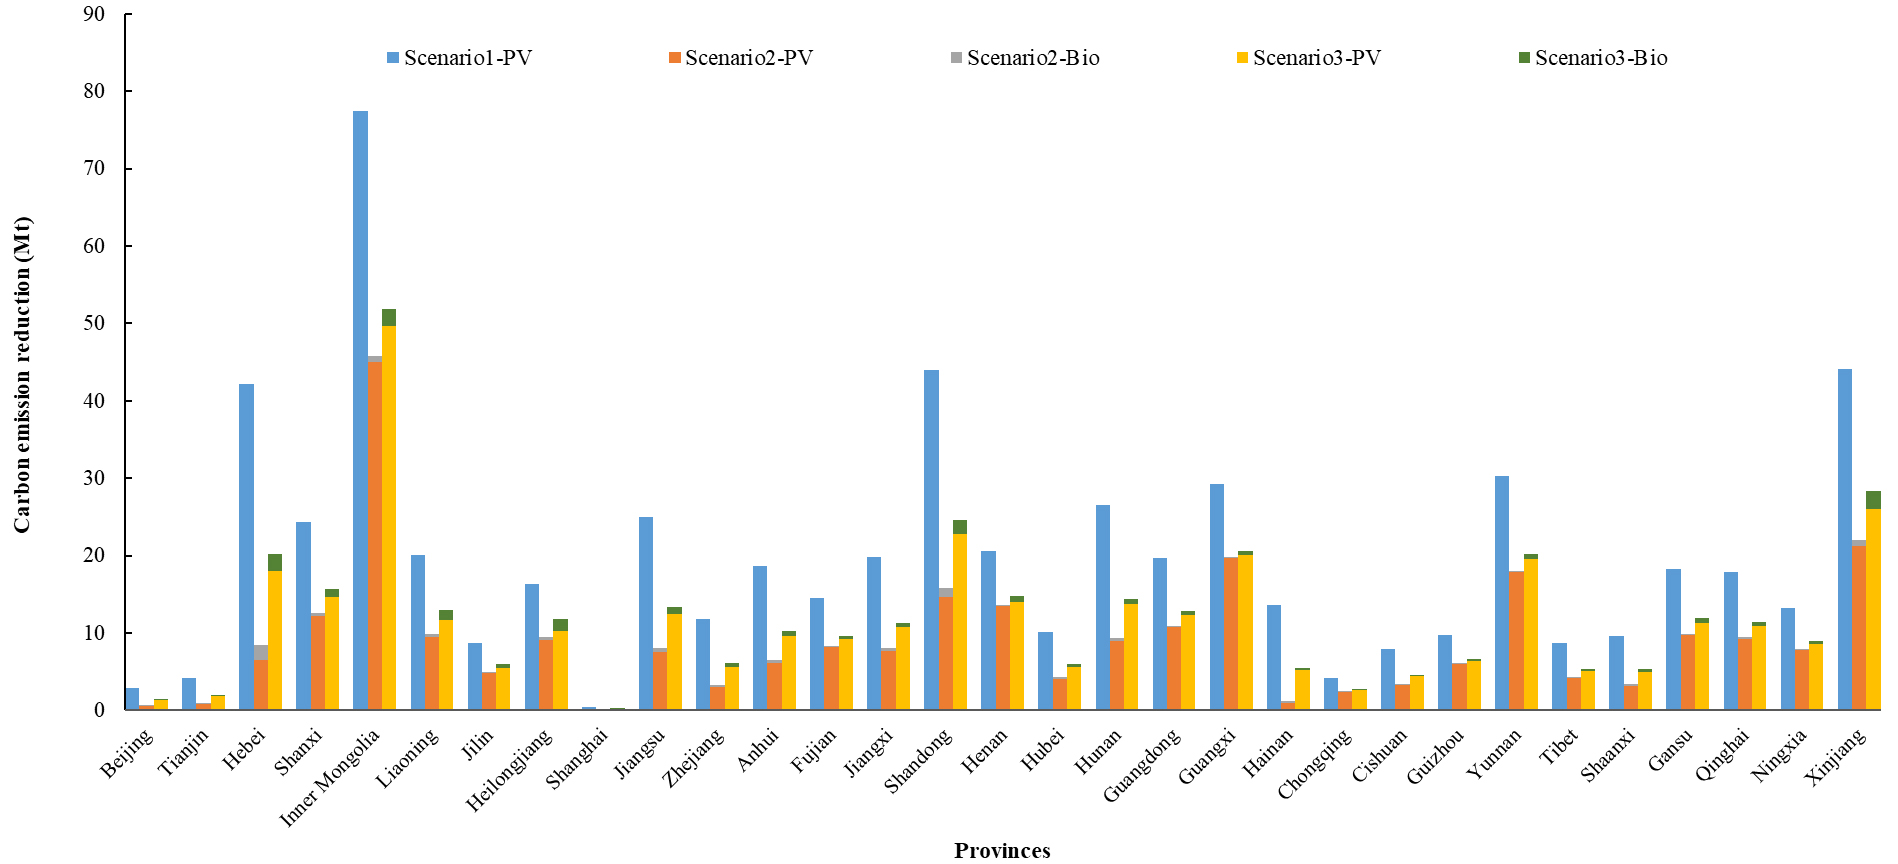
Figure 7. Provincial variations in carbon emission reduction from renewable energy development on abandoned open-pit mines of China.
Economic feasibility analysis of PV deployment
In terms of cost per unit area [Table 2], the order from highest to lowest is Scenario 1 > Scenario 3 > Scenario 2. This pattern is attributed to the longer operational life-cycle of PV systems, which results in higher maintenance and operating costs. However, energy output per unit area follows the same trend, indicating that despite the higher costs, PV systems deliver substantially greater energy generation. Consequently, Scenarios 1 and 3 achieve higher energy returns than Scenario 2 despite their greater costs. From a benefit-cost ratio perspective, Scenario 1 is the most efficient configuration, whereas Scenario 2 is the least economically viable. Biomass energy systems are typically constrained by land requirements and crop growth cycles. In addition, multi-stage conversion processes introduce efficiency losses, resulting in lower stability and lower efficiency for continuous energy supply compared with PV systems as well as weaker economic performance. In contrast, the “PV+” coupling model optimizes land use by reducing revegetation costs while simultaneously providing ecological and power generation benefits. These results demonstrate that the proposed “PV+” scenarios not only align with national energy and ecological restoration strategies but also are economically feasible.
The cost and benefit across three scenarios
| Scenario | Energy type | LCOA, million CNY km-2 | EOA, TJ km-2 | Benefit-cost ratio | |
| Biomass | Scenario | ||||
| Scenario 1 | PV Power | 26.84 | 320.20 | 1.49 | |
| Scenario 2 | Biopower | 5.94 | 14.18 | 144.32 | 1.33 |
| Ethanol | 11.09 | 15.98 | 151.01 | 1.23 | |
| Biodiesel | 5.30 | 13.96 | 146.36 | 1.33 | |
| Scenario 3 | PV power + biopower | 8.01 | 18.28 | 194.40 | 1.36 |
| PV power + ethanol | 19.23 | 22.21 | 199.77 | 1.21 | |
| PV power + biodiesel | 6.20 | 17.65 | 189.23 | 1.37 | |
DISCUSSION
The potential for renewable energy development on China’s abandoned open-pit mines is substantial, ranging from 1.34 EJ yr-1 to 2.93 EJ yr-1, equivalent to 45.75-99.95 million tonnes of coal equivalent (Mtce). This accounts for 0.9%-1.9% of China’s total primary energy production (5,130 Mtce), 5.9%-12.8% of its coal-fired power generation (778 Mtce), and 8.8%-19.1% of its nuclear, hydropower, wind, and solar power generation (522 Mtce) in 2020[50]. The associated carbon reductions, totaling 278.85-613.79 Mt CO2, could offset 2.8%-6.2% of China’s total carbon emissions (9,899.3 Mt CO2) in 2020. This contribution is significant for China’s carbon targets. It may account for 2.0%-4.4% of emissions under a no-constraint scenario by 2040 (13,860 Mt CO2), and 3.2%-7.1% under the stringent 2 °C scenario for achieving carbon neutrality by 2060 (8,600 Mt CO2)[51]. If China fully implements its carbon-reduction commitments[52], renewable energy development on these abandoned open-pit mines could contribute 3%-7% toward the national target. Moreover, the renewable energy output and corresponding carbon reduction are comparable to the extractive industry’s energy consumption (78.50 Mtce) and carbon emissions (759 Mt CO2) in 2020[53]. These findings highlight the substantial potential of repurposing abandoned open-pit mines for renewable energy development. This approach can help alleviate pressure on energy consumption and carbon-emission targets in the mining sector under China’s dual-carbon policy framework.
The potential for renewable energy development on China’s abandoned open-pit mines is significant, offering multiple benefits across different scenarios. When focusing solely on PV power generation, Scenario 1 is the optimal option. When ecological restoration is also considered, Scenarios 2 and 3 become preferable. Notably, Scenario 3 achieves higher production capacity and greater emission-reduction benefits than Scenarios 2 through the “PV+” coupling model. Although Scenarios 2 and 3 yield lower energy output than Scenario 1, they provide additional advantages, including vegetation restoration and ecological improvement, reflecting the environmental responsibilities of the mining sector. Currently, China provides strong policy support for ecological restoration and the development of PV infrastructure. Integrating PV development with ecological restoration on abandoned mines offers a viable solution to persistent challenges, including high costs and limited investment incentives. The plant species selected for ecological restoration should exhibit strong adaptability, rapid growth, and low cultivation costs, while also improving soil stability and facilitating land reclamation. This integrated strategy delivers dual benefits in ecological restoration and clean energy generation and provides innovative pathways for restoring mining ecosystems and optimizing the clean energy mix. By adopting this approach, the mining industry could significantly reduce electricity expenditures. Green electricity generated from abandoned open-pit mines for self-consumption could save approximately 164.86-365.77 billion CNY. Repurposing abandoned mines by integrating ecological restoration and renewable energy development is, therefore, a crucial strategy for promoting sustainable development in the mining industry.
PV power generation depends on weather conditions, making it an inherently intermittent energy source. Compared with PV development on conventional flat land, projects in mining areas face additional challenges, including complex land-use regulations, rugged terrain, higher equipment maintenance costs, and more complex grid integration[54]. To enhance PV deployment systems in abandoned mines, establishing integrated multi-energy power systems represents a practical solution[55]. For instance, deploying modular energy storage systems can help ensure an uninterrupted power supply, while integrating intelligent microgrids can optimize energy distribution[56,57]. A growing number of renewable energy pilot projects are currently being developed to explore new PV integration models and transform mining lands into clean energy hubs. In recent years, the Chinese government has consistently promoted the efficient deployment and utilization of PV systems in mining areas. In 2015, the government approved the establishment of a national advanced PV demonstration base in the coal-mining subsidence area of Datong, Shanxi province, promoting integrated land use and PV technology demonstration. In 2016, policies encouraged the use of abandoned coal mine sites and surrounding areas for wind and PV power development. In 2021, the “14th Five-Year Plan” for renewable energy development explicitly prioritized the construction of PV power stations on industrially abandoned land. In the same year, the “PV+” model was promoted, with regions such as Baotou and Ordos utilizing subsidence areas, open-pit mine dumps, and closed mining sites for large-scale new-energy development. By 2023, the government further encouraged PV projects on unused land and existing construction sites and clarified land approval procedures for mine-based PV projects. By 2025, the goal was to maximize the utilization of subsidence areas, industrial sites, dump sites, and reclaimed land. This effort aimed to accelerate PV deployment, expand “PV+” applications, promote coordinated land use, and generate integrated economic, social, and ecological benefits[58]. Policies promoting direct green electricity connections have also significantly accelerated the adoption of renewable electricity sources, including PV.
Although PV is currently one of the most cost-effective electricity sources[15], its deployment on abandoned mine lands often involves higher costs due to challenging terrain, geotechnical uncertainties, and remediation requirements. As a result, such projects may be less cost-competitive than conventional fossil fuel-based alternatives[59]. However, renewable energy remains a critical pathway to achieving carbon neutrality. Technological advancements, coupled with strong government support, are expected to reduce the costs of renewable energy development further. For instance, the cost of PV power generation has already declined by 90% over the past decade[60]. Additionally, carbon costs are expected to rise significantly due to increasing pressure to achieve carbon neutrality, the expansion of emissions trading schemes, and international policies such as the European Union (EU) Carbon Border Adjustment Mechanism (CBAM)[61]. These factors, combined with the potential for emissions reductions, operational flexibility, and continued cost declines driven by technological progress, are expected to enhance the competitiveness of renewable energy relative to fossil fuels. Therefore, renewable energy development on abandoned mines holds strong potential not only to meet the mining industry’s energy demands but also to support broader societal energy needs in China[10].
The current study provides a provincial-level dataset corresponding to the typical administrative unit for renewable energy policy and target setting. However, intra-provincial spatial heterogeneity in terrain, land suitability, and grid infrastructure is not explicitly captured. Future studies incorporating high-resolution spatial data could refine sub-provincial estimates[62]. To better understand the environmental benefits of PV systems, detailed cost assessments are also needed to evaluate their abatement potential[63]. The time-of-use value of PV generation, local demand conditions, and external grid connection costs should be incorporated into future research to provide a more nuanced assessment of project-level viability. The time-of-use value is particularly relevant in regions with peak pricing structures, as it can significantly affect revenue streams[64]. Local demand conditions determine the curtailment risk in areas with limited electricity demand. External grid connection costs, which can be substantial for remote mine sites, represent a critical factor often overlooked in national-scale analyses[65]. Site-specific data on these factors would enable a more comprehensive evaluation of economic feasibility. Key input parameters, such as solar radiation, module efficiency, biomass yield, bioenergy conversion efficiency, and assumptions regarding fossil fuel substitution, are subject to considerable uncertainty. These uncertainties arise from geographical conditions, technological advancements, and market dynamics. Future research should incorporate comprehensive sensitivity analyses to evaluate their impacts across different development models. Such analyses would enhance the robustness and generalizability of the findings[66]. A linear 25-year performance model was employed, consistent with standard practice for regional-scale PV assessments. However, actual long-term performance is influenced by nonlinear degradation, operation and maintenance practices, and technological learning effects that are not captured in the current framework. Future research should incorporate these dynamic elements to improve long-term production estimates. Broader integration of PV systems with other clean energy sources, energy storage facilities, and ecological restoration is essential for maximizing solar resource utilization. In addition, future studies should evaluate different PV system configurations.
CONCLUSIONS
This study evaluates the potential for renewable energy development on abandoned open-pit mines in China. Renewable energy production is estimated to range from 1.34 EJ to 2.93 EJ, with PV power contributing over 94% of the total potential. Analysis of three different development scenarios indicates that China could reduce carbon emissions by 278.85 Mt to 613.79 Mt CO2 through renewable energy developments at these sites. The carbon mitigation potential of PV power far exceeds that of bioenergy alternatives such as biopower, biodiesel, and ethanol. Notably, Inner Mongolia, Xinjiang, Shandong, Hebei, Guangxi, and Yunnan exhibit substantial carbon mitigation potential, collectively accounting for approximately 44%-45% of the total. Repurposing abandoned mines through integrated ecological restoration and renewable energy development represents a sustainable strategy for addressing both land requirements for PV expansion and mine reclamation needs. Overall, the substantial potential for renewable energy development and carbon emission reduction on abandoned open-pit mines in China could significantly promote the sustainable transformation of the mining industry. Such development is also economically viable.
DECLARATIONS
Authors’ contributions
Writing - original draft, review and editing, analyses, conceptualization, supervision: Wang, J.
Writing - original draft, review and editing, analyses, data curation: Wang, Z.
Methodology, formal analysis, software, data curation: Quan, S.; Zhong, R.
Investigation, resources: Bing, L.; Hu, Q.; Xu, T.; Zhao, N.
Investigation, resources, data curation: Ling, H.
Conceptualization, supervision: Xi, F.
Availability of data and materials
Data and Supplementary Materials in this study are available from the corresponding author upon reasonable request.
AI and AI-assisted tools statement
Not applicable.
Financial support and sponsorship
This work was supported by the Key Research and Development Project of Liaoning Province (2025JH2/101330021), Major Program of the Institute of Applied Ecology, Chinese Academy of Sciences (IAEMP202201), and Joint Foundation Project of Liaoning Province (2023-MSBA-141).
Conflicts of interest
All authors declared that there are no conflicts of interest.
Ethical approval and consent to participate
Not applicable.
Consent for publication
Not applicable.
Copyright
© The Author(s) 2026.
Supplementary Materials
REFERENCES
1. Wenten, I. G.; Khoiruddin, K.; Siagian, U. W. R. Green energy technologies: a key driver in carbon emission reduction. J. Eng. Technol. Sci. 2024, 56, 143-92.
2. Bakhiyi, B.; Labrèche, F.; Zayed, J. The photovoltaic industry on the path to a sustainable future - Environmental and occupational health issues. Environ. Int. 2014, 73, 224-34.
3. He, G.; Lin, J.; Sifuentes, F.; Liu, X.; Abhyankar, N.; Phadke, A. Rapid cost decrease of renewables and storage accelerates the decarbonization of China’s power system. Nat. Commun. 2020, 11, 2486.
4. IRENA. Future of Solar Photovoltaic. Abu Dhabi, United Arab Emirates, 2019. https://www.irena.org/-/media/Files/IRENA/Agency/Publication/2019/Nov/IRENA_Future_of_Solar_PV_summary_2019.pdf (accessed 2026-05-14).
5. The State Council of the People’s Republic of China. Renewable energy accounts for 56 pct of China’s total installed capacity. 2025. https://english.www.gov.cn/archive/statistics/202501/28/content_WS6798de96c6d0868f4e8ef410.html (accessed 2026-05-14).
6. International Energy Agency Photovoltaic Power Systems Programme. Snapshot of Global PV Markets 2025. 2025. https://iea-pvps.org/snapshot-reports/snapshot-2025/ (accessed 2026-05-14).
7. Jäger-waldau, A. Snapshot of photovoltaics - March 2025. EPJ. Photovolt. 2025, 16, 22. https://www.epj-pv.org/articles/epjpv/abs/2025/01/pv20250008/pv20250008.html (accessed 2026-05-14).
8. He, T.; Chen, Y.; Zhao, Y.; Li, F.; Xu, N.; Ren, H. Harnessing the solar photovoltaic potential in global mining areas: Energy locations for the future. Innovation 2025, 6, 100987.
9. Maus, V.; Giljum, S.; Da Silva, D. M.; et al. An update on global mining land use. Sci. Data. 2022, 9, 433.
10. Lin, G.; Zhao, Y.; Fu, J.; Jiang, D. Renewable energy in China’s abandoned mines. Science 2023, 380, 699-700.
11. Bertrand, S.; Pelliccio, C. Spurring clean energy development on reclaimed mine lands. 2022. https://www.eesi.org/articles/view/spurring-clean-energy-development-on-reclaimed-mine-lands(accessed. 2026-05-14).
12. List Solar. Largest solar power parks in Germany. 2024. https://list.solar/plants/largest-plants/solar-plants-germany (accessed 2026-05-14).
13. Choi, Y.; Song, J. Sustainable development of abandoned mine areas using renewable energy systems: a case study of the photovoltaic potential assessment at the tailings dam of abandoned sangdong mine, Korea. Sustainability 2016, 8, 1320.
14. Pouran, H. M. From collapsed coal mines to floating solar farms, why China’s new power stations matter. Energy. Policy. 2018, 123, 414-20.
15. Wu, C. C.; Driskell-Tate, R.; Deres, H. Bright side of the mine. Global Energy Monitor. 2025. https://globalenergymonitor.org/research/bright-side-mine (accessed 2026-05-19).
16. Harris, T. M.; Zaimes, G. G.; Khanna, V.; Landis, A. E. Sunflower cultivation on Coal Mine refuse piles in Appalachia for diesel biofuel production from a life-cycle perspective. Procedia. Eng. 2015, 118, 869-78.
17. Ussiri, D. A.; Guzman, J. G.; Lal, R.; Somireddy, U. Bioenergy crop production on reclaimed mine land in the North Appalachian region, USA. Biomass. Bioenergy. 2019, 125, 188-95.
18. Shen, S.; Chen, J.; Chang, J.; Xia, B. Using bioenergy crop cassava (Manihot esculenta) for reclamation of heavily metal-contaminated land. Int. J. Phytoremediat. 2020, 22, 1313-20.
19. Ministry of Industry and Information Technology of the People’s Republic of China; Ministry of Housing and Urban-Rural Development of the People’s Republic of China; Ministry of Transport of the People’s Republic of China; et al. Notice of the five departments on printing the Action Plan for the Innovative Development of Smart Photovoltaic Industry (2021-2025). 2021. (in Chinese). https://www.gov.cn/zhengce/zhengceku/2022-01/05/content_5666484.htm (accessed 2026-05-14).
20. Yang, H.; Gao, X.; Wu, J.; Thompson, J. R.; Flower, R. J. Ecological restoration for China’s mines. Science 2024, 385, 1052-3.
21. He, J.; Wu, Y.; Yong, X.; Ke, Y.; Tan, Q.; Liu, F. Lifecycle risk assessment on the sustainable development of upgrading energy projects using abandoned mines: an ISM-BWM method. Sustainable. Energy. Technol. Assess. 2022, 54, 102833.
22. Fan, J.; Liu, W.; Jiang, D.; et al. Thermodynamic and applicability analysis of a hybrid CAES system using abandoned coal mine in China. Energy 2018, 157, 31-44.
23. Xing, Y.; Wang, J. Y.; Yang, J. Z.; et al. Distributions and existing problems of mining land of abandoned open-pit mines in China. Remote. Sens. Nat. Resour. 2024, 36, 21-6. (in Chinese). https://www.gtzyyg.com/fileGTZYYG/journal/article/gtzyyg/html/2024/2097-034X/2097-034X-36-2-21.shtml?utm_source (accessed 2026-05-14).
24. Quan, S.; Xi, F.; Wang, J.; et al. Potential of renewable energy development on abandoned mine areas: a case study in Liaoning province, northeast China. Appl. Ecol. 2019, 30, 2803-12. (in Chinese).
25. Yang, J. Z.; Nie, H. F.; Jing, Q. Q. Preliminary analysis of mine geo-environment status and existing problems in China. Remote. Sens. Land. Resour. 2017, 29, 1. (in Chinese). http://kns--cnki--net--https.cnki.mdjsf.utuvpn.utuedu.com:9000/kcms2/article/abstract?v=LM91IAda-MfVhYKcQ1gmC44SRapOqiKESMweHWVttMDYfWYgT2tGTI3UhnGXvut6aV88wxVBux4kpnbEMIdH1D-oAiybsoGhyAJ1zE8ean3tCw-McD7Cplu6AywJKpuNvpjDv10L3WYRVAabsferYBH7Mt-w8CBTg4rpZQ7P88-CehsdtFLg4g==&uniplatform=NZKPT&language=CHS (accessed 2026-05-14).
26. TrinaSolar. Inverter matching for trina solar’s vertex series photovoltaic modules. 2021. https://static.trinasolar.com/sites/default/files/White%20Paper%20on%20Inverter%20Matching%20for%20Trina%20Solar%E2%80%99s%20Vertex%20Series%20Photovoltaic%20Modules-V3.pdf (accessed 2026-05-14).
27. Westbrook, O. W.; Collins, F. D. Energy model validation for large-scale photovoltaic systems. In 2013 IEEE 39th Photovoltaic Specialists Conference (PVSC), Tampa, FL, USA, June 16-21, 2013; IEEE, 2013, pp 0830-5.
28. Qaseem, M. F.; Wu, A. Marginal lands for bioenergy in China; an outlook in status, potential and management. GCB. Bioenergy. 2020, 13, 21-44.
29. Zhang, J.; Zhu, G. Comparative studies of photovoltaic power generation and coal-fired power generation based on life cycle assessment. Environ. Sci. Manag. 2014, 39, 86-90. (in Chinese).
30. Li, C.; He, L.; Cao, Y.; et al. Carbon emission reduction potential of rural energy in China. Renew. Sustain. Energy. Rev. 2014, 29, 254-62.
31. Wang, J.; Fu, J.; Zhao, Z.; et al. Benefit analysis of multi-approach biomass energy utilization toward carbon neutrality. Innovation 2023, 4, 100423.
32. Ministry of Ecology and Environment of the People’s Republic of China. The release of the 2021 carbon dioxide emission factors for electricity. 2024. (in Chinese). https://www.mee.gov.cn/xxgk2018/xxgk/xxgk01/202404/t20240412_1070565.html (accessed 2026-05-14).
33. Hou, G.; Sun, H.; Jiang, Z.; et al. Life cycle assessment of grid-connected photovoltaic power generation from crystalline silicon solar modules in China. Appl. Energy. 2016, 164, 882-90.
34. Li, H.; Wang, L.; Shen, L. Potential CO2 emission reduction by development of non-grain-based bioethanol in China. Environ. Manage. 2010, 46, 555-64.
35. Liu, S. Q.; Mao, X. Q.; Xing, Y. K. Estimation and comparison of greenhouse gas mitigation potential of new energy by life cycle assessment in China. Clim. Change. Res. 2012, 8, 48-53. (in Chinese).
36. Li, X. L. Application study of carbon reductions calculation methodology on biodiesel project. M.S. Thesis, Hebei University of Engineering, Handan, China, 2015. (in Chinese). https://d.wanfangdata.com.cn/thesis/Y2733497 (accessed 2026-05-14).
37. Wang, C.; Chen, H.; Wang, Z.; Gao, Y.; Zhang, G. Economic assessment and grid parity analysis of photovoltaic power generation considering tradable green certificate. Appl. Energy. 2025, 382, 125282.
38. China Photovoltaic Industry Association. China PV industry development roadmap 2025-2026. 2026. (in Chinese). https://www.chinapv.org.cn/Industry/resource_1411.html (accessed 2026-05-14).
39. Bank of China. Loan prime rate (LPR). 2026. (in Chinese). https://www.bankofchina.com/fimarkets/lilv/fd32/201310/t20131031_2591219.html (accessed 2026-05-14).
40. Zhang, C.; Yan, X.; Nie, J. Economic analysis of whole-county PV projects in China considering environmental benefits. Sustain. Prod. Consum. 2023, 40, 516-31.
41. National Development and Reform Commission of the People’s Republic of China. Matters concerning the orderly promotion of the development of direct connection of green electricity. 2025. (in Chinese). https://www.ndrc.gov.cn/xxgk/zcfb/tz/202505/t20250530_1398138_ext.html (accessed 2026-05-14).
42. Wu, T. Energy efficiency, carbon emission and techno-economic study of comprehensive biomass utilisation paths. Ph.D. Dissertation, Shandong University, Jinan, China, 2024. (in Chinese). https://www.chndoi.org/Resolution/Handler?doi=10.27272/d.cnki.gshdu.2024.001622 (accessed 2026-05-19).
43. Zhao, L.; Zhang, X.; Xu, J.; Ou, X.; Chang, S.; Wu, M. Techno-economic analysis of bioethanol production from lignocellulosic biomass in China: dilute-acid pretreatment and enzymatic hydrolysis of corn stover. Energies 2015, 8, 4096-117.
44. Zhang, B. B.; Ma, Y.; Geng, W.; et al. Assessing suitability and liquid biofuels production potential of four energy species in China. Acta. Energiae. Solaris. Sin. 2018, 39, 864-72. (in Chinese). http://kns--cnki--net--https.cnki.mdjsf.utuvpn.utuedu.com:9000/kcms2/article/abstract?v=LM91IAda-McrqOIhVRPSD7slf_YPUYT-NvfyHA4i5QTfRkJt2qNELSlWw92bVg18g9XoBsLZKyGB5X1s8U3LBrn5qcTUELjb9Xq-ggGBVGbAQ84M7GyjZk0xL6PqKeIJn_01cQfqSbv-L0Sbd_dy7KTO7_QD0MPmHd2z9c-Swk0ASz9hmiOVZQ==&uniplatform=NZKPT&language=CHS (accessed 2026-05-14).
45. Sichuan Provincial Development and Reform Commission. Notice on matters related to on-grid electricity prices for biomass power generation. 2025. (in Chinese). https://fgw.sc.gov.cn/sfgw/tzgg/2025/2/12/593b928c6edf482e8b21a73a74ed9140.shtml (accessed 2026-05-14).
46. Toodudu. 2023-2024 annual report on China’s ethanol industry. 2024. (in Chinese). https://cdn.toodudu.com/2023/11/20/xfnOJpAMliB72aSwvdri3ODeJLpV40I4xx0JSw3J.pdf (accessed 2026-05-14).
47. National Development and Reform Commission of the People’s Republic of China. The maximum retail prices of gasoline and diesel. 2025. (in Chinese). https://www.ndrc.gov.cn/xwdt/xwfb/202507/t20250701_1398919.html (accessed 2026-05-14).
48. State Grid Hebei Electric Power Co., Ltd. Announcement on agent purchased electricity price (November 2025)-including transferred power supply. 2025. (in Chinese). http://www.he.sgcc.com.cn/html/main/col466/2025-10/29/20251029104229840974794_1.html (accessed 2026-05-14).
49. Shanxi Development and Reform Commission. Notice on announcing the results of the 2026 New energy mechanism electricity price bidding. 2026. (in Chinese). https://fgw.dt.gov.cn/dtsfzhggwyhz/ksdt/202602/686da1d8b5fb40db925d6165b4f9ecc8.shtml (accessed 2026-05-14).
50. National Bureau of Statistics. 2025 Statistical Bulletin of National Economic and Social Development of the People’s Republic of China; China Statistics Press: Beijing, 2026. (in Chinese). https://www.stats.gov.cn/zwfwck/sjfb/202602/t20260228_1962662.html (accessed 2026-05-14).
51. Zhao, G.; Yu, B.; An, R.; Wu, Y.; Zhao, Z. Energy system transformations and carbon emission mitigation for China to achieve global 2 °C climate target. J. Environ. Manage. 2021, 292, 112721.
52. Zheng, B.; Wang, S.; Xu, J. A review on the CO2 emission reduction scheme and countermeasures in China’s energy and power industry under the background of carbon peak. Sustainability 2022, 14, 879.
53. Zheng, X. Q.; Lu, Y. L.; Ma, C. M.; et al. Greenhouse gas emissions from extractive industries in a globalized era. J. Environ. Manage. 2023, 343, 228172.
54. Song, C.; Guo, Z.; Liu, Z.; Hongyun, Z.; Liu, R.; Zhang, H. Application of photovoltaics on different types of land in China: opportunities, status and challenges. Renew. Sustain. Energy. Rev. 2024, 191, 114146.
55. Zhao, C.; Andersen, P. B.; Træholt, C.; Hashemi, S. Grid-connected battery energy storage system: a review on application and integration. Renew. Sustain. Energy. Rev. 2023, 182, 113400.
56. Kataray, T.; Nitesh, B.; Yarram, B.; et al. Integration of smart grid with renewable energy sources: opportunities and challenges - a comprehensive review. Sustainable. Energy. Technol. Assess. 2023, 58, 103363.
57. Bera, M.; Das, S.; Garai, S.; et al. Advancing energy efficiency: innovative technologies and strategic measures for achieving net zero emissions. Carbon. Footprints. 2025, 4, 3.
58. National Energy Administration. Guidance opinions of the National Energy Administration on promoting the integrated development of coal and new energy. 2025. (in Chinese). https://www.nea.gov.cn/20251107/8b990f43dc774fc88c643614205e383d/c.html (accessed 2026-05-14).
59. Xiao, S.; Ren, H.; Zhao, Y.; et al. Land reuse for carbon mitigation: decarbonization potential of solar photovoltaics in China’s open-pit mining areas. Land. Use. Policy. 2025, 158, 107768.
60. IRNA. Renewable Power Generation Costs in 2024. International Renewable Energy Agency: Abu Dhabi, 2025. https://www.irena.org/-/media/Files/IRENA/Agency/Publication/2025/Jul/IRENA_TEC_RPGC_in_2024_2025.pdf (accessed 2026-05-14).
61. Zhang, X.; Yu, R.; Karplus, V. J. The development of China’s national carbon market: an overview. Energy. Clim. Manag. 2025, 1, 9400015.
62. Zhang, Z.; Wang, Q.; Liu, Z.; Chen, Q.; Guo, Z.; Zhang, H. Renew mineral resource-based cities: assessment of PV potential in coal mining subsidence areas. Appl. Energy. 2023, 329, 120296.
63. Xia, Z.; Li, Y.; Guo, S.; et al. Satellites reveal spatial heterogeneity in dryland photovoltaic plants’ effects on vegetation dynamics. Earth’s. Future. 2024, 12, e2024EF004427.
64. Rana, V.; Kaps, C.; Netessine, S. When where watt: Harnessing the value of time and location for renewable electricity generation. Working Paper, January 2025. https://www.hbs.edu/faculty/Pages/item.aspx?num=64471 (accessed 2026-05-14).
65. Qays, M. O.; Kumar, R.; Ahmed, M.; Lachowicz, S.; Amin, U. Empowering Optimal Operations with Renewable Energy Solutions for Grid Connected Merredin WA Mining Sector. Applied. Sciences. 2025, 15, 5516.
Cite This Article
How to Cite
Download Citation
Export Citation File:
Type of Import
Tips on Downloading Citation
Citation Manager File Format
Type of Import
Direct Import: When the Direct Import option is selected (the default state), a dialogue box will give you the option to Save or Open the downloaded citation data. Choosing Open will either launch your citation manager or give you a choice of applications with which to use the metadata. The Save option saves the file locally for later use.
Indirect Import: When the Indirect Import option is selected, the metadata is displayed and may be copied and pasted as needed.
About This Article
Copyright

Data & Comments
Data
0


Comments
Comments must be written in English. Spam, offensive content, impersonation, and private information will not be permitted. If any comment is reported and identified as inappropriate content by OAE staff, the comment will be removed without notice. If you have any queries or need any help, please contact us at [email protected].