

fig2
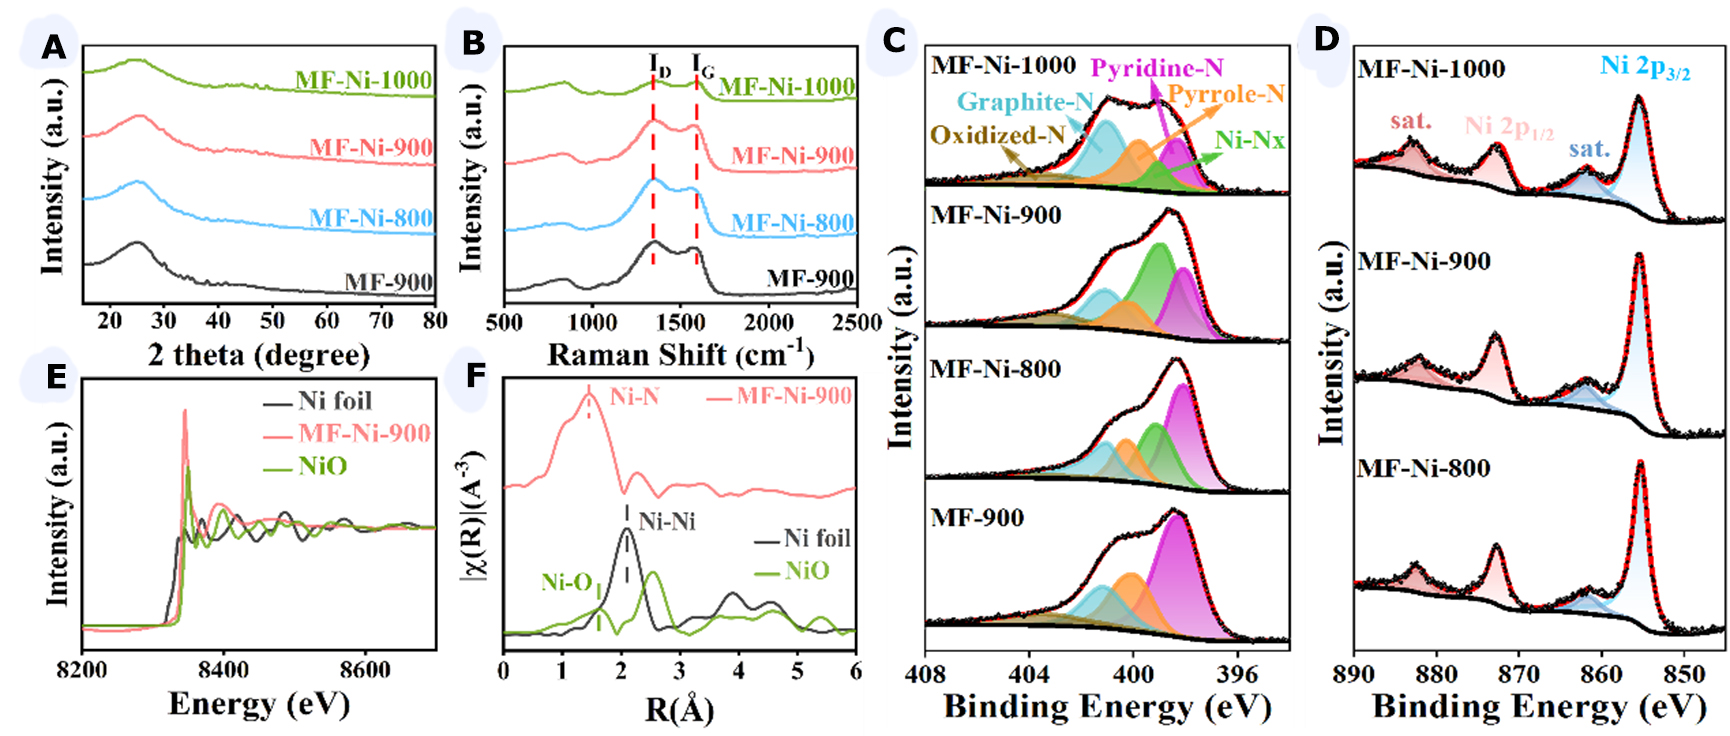
Figure 2. (A-C) XRD image (A), Raman image (B), N 1s spectrum of XPS image (C) of MF-900, MF-Ni-800, MF-Ni-900, and MF-Ni-1000; (D) Ni 2p spectrum of XPS image of MF-Ni-800, MF-Ni-900, and MF-Ni-1000; (E) Ni K-edge XANES spectra; (F) Fourier transform EXAFS spectra for MF-Ni-900, Ni foil, and NiO. XRD: X-ray diffraction; XPS: X-ray photoelectron spectroscopy; MF: melamine foam; XANES: X-ray absorption near edge structure; EXAFS: extended X-ray absorption fine structure.


