

fig4
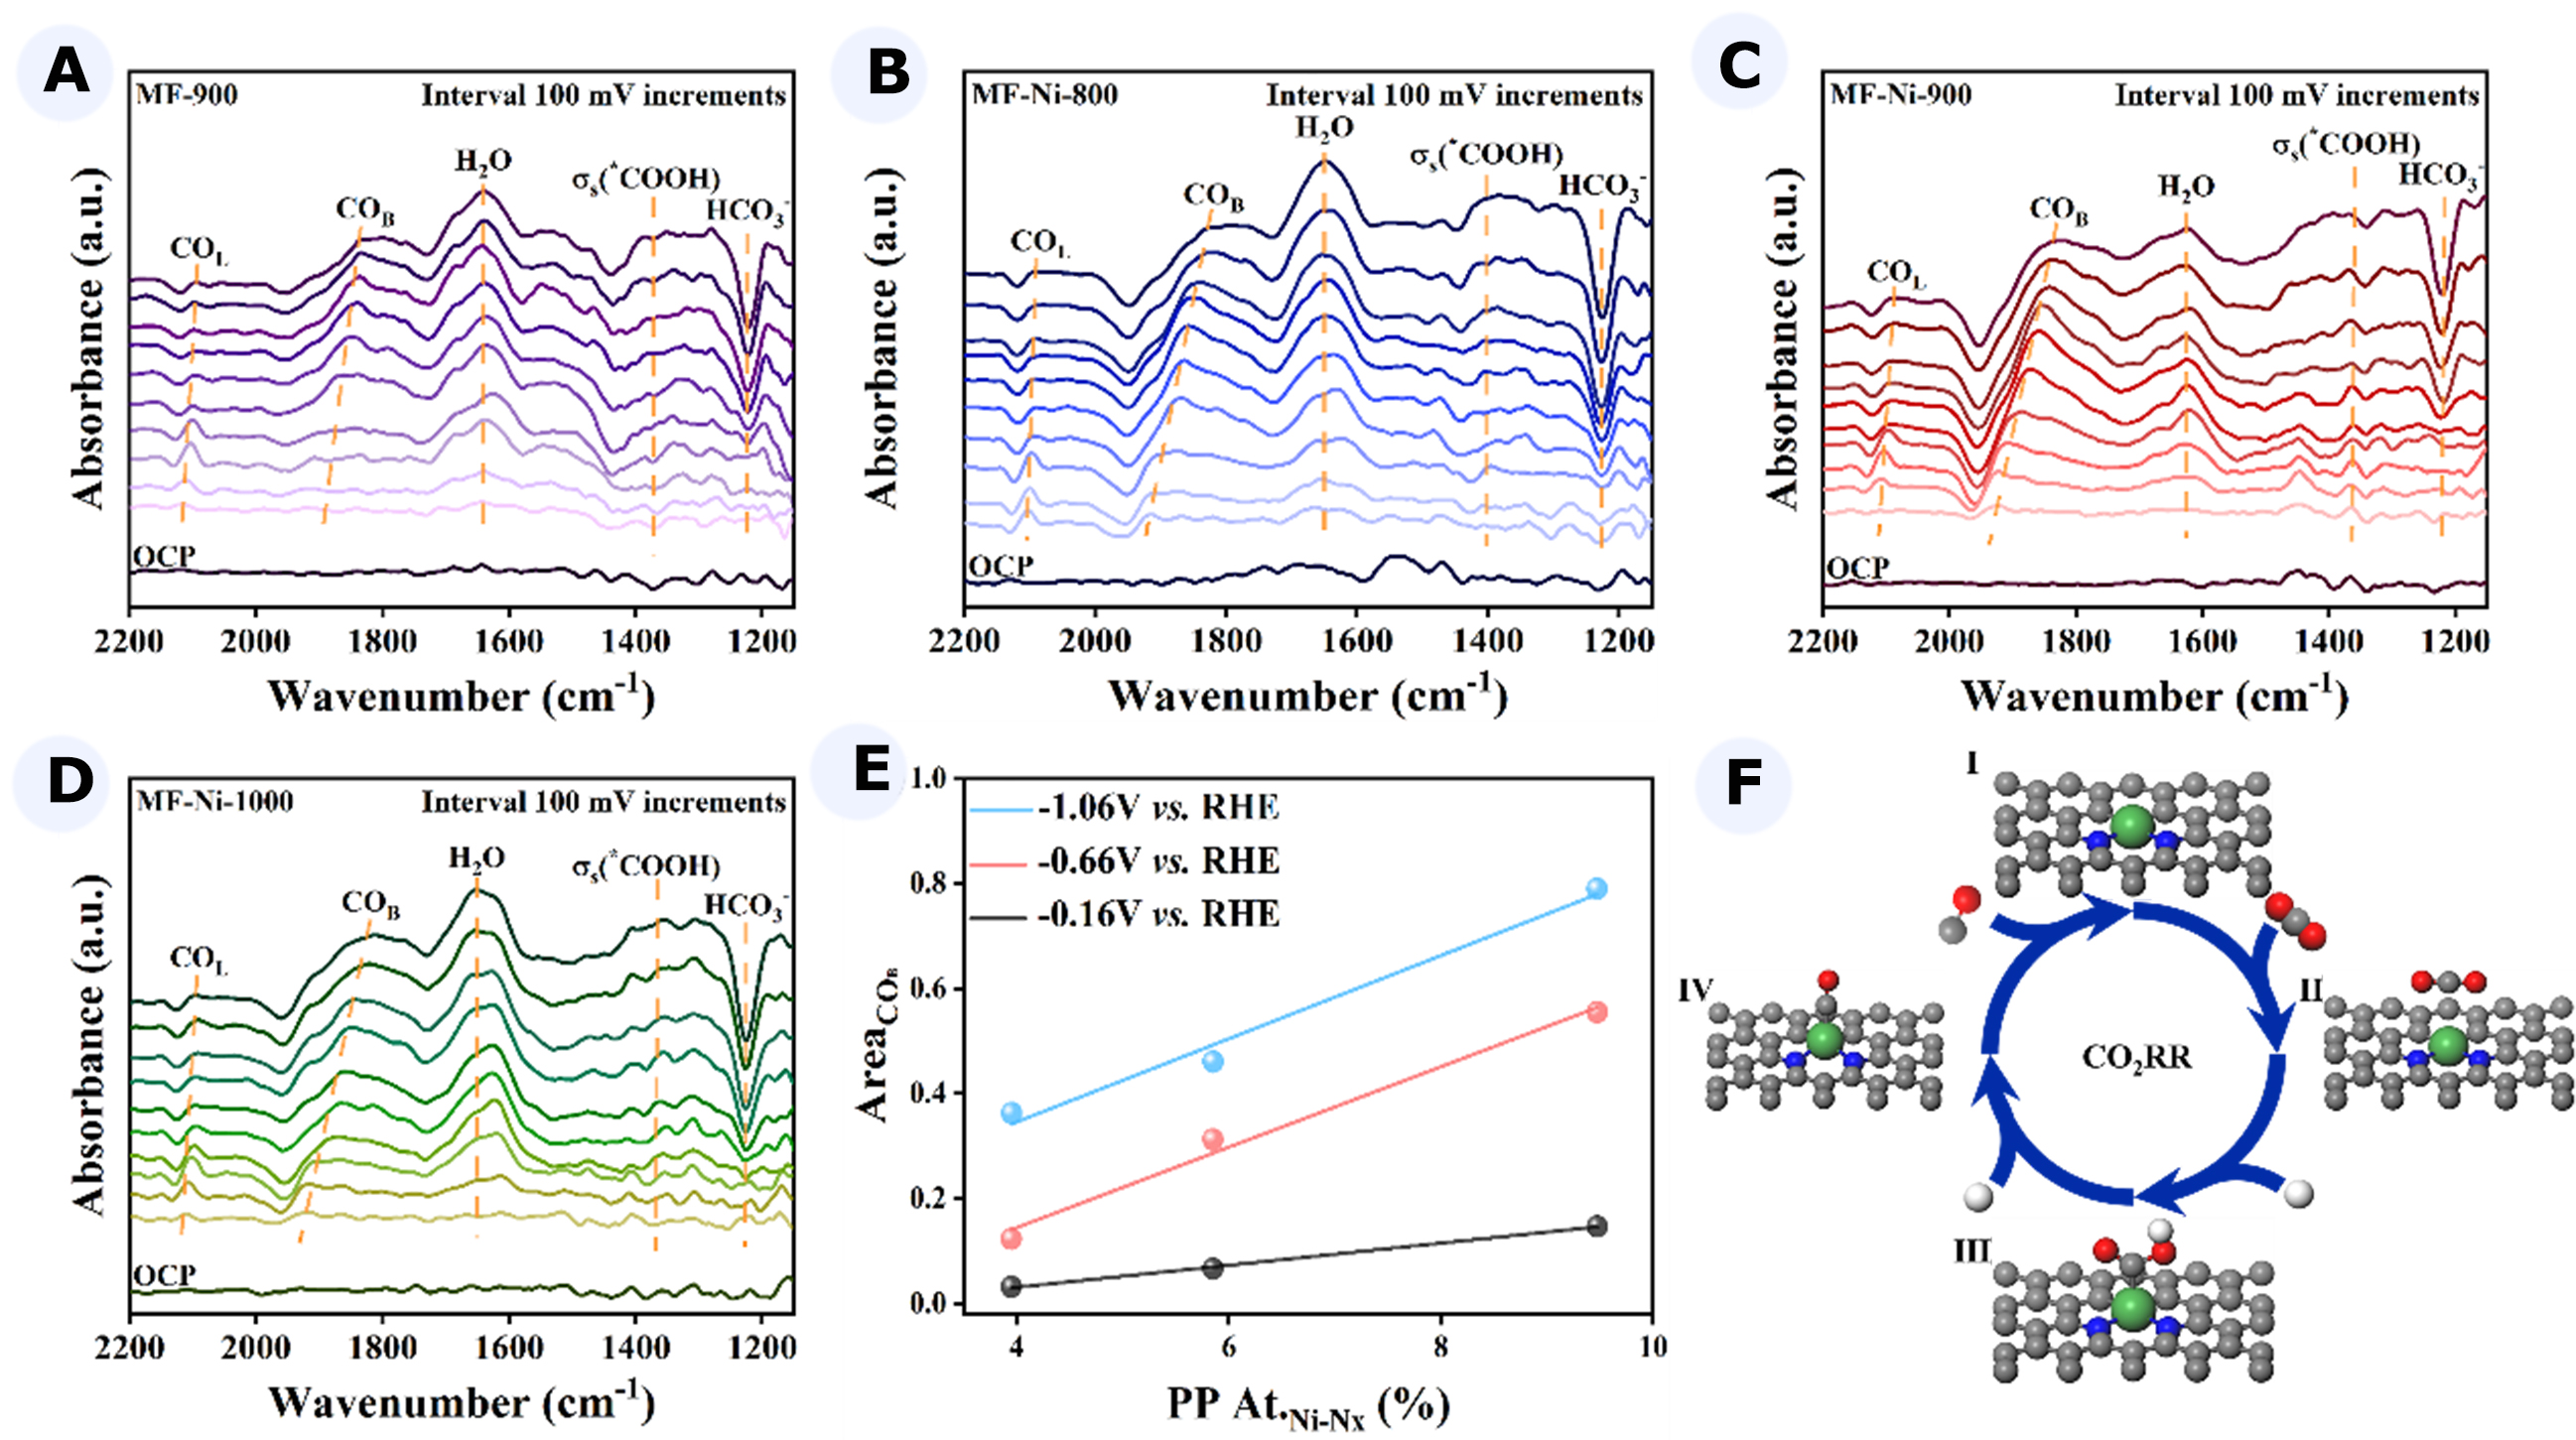
Figure 4. (A-D) At -0.16 to -1.06 V vs. RHE potentials, in situ IR images of MF-900 (A), MF-Ni-800 (B), MF-Ni-900 (C), and MF-Ni-1000 (D); (E) Linear relationship between COB peak area and Ni-Nx content; (F) Mechanism diagram of CO2 to CO. RHE: Reversible hydrogen electrode; IR: infrared spectroscopy; MF: melamine foam; COB: CO adsorption.


