



Mitigating hydrogen evolution via ionomer structure for efficient CO2 reduction in acidic membrane electrode assembly electrolyzers
 0
0 Abstract
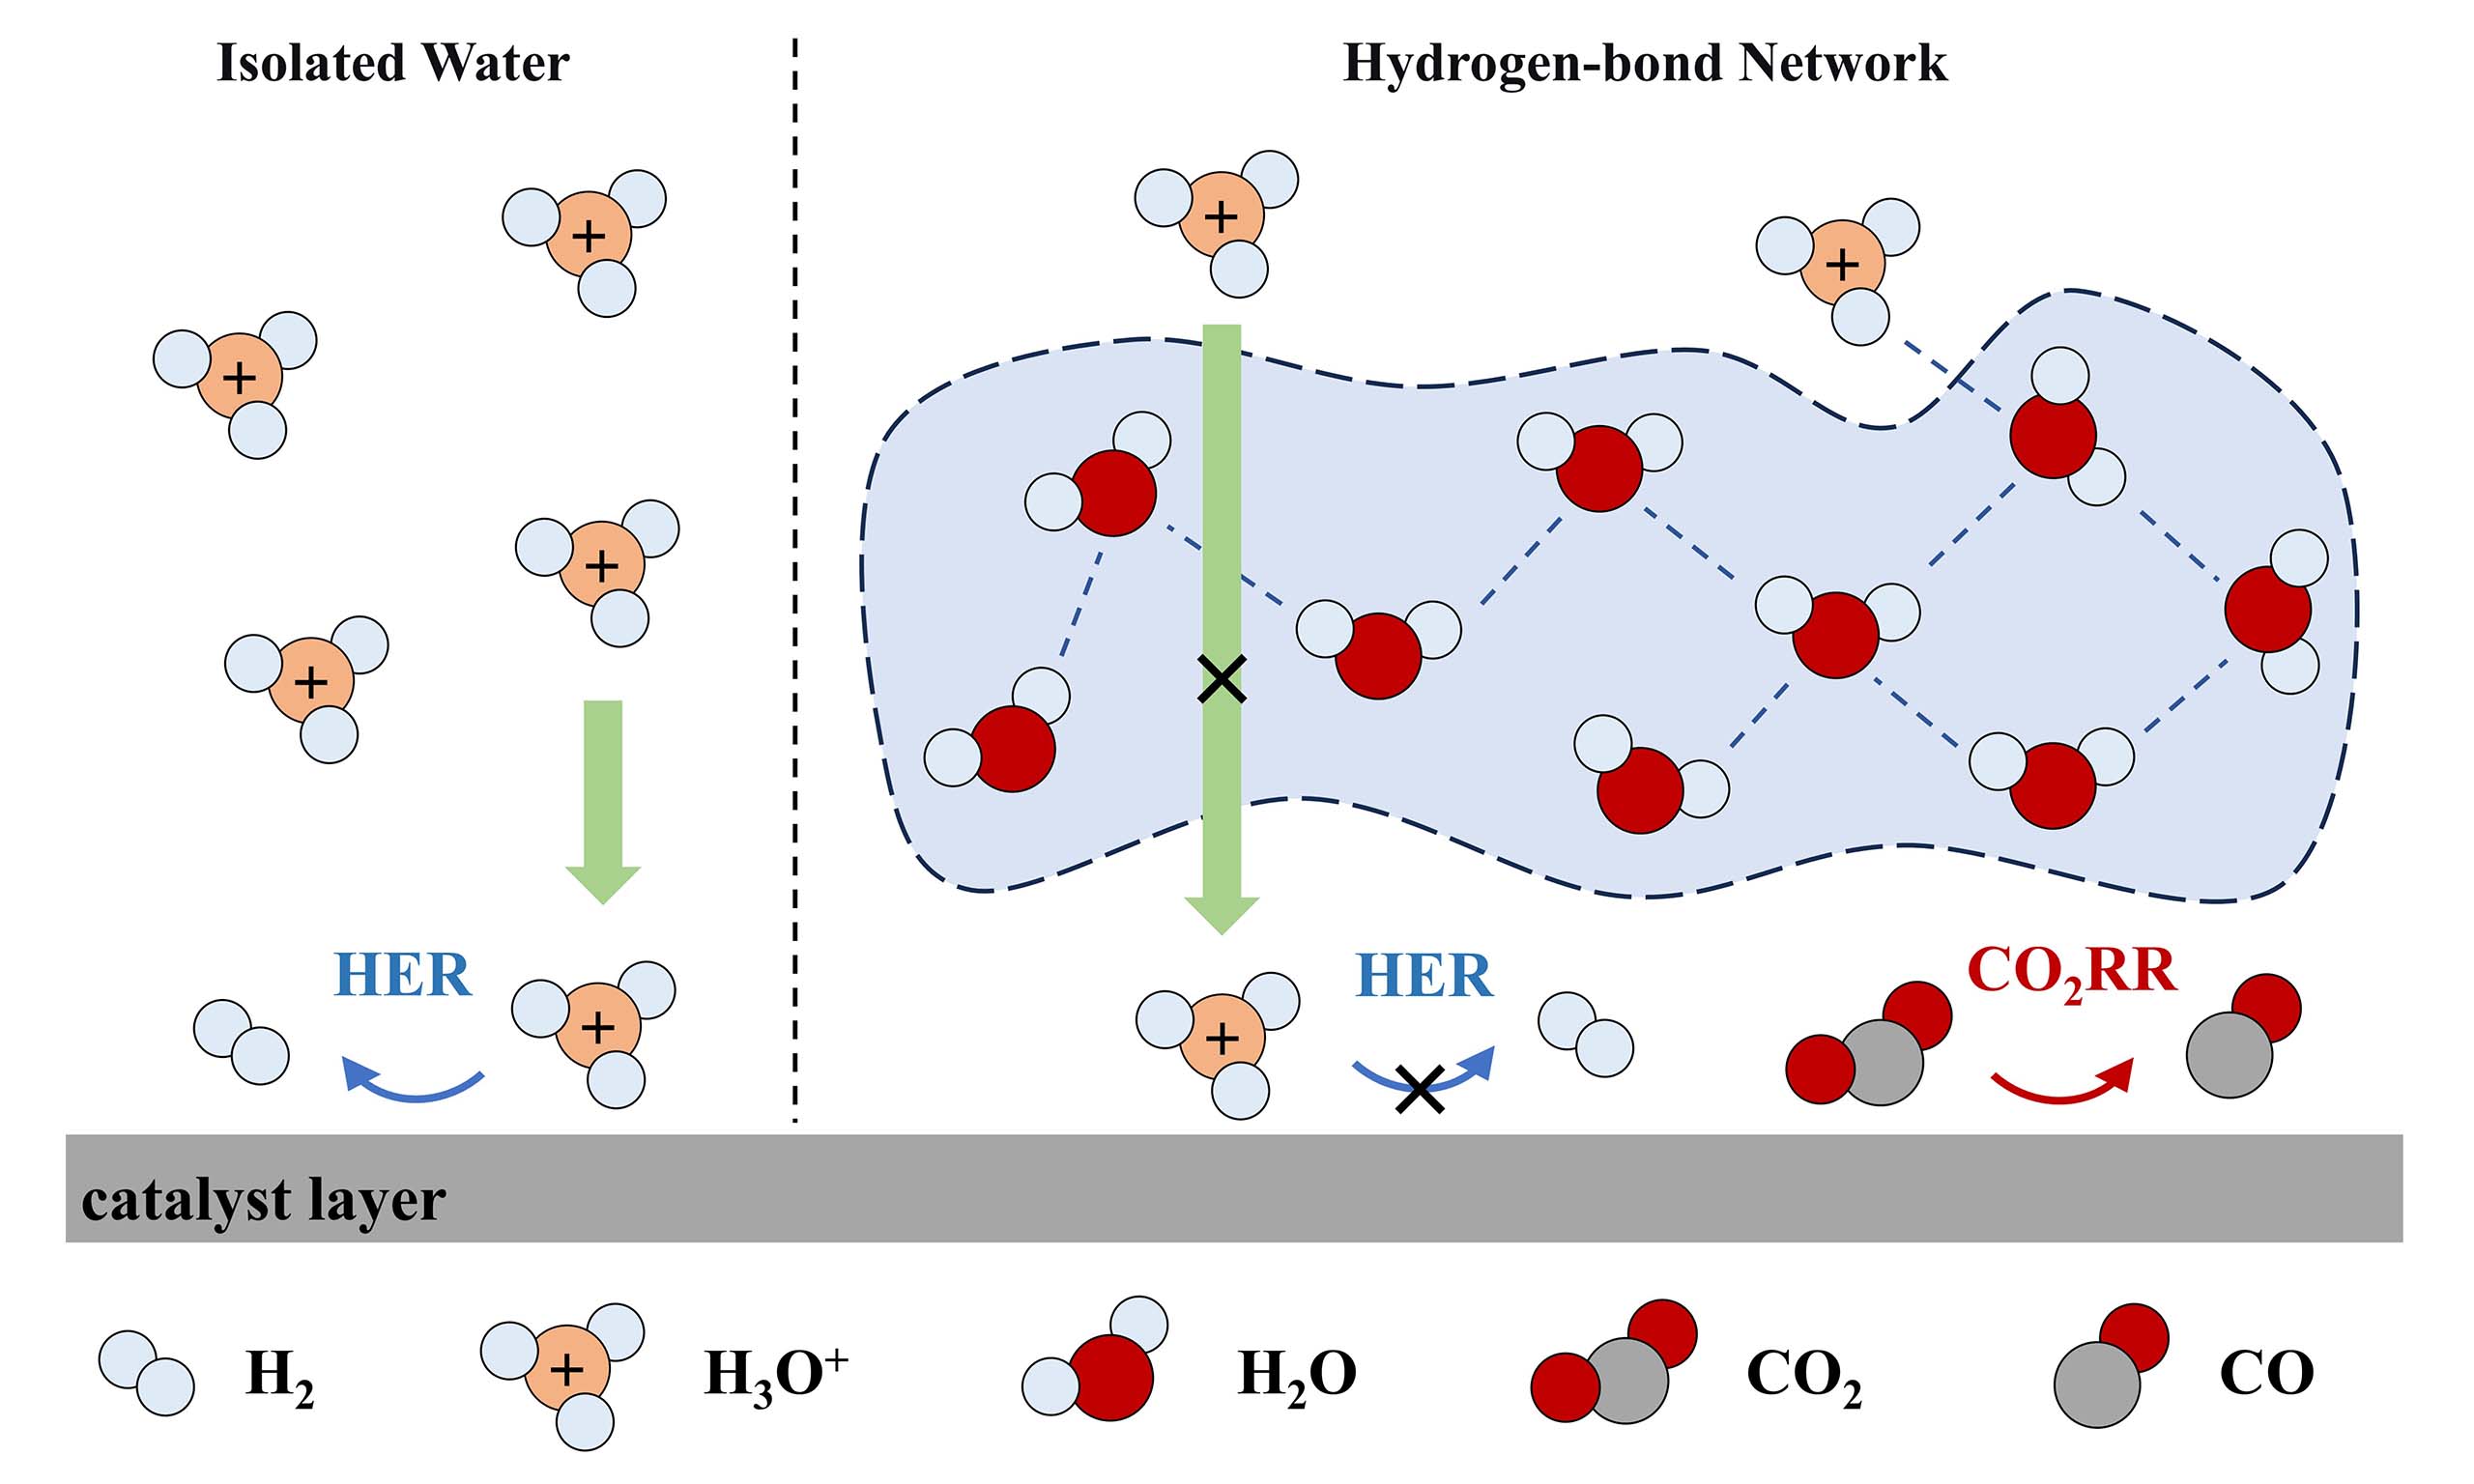
Electrocatalytic CO2 reduction in acidic media suppresses (bi)carbonate formation and improves CO2 single-pass conversion, but the catalyst layer in contact with the hydrated proton environment usually leads to severe competing hydrogen evolution reaction (HER). Regulating the interfacial microenvironment is an effective strategy to inhibit the migration of H+ during the electrolysis process and block the contact between H2O and the catalyst. In this work, we systematically investigate the influence of ionomer side chain on the interfacial water structure in an acidic membrane electrode assembly electrolyzer. The short side chain ionomer D79, characterized by a high density of sulfonic acid groups, generates abundant nanoscale micropores and promotes a more ordered dipole alignment of water molecules. In situ attenuated total reflection surface-enhanced infrared absorption spectroscopy reveals that over 60% of the interfacial water exists as strongly hydrogen-bonded water on the catalyst surface under an applied potential, which is conducive to suppressing HER from protons and free water. Optimizing the ionomer ratio to 20 wt% balances CO2 transport and hydrated proton migration. Consequently, the D79-modified electrode achieves a CO Faradaic efficiency (FECO) of 91.1% at 500 mA cm-2, significantly outperforming most reported studies. This work demonstrates that ionomer side chains can effectively regulate the hydrogen-bond network and suppress competitive HER, offering critical insights into interfacial microenvironment engineering for acidic CO2 electrolysis.
Keywords
INTRODUCTION
The CO2 reduction (CO2RR) represents a promising strategy for converting carbon emissions into valuable chemicals and fuels, making a significant contribution towards achieving carbon neutrality[1-4]. Numerous previous studies have primarily focused on CO2RR in alkaline media, as the alkaline environment suppresses the competing HER and enables high product selectivity. However, in alkaline media, CO2 readily reacts with OH- to form (bi)carbonate species (CO2 + 2OH- → CO32- + H2O, CO2 + OH- → HCO3-), which migrate across the membrane toward the anode during electrolysis, limiting the single-pass conversion efficiency of CO2[5,6]. To achieve a higher single-pass conversion, acidic media have been proposed as an alternative. In acidic environments, once (bi)carbonate is formed, it is rapidly reconverted to CO2 by the abundant H+ (CO32- + 2H+ → CO2 + H2O, HCO3- + H+ → CO2 + H2O), which has demonstrated potential in improving overall carbon efficiency [Supplementary Figure 1][7-9].
However, the acidic environment also intensifies the competitive HER, making it imperative to develop strategies that can selectively suppress the more kinetically favorable HER[10-12]. To date, adjusting the interfacial microenvironment in acid has proven to be an effective approach for suppressing the HER and improving product selectivity[13,14]. Recent studies have primarily focused on modulating the cathode interfacial microenvironment using alkali cations. Under an applied voltage, these positively charged alkali cations can form a local electric field on the electrode surface, which is in favor of repelling H+ to suppress HER[15,16]. During the electrolysis process, however, alkali cations continuously accumulate at the catalyst surface. Once the (bi)carbonate species formed from CO2RR-generated OH- and CO2 exceeds the buffering capacity of H+, it precipitates as bicarbonate salts with alkali cations, rapidly clogging the electrodes and electrolyzer flow channels and leading to system deactivation[17,18]. Therefore, it is necessary to avoid strategies that increase cation concentration to inhibit HER.
The ionomer on the catalyst layer surface serves as a critical channel for proton and water transport[19]. By influencing the hydrogen-bonding network and interfacial water, the ionomer can regulate the local microenvironment and thereby suppress the HER[20]. During CO2 electrolysis, H3O+ can continuously migrate from the anode to the cathode across the proton exchange membrane. Given that the kinetics of CO2RR are slower than those of HER, both interfacial H2O and H+ serve as potential proton sources for reduction[21]. Therefore, improving the integrity of the interfacial hydrogen-bonding network is conducive to suppressing the consumption of free water and impeding the migration of H+ toward the catalyst surface, thus enabling CO2RR in acidic membrane electrode assembly (MEA) electrolyzers. Based on the difference in functional groups, ionomers are classified into anion-exchange ionomers (AEI) and cation-exchange ionomers (CEI). AEI represented by Sustainion are susceptible to functional group degradation under strongly acidic conditions and thus lose their functionality, rendering CEI the only viable choice in acidic systems[22]. Nafion is the most widely applied CEI; however, the conventional long-side-chain Nafion (e.g., D520, with a side chain of approximately 6 to 7 atoms) exhibits structural deficiencies in acidic CO2 electrolysis. Its flexible long side chains lead to excessively wide ion-cluster channels (> 2.5 nm), providing insufficient sieving of hydronium ions. A substantial flux of H+ reaches the catalyst surface and neutralizes the local high-pH microenvironment, allowing HER to dominate. Meanwhile, the sparse distribution of sulfonic acid groups limits its capacity to regulate the interfacial water structure[23]. The short side chain (SSC) Aquivion (e.g., D79, with a side chain approximately one-third the length of the former) addresses these issues. The narrowed ion-cluster channels (approximately 1.5 nm) effectively block hydronium ions, while the denser distribution of sulfonic acid groups facilitates the reinforcement of the hydrogen-bonding network for constraining interfacial water. Nevertheless, the quantitative correlation between side chain length and its impact on interfacial water structure, as well as CO2RR performance, warrants further investigation.
In this study, we investigated the impact of the side chain on the interfacial water hydrogen-bond network for acidic CO2RR. We focused on SSC ionomers, which feature a higher density of sulfonic acid groups, resulting in smaller micropores at the nanoscale. In situ attenuated total reflection surface-enhanced infrared absorption spectroscopy (ATR-SEIRAS) revealed that the higher density of sulfonic acid groups and micropores in the SSC ionomer led to a more ordered dipole alignment of water molecules, with over 60% of the interfacial water existing as strongly hydrogen-bonded water, which effectively suppressed the HER under high current densities in acidic media. Furthermore, in situ electrochemical impedance spectroscopy (EIS) and distribution of relaxation times (DRT) analysis showed that tuning the ionomer ratio optimized the CO2 transport, achieving a FECO of 91.1% at 500 mA cm-2, significantly outperforming most reported studies [Supplementary Table 1]. Overall, this work offers critical insights into the regulation of the interfacial microenvironment by ionomer structure and loading for acidic CO2RR in MEA electrolyzers.
EXPERIMENTAL
Preparation of catalyst and gas diffusion electrodes
We synthesized the Ni-N-C catalyst through a high-temperature pyrolysis route using carbon black as the support material. Typically, nickel(II) acetate (3.6 mg, Macklin) and 1,10-phenanthroline monohydrate
Ni-N-C gas diffusion electrodes (GDEs) containing different ionomers were fabricated via ultrasonic spray deposition. The catalyst ink consisted of Ni-N-C catalyst (40 mg), D79 ionomer dispersion (35 µL, 25 wt%, Syensqo), and anhydrous ethanol (18 mL). This mixture was ultrasonicated for 30 min to ensure uniform dispersion, then sprayed onto a carbon paper substrate (3 × 3 cm2, H15C13, Freudenberg) using an ultrasonic spray coater. The resulting GDE exhibited an ionomer content of 20 wt% and a catalyst loading of 2 mg cm-2. GDEs containing different types of ionomers (D72, 25 wt%, Syensqo; D520, 5 wt%, DuPont; D521, 5 wt%, DuPont) and varying ionomer contents (5, 10, 20, 30 and 40 wt%) were fabricated following the same procedure. The anode consisted of a 2.5 × 2.5 cm2 titanium felt with a thickness of 0.25 mm (coated with iridium, Fuershun Electronic Material Co., Jiangsu, China).
Materials characterization
Scanning electron microscopy (SEM) imaging was conducted using a Hitachi S-4800 microscope at an accelerating voltage of 3.0 kV, and energy-dispersive X-ray spectroscopy (EDS) maps were collected using the same instrument. High-angle annular dark-field scanning transmission electron microscopy (HAADF-STEM) imaging was performed on an FEI Tecnai G2 F20 microscope at an accelerating voltage of 200 kV. To investigate the microporous structure below 2 nm and CO2 adsorption performance of the ionomers, the ionomer materials were characterized by CO2 adsorption-desorption measurements. CO2 adsorption-desorption measurements were performed using an ASAP 2460 analyzer (Micromeritics) at 0 °C. Prior to measurement, approximately 100 mg of ionomer was degassed at 120 °C under vacuum for 12 h. The CO2 adsorption isotherms were recorded in the relative pressure (P/P0) range of 10-5 to 0.99. The specific surface area was determined using the Brunauer-Emmett-Teller (BET) method. Micropore size distribution was calculated using the density functional theory (DFT) model. CO2 uptake capacity was determined from the adsorption amount at P/P0 ≈ 0.95. Water uptake of the ionomer materials was measured gravimetrically. Ionomer membranes (approximately 2 × 2 cm2) were dried at 80 °C under vacuum for 24 h to obtain the dry weight (Wdry). The membranes were then immersed in deionized water at room temperature for 3 h to ensure complete hydration. The wet membranes were gently blotted with filter paper to remove surface water and immediately weighed (Wwet). The water uptake was calculated as: Water uptake (%) = (Wwet - Wdry)/Wdry × 100%. Each measurement was repeated three times, and the average values are reported.
Electrochemical measurements
MEA electrolyzer test
The performance of CO2 electrolysis under high current densities was evaluated using an acidic MEA electrolyzer [Supplementary Figure 2]. A 2.5 × 2.5 cm2 titanium felt with a thickness of 0.25 mm (coated with iridium) served as the anode, while Ni-N-C GDEs containing various ionomers (1 × 1 cm2) functioned as the cathode. A proton exchange membrane (PEM, Nafion 117, DuPont) was positioned between the two electrodes. The anode chamber received a continuous supply of 0.5 M K2SO4 electrolyte at 15 mL min-1 via a peristaltic pump, and its pH was set to 1 using H2SO4, whereas humidified CO2 was supplied to the cathode chamber at 100 mL min-1. Galvanostatic electrolysis was performed at current densities ranging from 100 to 500 mA cm-2. Cyclic voltammetry (CV) was performed at scan rates of 10, 12, 14, 16, and 18 mV s-1 over the potential range of 0.1-0.2 V vs. reversible hydrogen electrode (RHE). The scan rates were varied to determine the electrochemical double-layer capacitance (Cdl) from the slope of the current density (at the midpoint potential) vs. scan rate plot. The Cdl value is proportional to the electrochemically active surface area (ECSA), enabling comparison of the accessible active surface area for GDEs modified with different ionomer ratios. Galvanostatic EIS measurements were performed in a MEA electrolyzer over a frequency range from 100 kHz to 1 Hz, with 10 data points acquired per decade and an amplitude of 10 mA. The EIS data were collected after a 5 min galvanostatic hold at the desired current density. For instance, prior to collecting the EIS spectrum at 100 mA cm-2, the MEA electrolyzer was operated at 100 mA cm-2 for 5 min. To facilitate a more accurate interpretation of the EIS results, the DRT method was employed to extract the electrochemical processes corresponding to different time constants (e.g., charge transfer, diffusion, etc.) from the impedance data. Through mathematical transformation, the impedance response was converted into the relaxation time distribution function γ(τ), enabling the identification and quantification of the contribution of each process to the overall polarization.
In situ ATR-SEIRAS measurements
In situ ATR-SEIRAS measurements were conducted on a Bruker INVENIO FTIR spectrometer coupled to an electrochemical workstation. A three-electrode spectroelectrochemical cell with an ATR optical configuration was employed, wherein an Ag/AgCl electrode (saturated KCl) served as the reference electrode, a high-purity Pt wire as the counter electrode, and the as-prepared sample as the working electrode [Supplementary Figure 3]. The electrolyte consisted of CO2-saturated 0.5 M K2SO4, acidified to pH 1 with H2SO4. Prior to and during the measurements, high-purity CO2 was continuously purged through the electrolyte at a flow rate of 30 mL min-1 for at least 30 min to ensure saturation. All spectra were acquired over the wavenumber range of 4,000-400 cm-1, and each spectrum was averaged from 32 scans at a spectral resolution of 8 cm-1. All measured potentials were referenced to the RHE scale according to the formula: E (V vs. RHE) = E (V vs. Ag/AgCl) + 0.197 + 0.0591 × pH[23].
Product analysis
The gaseous products (CO and H2) collected after electrolysis were analyzed by a gas chromatograph (GC) equipped with a flame ionization detector (FID) for CO and a thermal conductivity detector (TCD) for H2.
The FE values for CO and H2 were determined using the following equation[24]:
where Zi represents the number of electrons transferred per mole of product i (CO or H2), F represents the Faradaic constant (96,485 C mol-1), ni (mol) denotes the molar quantity of product i produced, and Q (C) refers to the total charge quantity.
The partial current density (ji) for each product was determined using the following equation[24]:
where jtotal denotes the overall current density applied to the system, and FEi is the Faradaic efficiency of product i.
Instruments and characterization equipment
The following instruments were used in this study: scanning electron microscopy (S-4800, Hitachi, Japan); high-angle annular dark-field scanning transmission electron microscopy (Tecnai G2 F20, FEI, USA); CO2 adsorption-desorption measurements (ASAP 2460, Micromeritics, USA); gas chromatography (8890, Agilent Technologies, USA); electrochemical workstation (PARSTAT MC, Princeton Applied Research, USA); in situ ATR-SEIRAS (INVENIO, Bruker, Germany); ultrasonic spray coater (SimCoat Coating System, Sono-Tek, USA). All instruments were operated according to the manufacturers' specifications.
RESULTS AND DISCUSSION
Morphological and structural characterization
This study investigates the influence of ionomers on CO2RR in an MEA-type electrolyzer. In the MEA, humidified CO2 from the cathode flow channel is transported through the gas diffusion layer (GDL) to the catalyst, while anodic water concurrently crosses the membrane to reach the reaction interface. At the three-phase interface, CO2, protons, and electrons are consumed to generate CO and H2, rendering CO2 transport and interfacial water structure critical determinants of MEA performance. Ni-N-C is selected as the catalyst due to its low cost as a non-precious metal catalyst and its excellent CO selectivity, making it widely adopted in this field. During the preparation of GDE, the catalyst ink is uniformly sprayed onto the GDL, forming a thin film of ionomer that encapsulates the carbon support and catalyst surface [Figure 1A]. The resulting cathode and anode are closely assembled with the membrane to form an MEA structure. As illustrated in Figure 1B, the ionomer consists of a hydrophobic polytetrafluoroethylene (PTFE) main chain and pendant side chains carrying terminal hydrophilic sulfonic acid groups (-SO3H), which establish CO2 and water transport channels, respectively, at the three-phase interface. The SSC ionomer features a SSC structure, namely -O-CF2-CF2-SO3H, whereas the LSC ionomer possesses a longer side chain, -O-CF2-CF(CF3)-O-CF2-CF2-SO3H. The shorter side chain of the SSC ionomer enables a higher density of sulfonic acid groups per unit polymer mass, which is corroborated by its higher ion-exchange capacity. The SSC ionomer, with its hydrophilic groups positioned closer to the backbone, exhibits lower ionomer-H2O adsorption energy, enhanced acid resistance, improved water uptake, and higher proton conductivity, thereby promoting the formation of a unique interfacial water structure under acidic conditions[25]. To systematically investigate the influence of ionomer side chain structure, we selected two SSC ionomers (D72 and D79, both Aquivion-type) and two LSC ionomers (D520 and D521, both Nafion-type) for comparative study. As shown in Figure 1C, the as-prepared catalyst exhibits a spherical morphology typical of carbon black supports, with no obvious agglomeration and a uniform porous structure. Elemental mapping reveals distinct Ni and F signals, confirming the successful loading of Ni and ionomer onto the GDE surface. As shown in Figure 1D, HAADF-STEM images reveal numerous isolated bright spots on the carbon black, which correspond to uniformly dispersed single Ni atoms[26,27]. TEM images further demonstrate a distinct thin ionomer film, 2-3 nm thick, coating the catalyst surface [Figure 1E]. It is noteworthy that the SEM, TEM, and contact angle measurements of the D79- and D520-modified GDEs exhibited comparable results [Figure 1 and Supplementary Figures 4-6], indicating that the side chain structure exerts no significant influence on the electrode morphology or macroscopic wettability. Consequently, the subsequent differences in electrochemical performance cannot be attributed to these two factors.
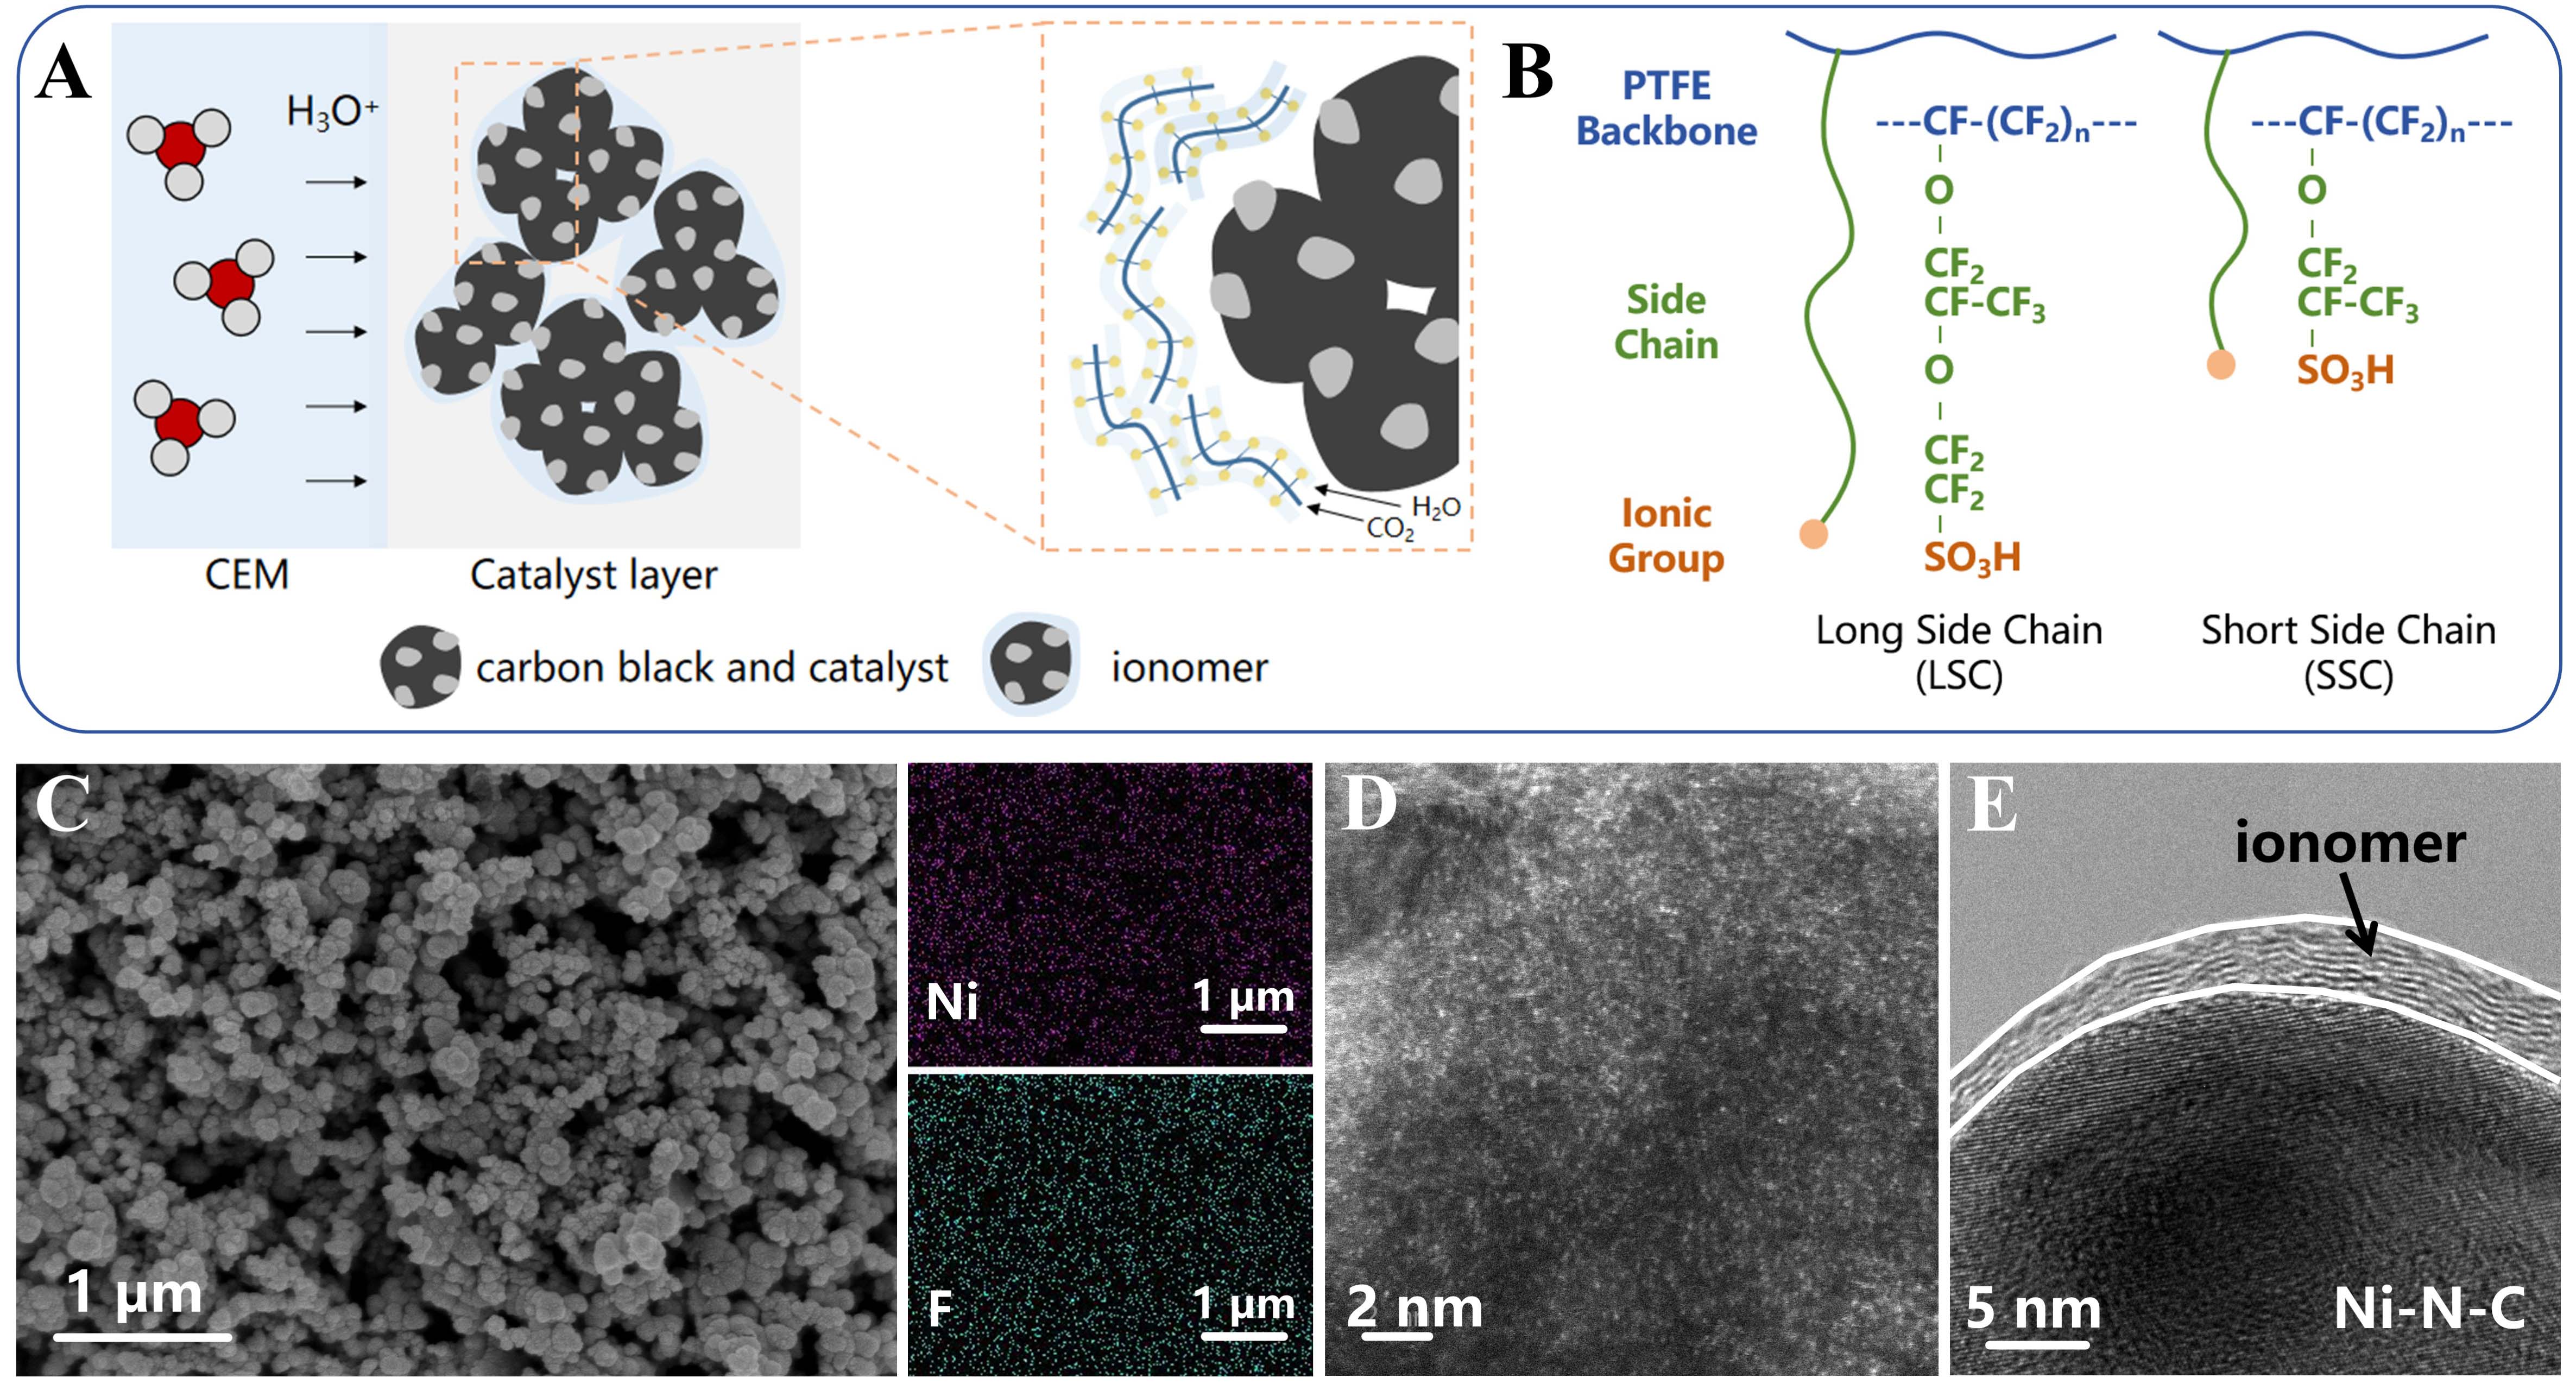
Figure 1. Morphology and structural characterization of the Ni-N-C catalyst. (A) Schematic illustration of ionomer and catalyst (red, gray, and yellow spheres correspond to oxygen atoms, hydrogen atoms, and sulfonic acid groups, respectively); (B) Chemical structure of PFSA ionomers; (C) SEM image and EDS mapping; (D) Aberration-corrected HAADF-STEM image; (E) TEM image.
CO2 absorption-desorption tests were conducted on SSC-D79 and LSC-D520 to probe their microporous structures. As shown in Figure 2A-C, D79 exhibits a cumulative pore area of 3.36 m2 g-1, significantly higher than that of D520 (0.053 m2 g-1), with its micropores predominantly centered at 0.56 and 0.75 nm. The shorter side chains of D79 result in less dense packing of the polymer backbones during the formation of ion transport channels compared to their long side chain ionomers, thereby generating a greater number of smaller micropores at the nanoscale. This abundant microporous structure establishes a denser and more efficient ion transport network. Upon water uptake, these micropores form interconnected nanochannels, providing additional pathways for ion transport and enabling ions to migrate more smoothly without being isolated or blocked. These micropores not only provide additional pathways for ion transport but also serve as confinement sites for CO2 adsorption, explaining the higher CO2 uptake observed for D79. Studies have shown that the ionic conductivity of D79 is 2.5 times that of D520[28]. D79 exhibits a water uptake of 56.1%, markedly higher than the 14.2% observed for D520 [Figure 2D]. This advantage is attributable to its SSC architecture, which allows a greater number of hydrophilic sulfonic acid groups, key to water absorption, to be incorporated within the same polymer chain length, thereby facilitating the formation of a more favorable ionic network on the catalyst surface. It is worth noting that while D79 exhibits substantially higher water uptake than D520, the contact angles of the corresponding GDEs are similar
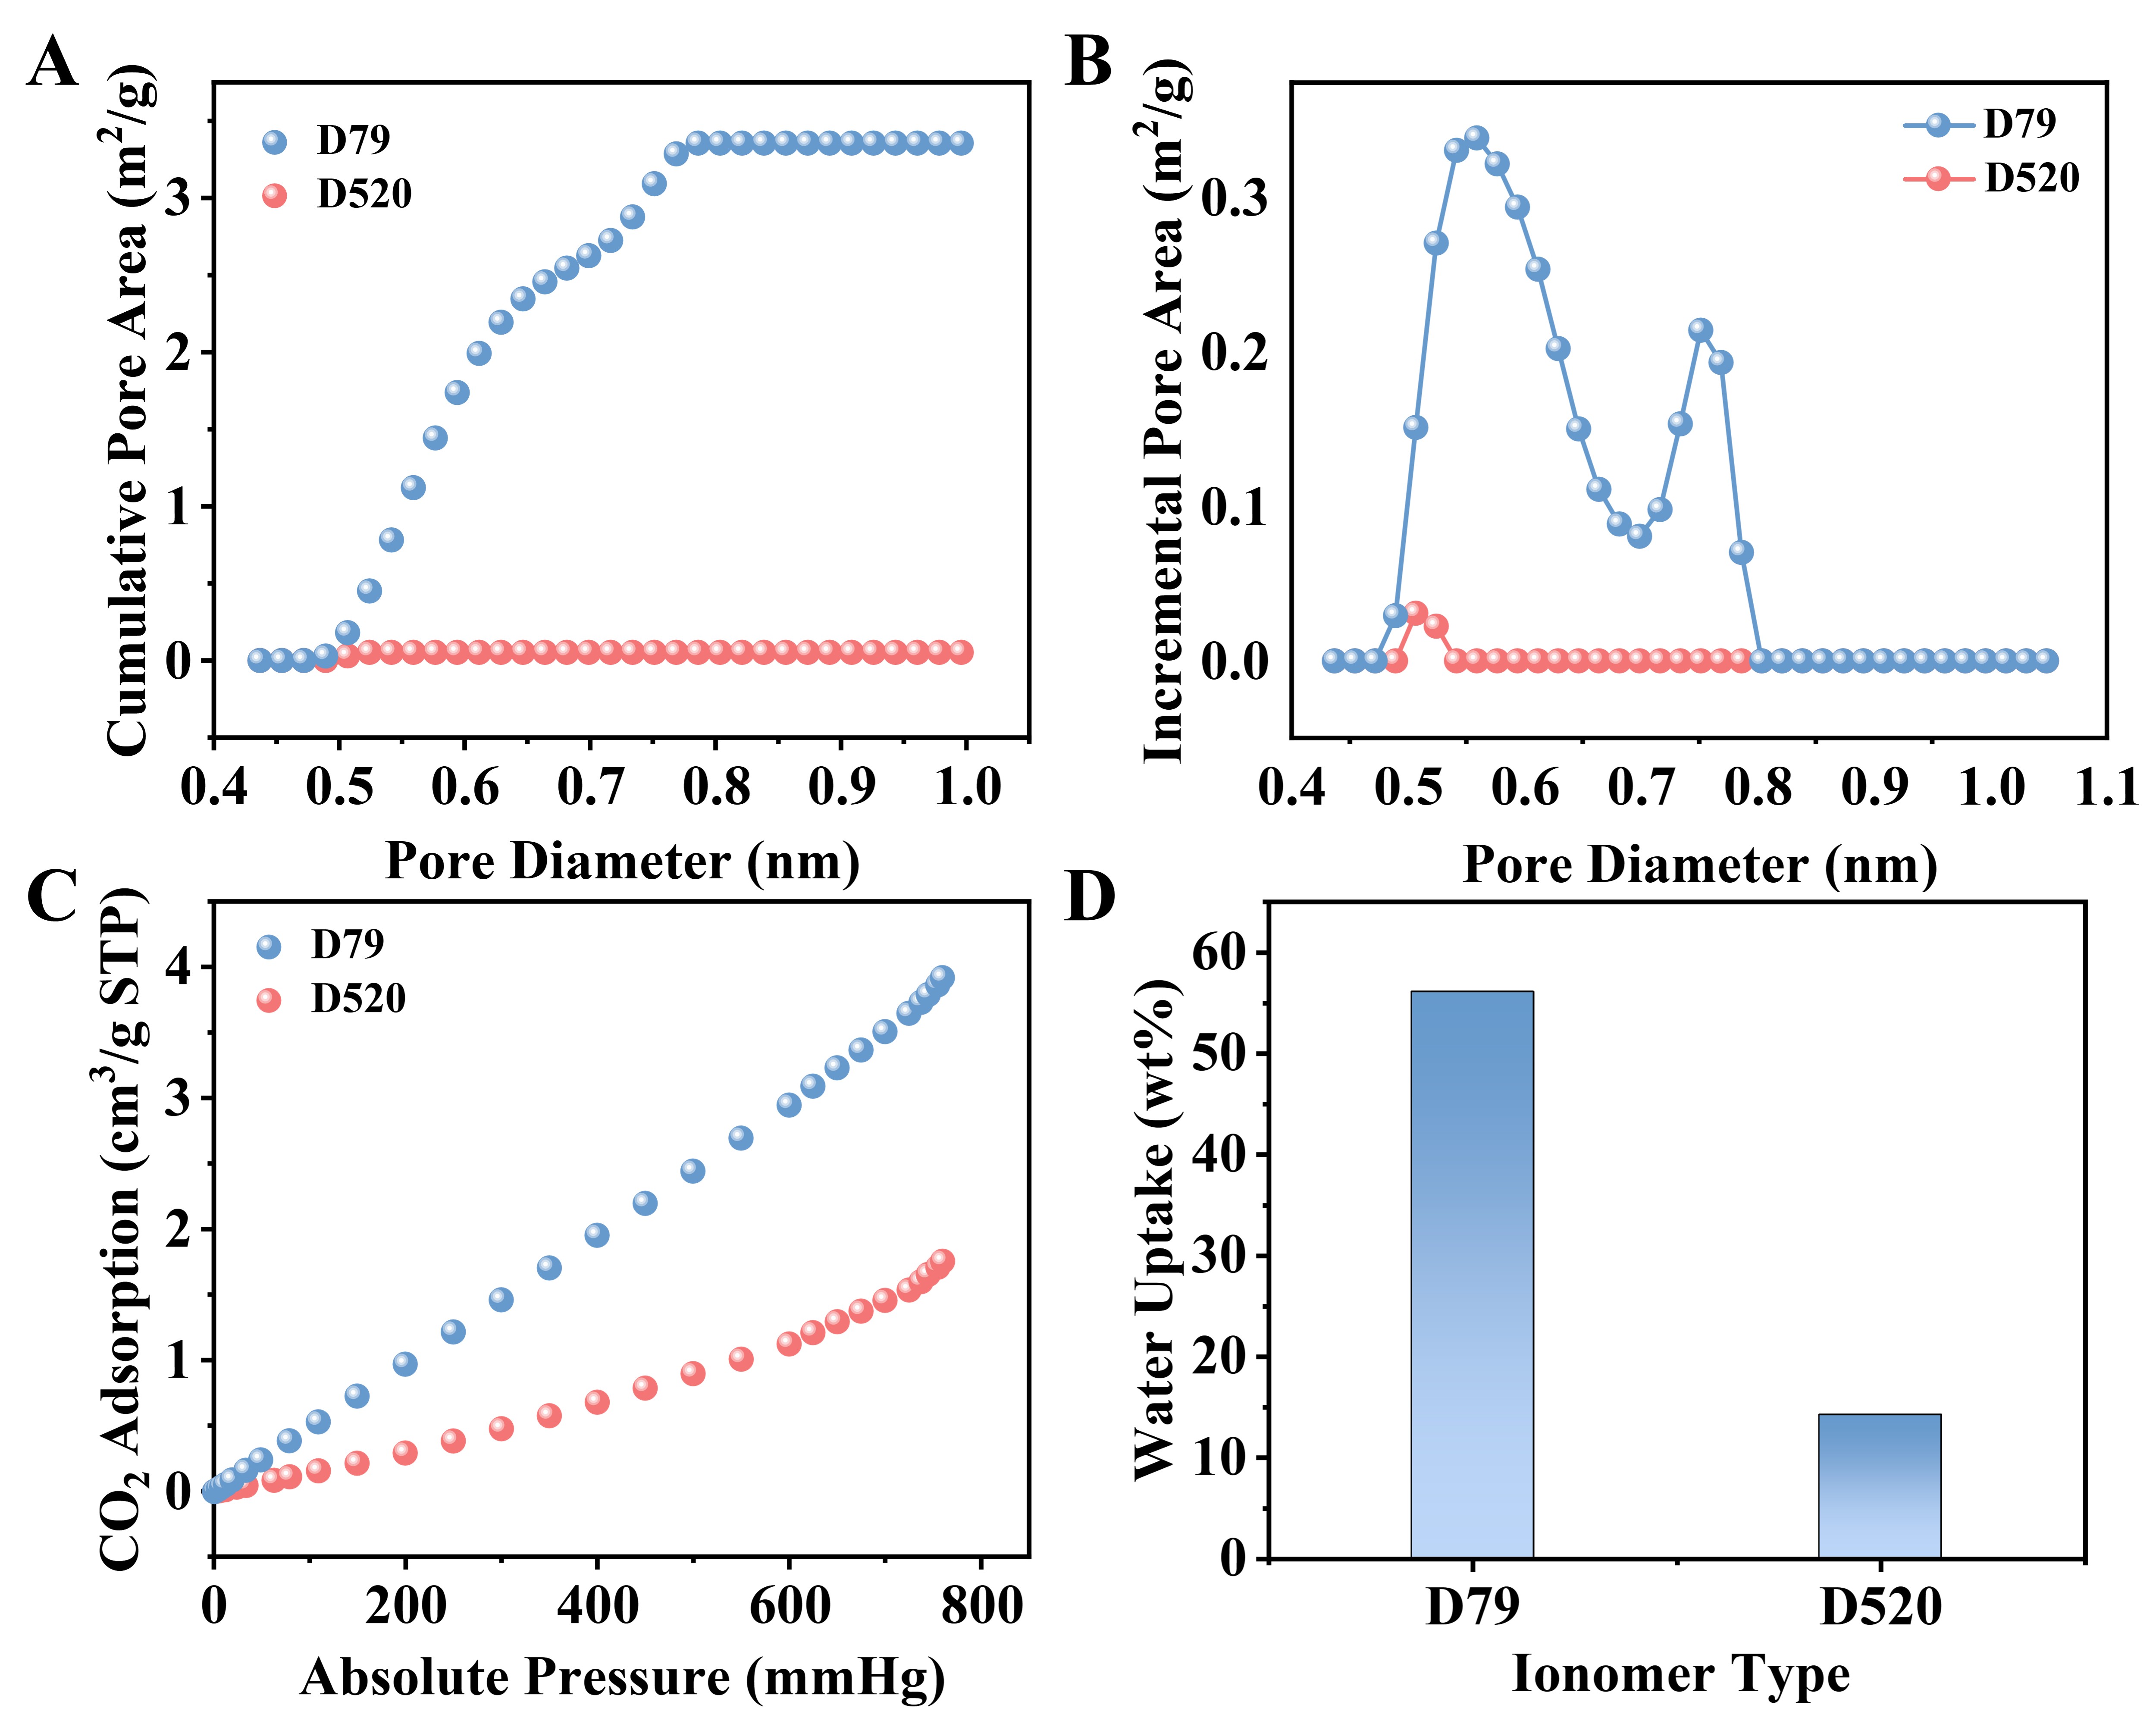
Figure 2. (A) Cumulative pore area, (B) Incremental pore area, (C) CO2 adsorption curves and (D) Water uptake of ionomer membranes (D79 and D520).
CO2 electroreduction performance in MEA electrolyzer
We first evaluated the performance of GDEs modified with SSC ionomers (D72, D79) and LSC ionomers (D520, D521) in the current density range of 100-400 mA cm-2, which covers the typical operating window for acidic CO2RR MEA systems reported in the literature. The results are presented in Figure 3, where both D72 and D79 maintained a CO selectivity of nearly 90% over a current density range of 100-400 mA cm-2 in 0.5 M K2SO4 electrolyte (pH 1, adjusted with H2SO4). At 400 mA cm-2, D79 still achieved a FECO of 88.6%, while the LSC ionomers D520 and D521 exhibited FECO of 69.6% and 59.6%, respectively. The difference in FECO between D521 and D79 approached 30% [Supplementary Figure 7]. Meanwhile, D521 showed an FEH2 of 38.3% at 400 mA cm-2, indicating that the interfacial water structure formed by LSC ionomers fails to suppress water transport near the catalyst under high current densities, leading to a marked enhancement of the competing HER. In addition, the cell voltages of D520 and D521 were generally 0.1-0.2 V higher than those of D72 and D79, which can be attributed to the higher ionic conductivity per unit mass of SSC ionomers. A control GDE containing only PTFE (without any ionomer) was also tested, delivering an FECO of merely 12.9% at 300 mA cm-2. In the absence of hydrophilic sulfonic acid groups to regulate the hydrogen-bonding network near the catalyst, the high proton concentration under acidic conditions directly aggravated HER. Beyond the intrinsic properties of the ionomers, their interaction with the Nafion membrane also plays a critical role in determining the overall MEA performance. Both D79 and D520 are PFSA ionomers based on the same PTFE backbone, which ensures good compatibility at the catalyst layer-membrane interface and minimizes interfacial resistance. However, different side-chain structures result in distinct water uptake and proton conductivity, which can affect the hydration state at the interface. The higher water uptake and proton conductivity of D79 facilitate proton transport from the membrane to the catalyst layer, maintaining a sufficient proton supply for CO2RR under high-current-density operation. At the same time, the dense sulfonic acid groups in D79 create a strongly hydrogen-bonded interfacial water network that suppresses HER from free water, achieving a desirable balance between proton availability and HER suppression. Based on the FE and cell voltage according to Faraday's law, we calculated the CO production rate and energy consumption for both D79-modified and D520-modified GDEs [Supplementary Table 2]. For the D79-modified GDE, the CO production rate increases from 1.81 mmol h-1 cm-2 at 100 mA cm-2 to
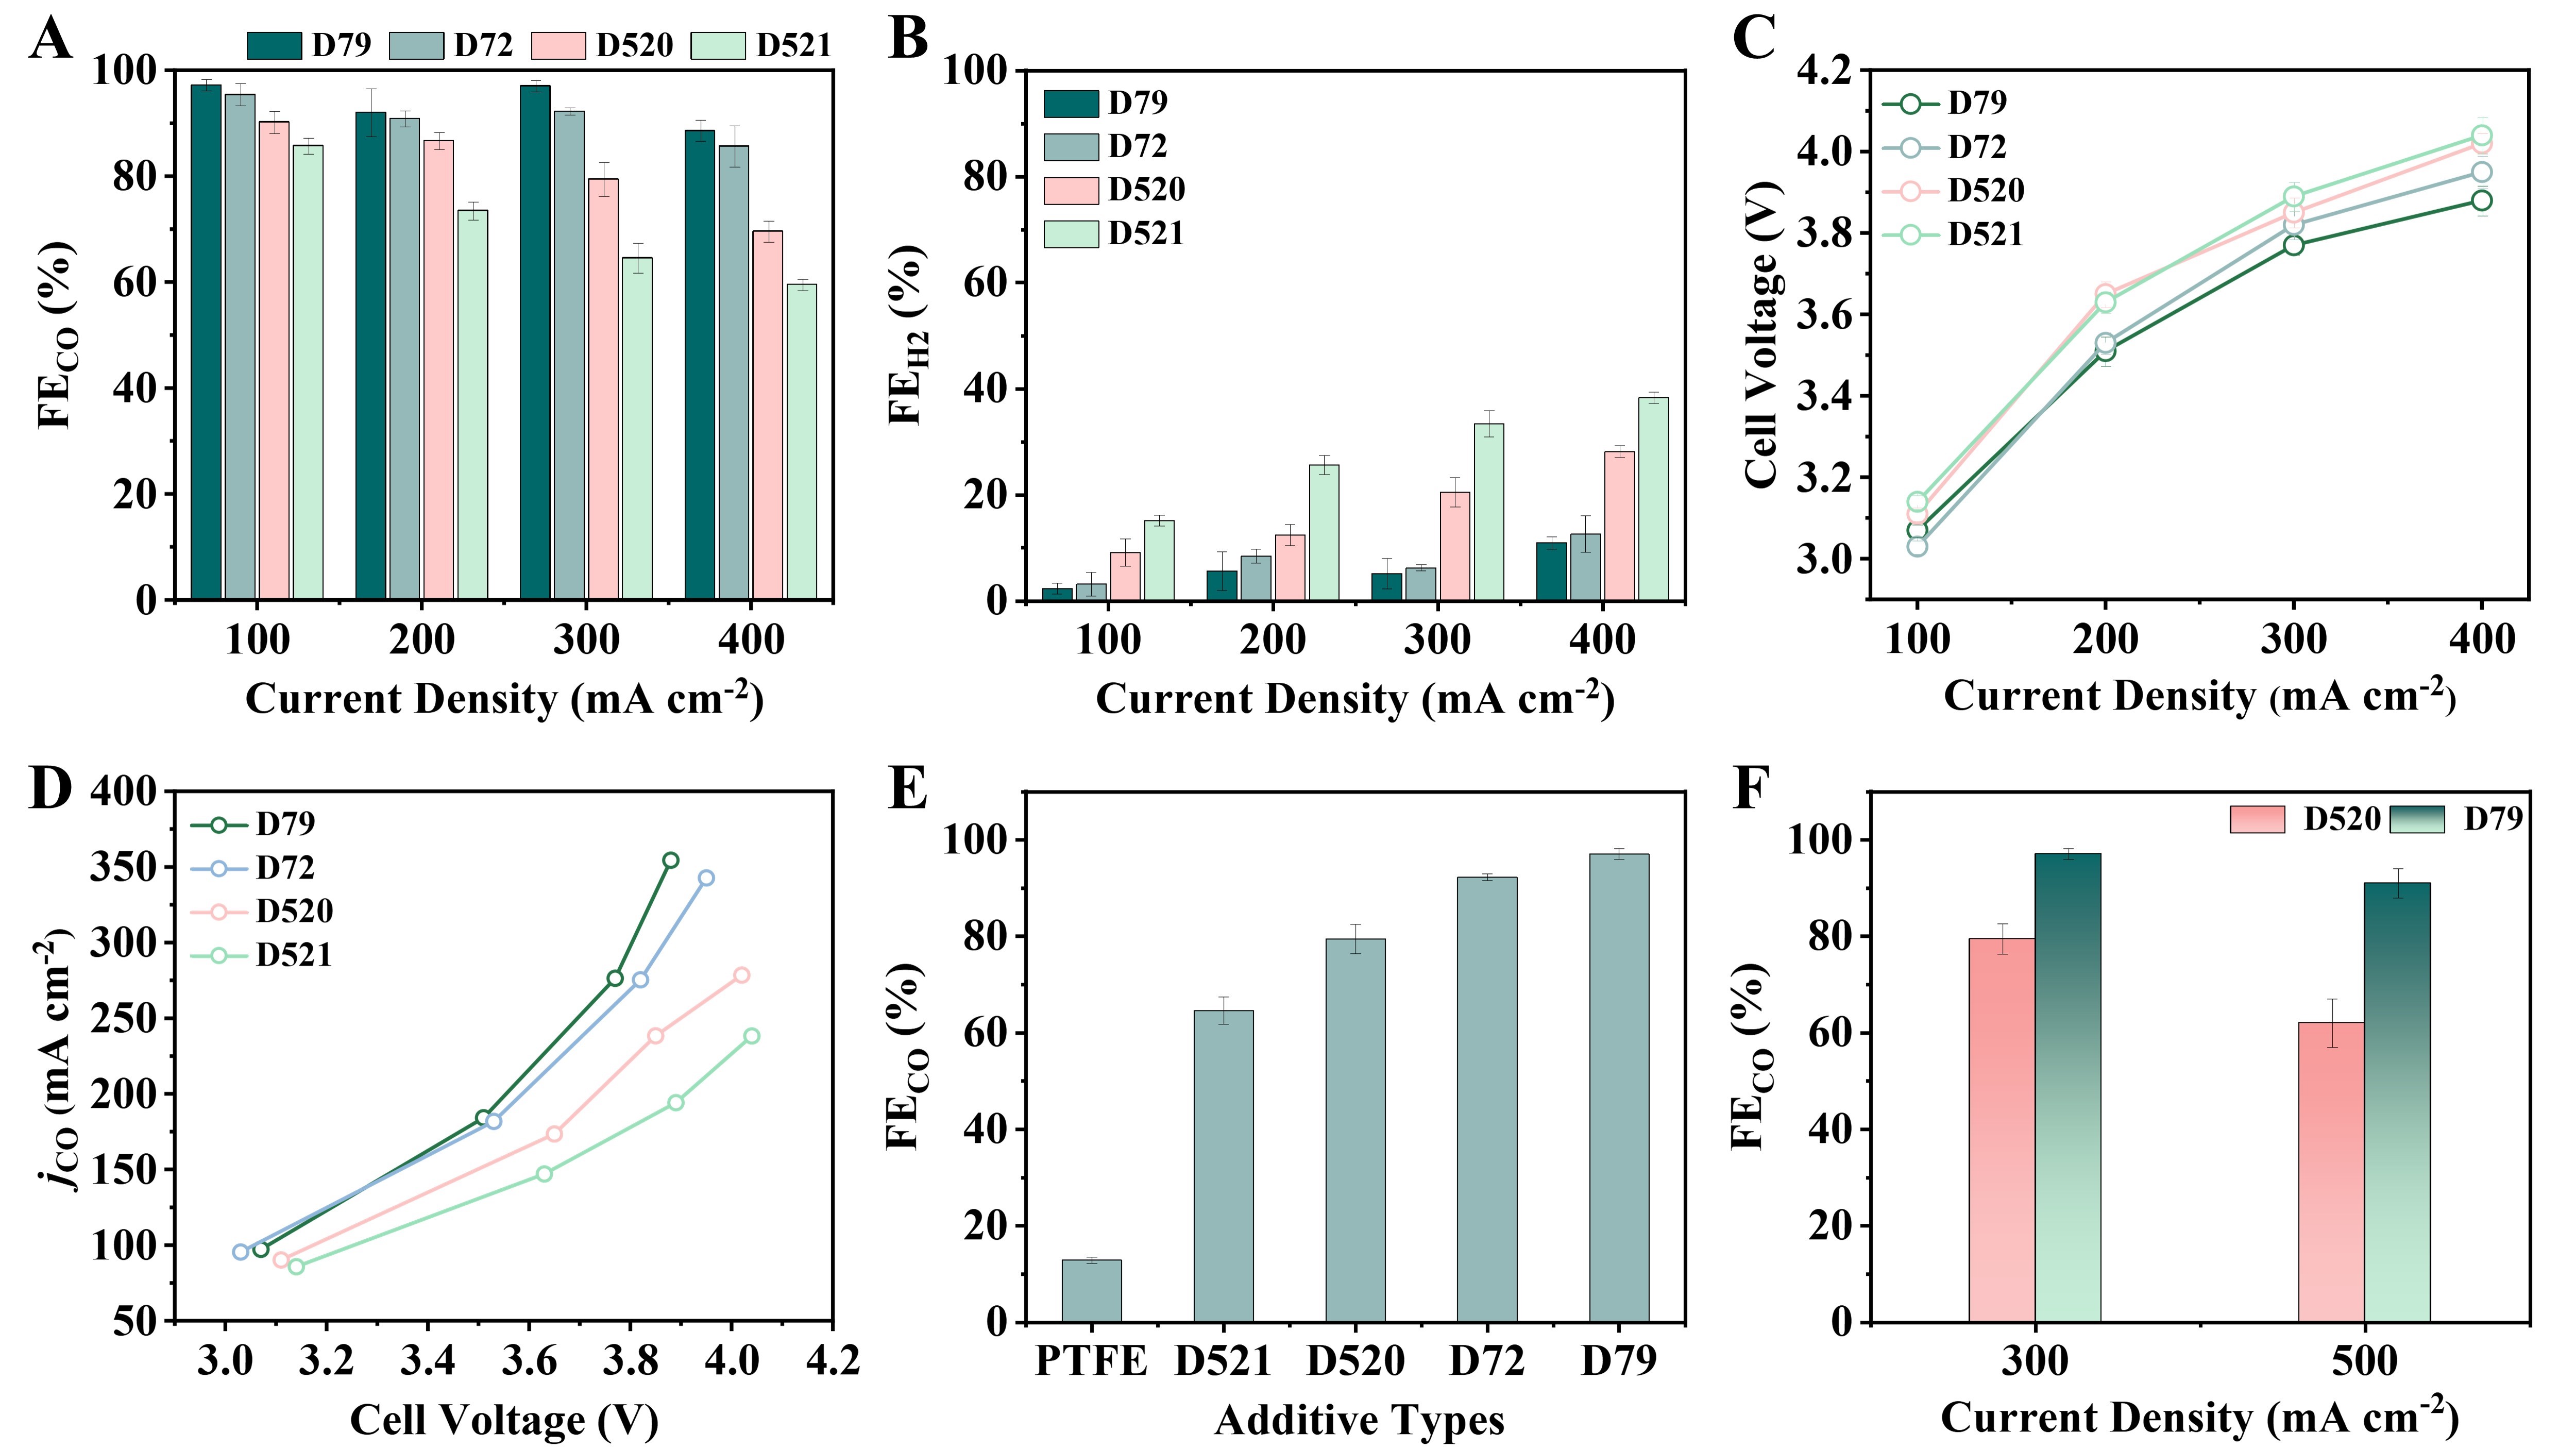
Figure 3. CO2 electroreduction performance of GDEs with different ionomers. (A) FECO, (B) FEH2, (C) Cell voltage, and (D) jCO of GDEs with D72, D79, D520, and D521 at various current densities; (E) FECO of GDEs with different ionomers (D72, D79, D520, D521) at 300 mA cm-2. The bar labeled PTFE represents a control GDE prepared without ionomer, using only PTFE as the binder. (F) FECO of GDEs with D79 and D520 at 500 mA cm-2. All ionomer-to-catalyst ratios were fixed at 20 wt% (I/C = 0.25). Error bars represent the standard deviation from three independent measurements.
In-situ ATR-SEIRAS characterization of the interfacial water structure.
To elucidate the interfacial water structures of SSC and LSC ionomers, in situ ATR-SEIRAS measurements were conducted, with the results presented in Figure 4. The broad feature appearing between 3,000 and
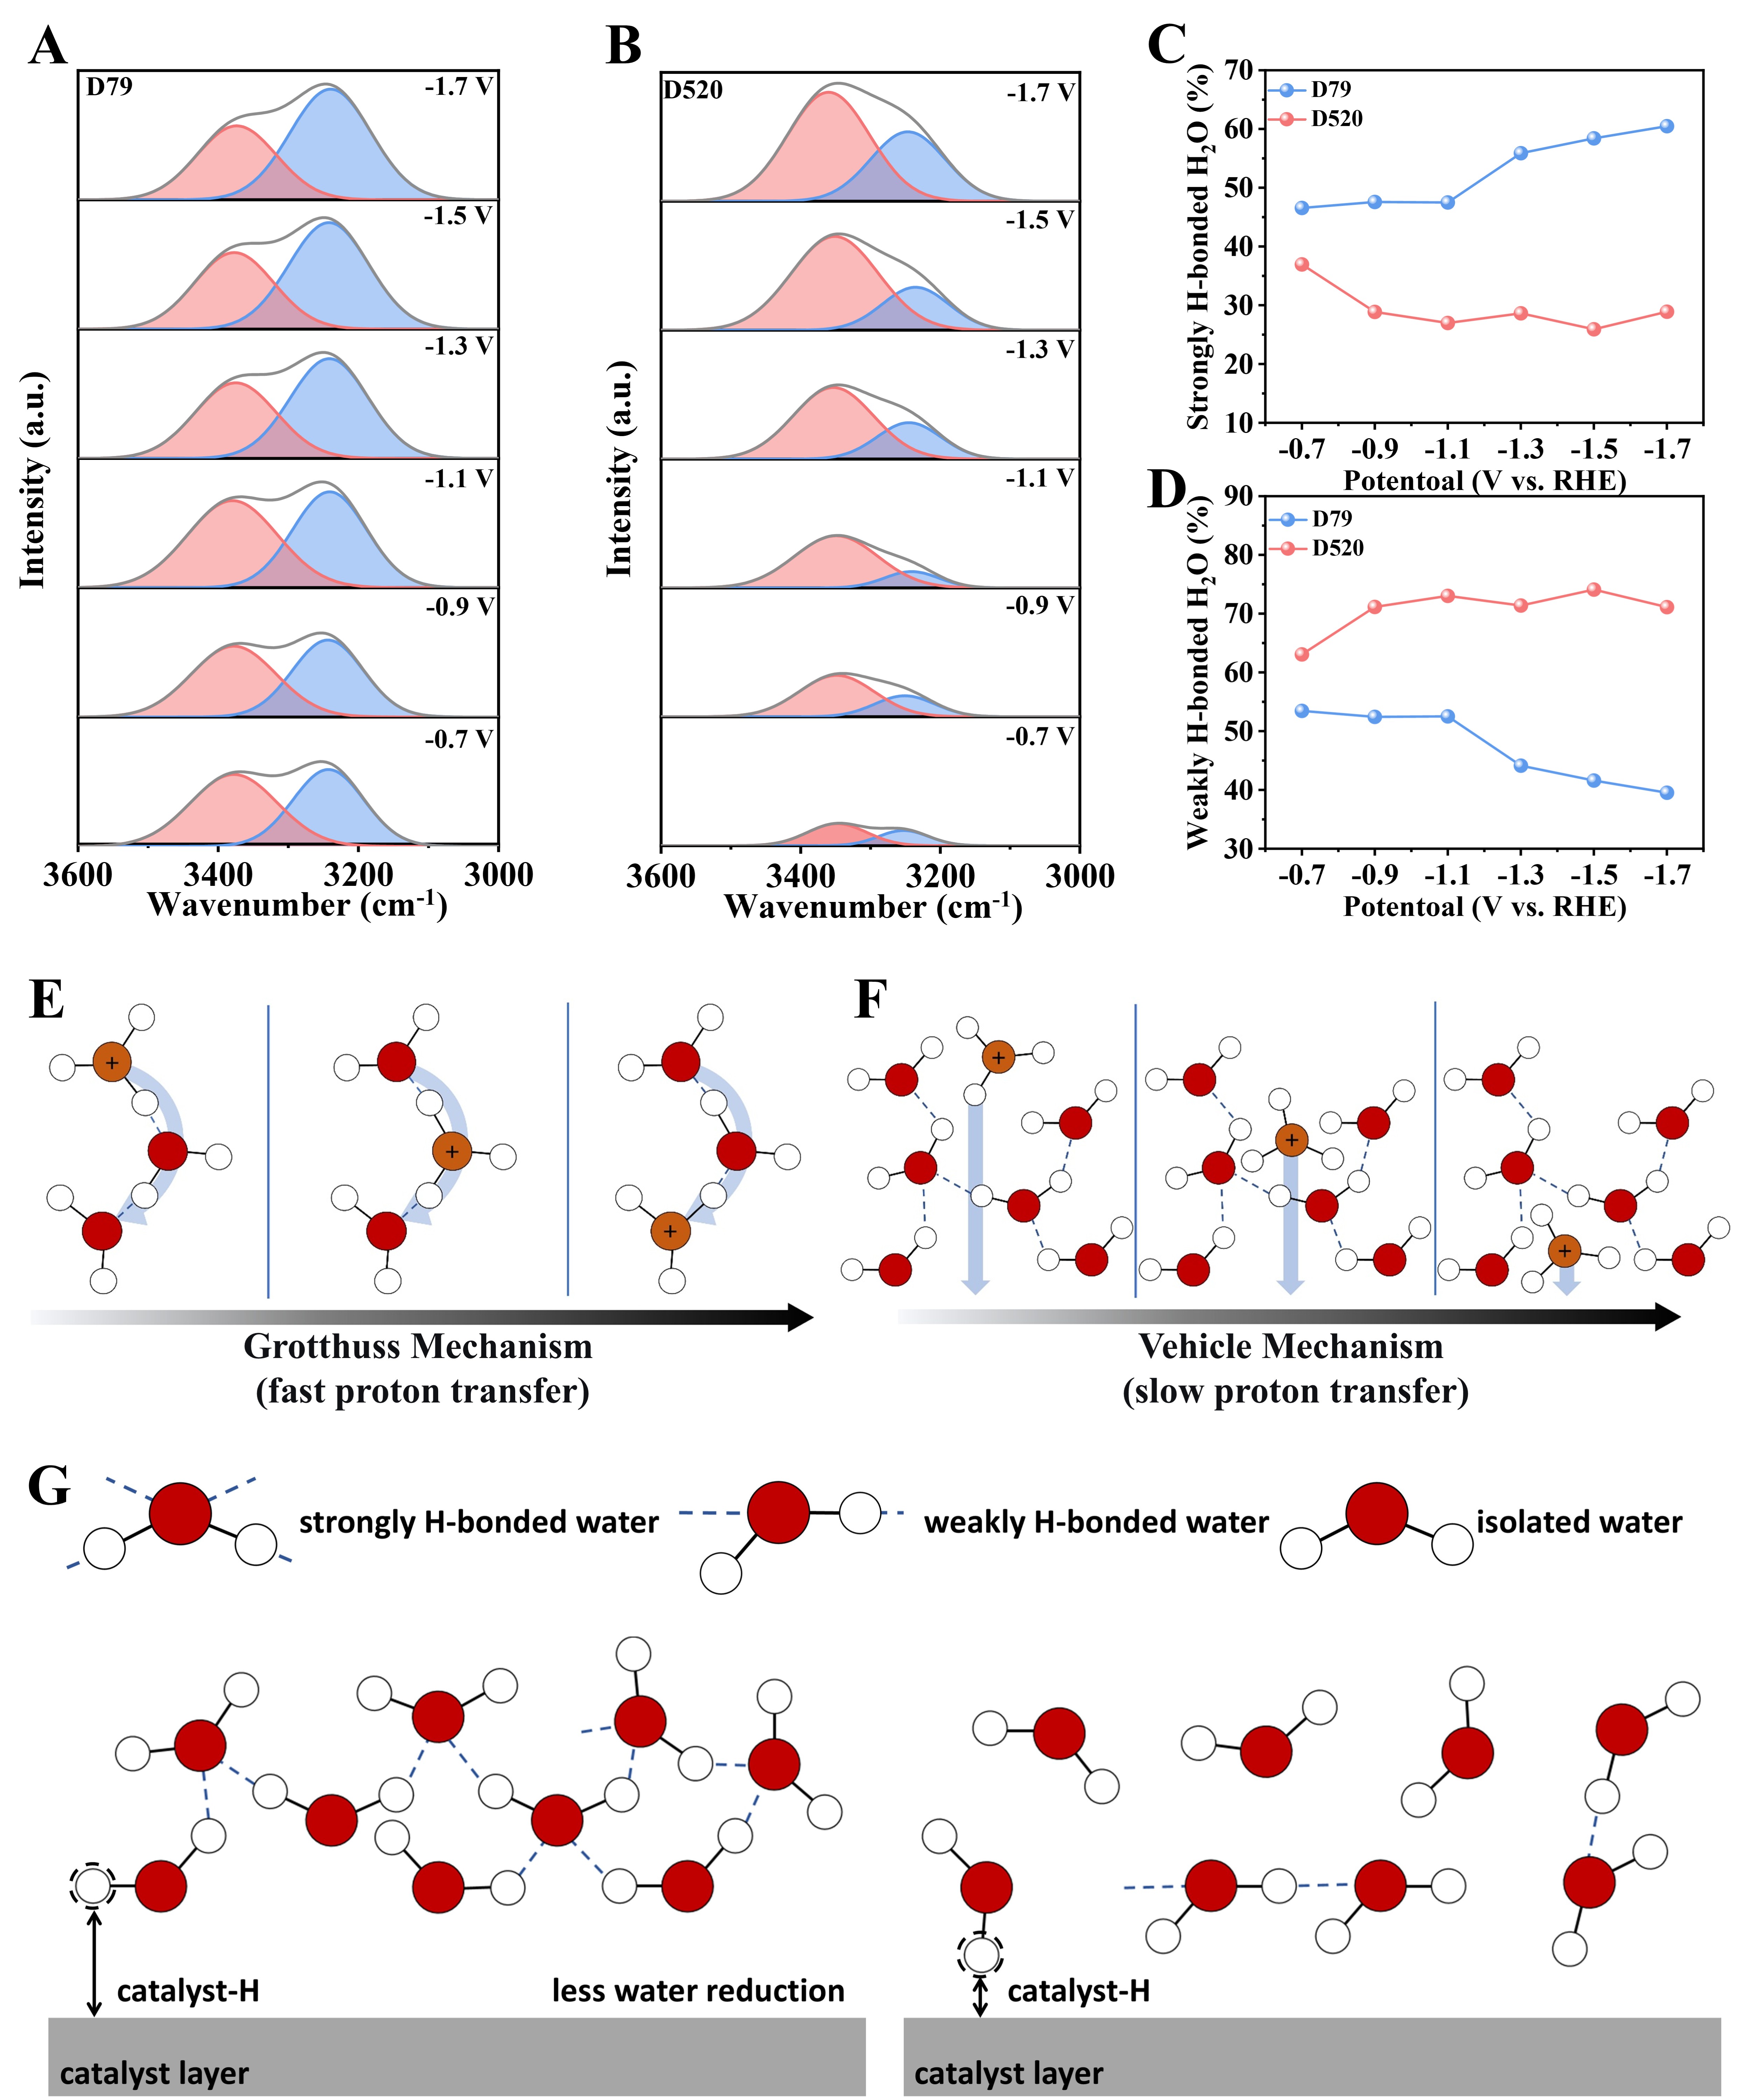
Figure 4. (A and B) Interfacial water structure probed by in-situ ATR-SEIRAS on GDEs with D79 and D520 (The peaks for weakly and strongly hydrogen-bonded water are shown in red and blue, respectively); (C and D) Normalized band intensities at ~3,250 and
Effect of ionomer on mass transfer
The catalyst/ionomer ratio within the catalyst layer significantly influences mass transport processes. An excessively low ionomer ratio exposes a larger active area to the acidic electrolyte, thereby promoting the HER. Conversely, an excessively high ionomer ratio impedes gaseous CO2 transport [Figure 5A]. Moreover, elevated ionomer concentrations facilitate proton transport, thereby reducing CO selectivity. To investigate the impact of local CO2 and proton transport modulated by the ionomer on electrochemical performance, we systematically varied the catalyst/ionomer ratio. The CO2RR performance was evaluated across five different D79 loadings (5, 10, 20, 30, and 40 wt%). Supplementary Figure 10 reveals that the F content rises with increasing ionomer content, confirming that the prepared GDEs possess substantially different ionomer loadings. As shown in Figure 5B and Supplementary Figure 11, CO selectivity and cell voltage exhibited a volcano-type trend as the D79 ratio increased. The optimal performance was achieved at 20 wt% D79, yielding a FECO of 97.1% at 300 mA cm-2. In contrast, at the same current density, the FECO was only 11.8% for the GDE with 5 wt% D79 and decreased from 97.1% to 62.5% when the D79 ratio was increased from 20 wt% to 40 wt%. This is because a high ionomer ratio impedes CO2 diffusion, whereas a low ionomer ratio exacerbates HER by exposing active sites to the acidic environment. To investigate the underlying reasons for this phenomenon, the ECSA of GDEs with varying ionomer ratio was determined using the double-layer capacitance method [Supplementary Figure 12][35,36]. As shown in Figure 5C, the Cdl increased from
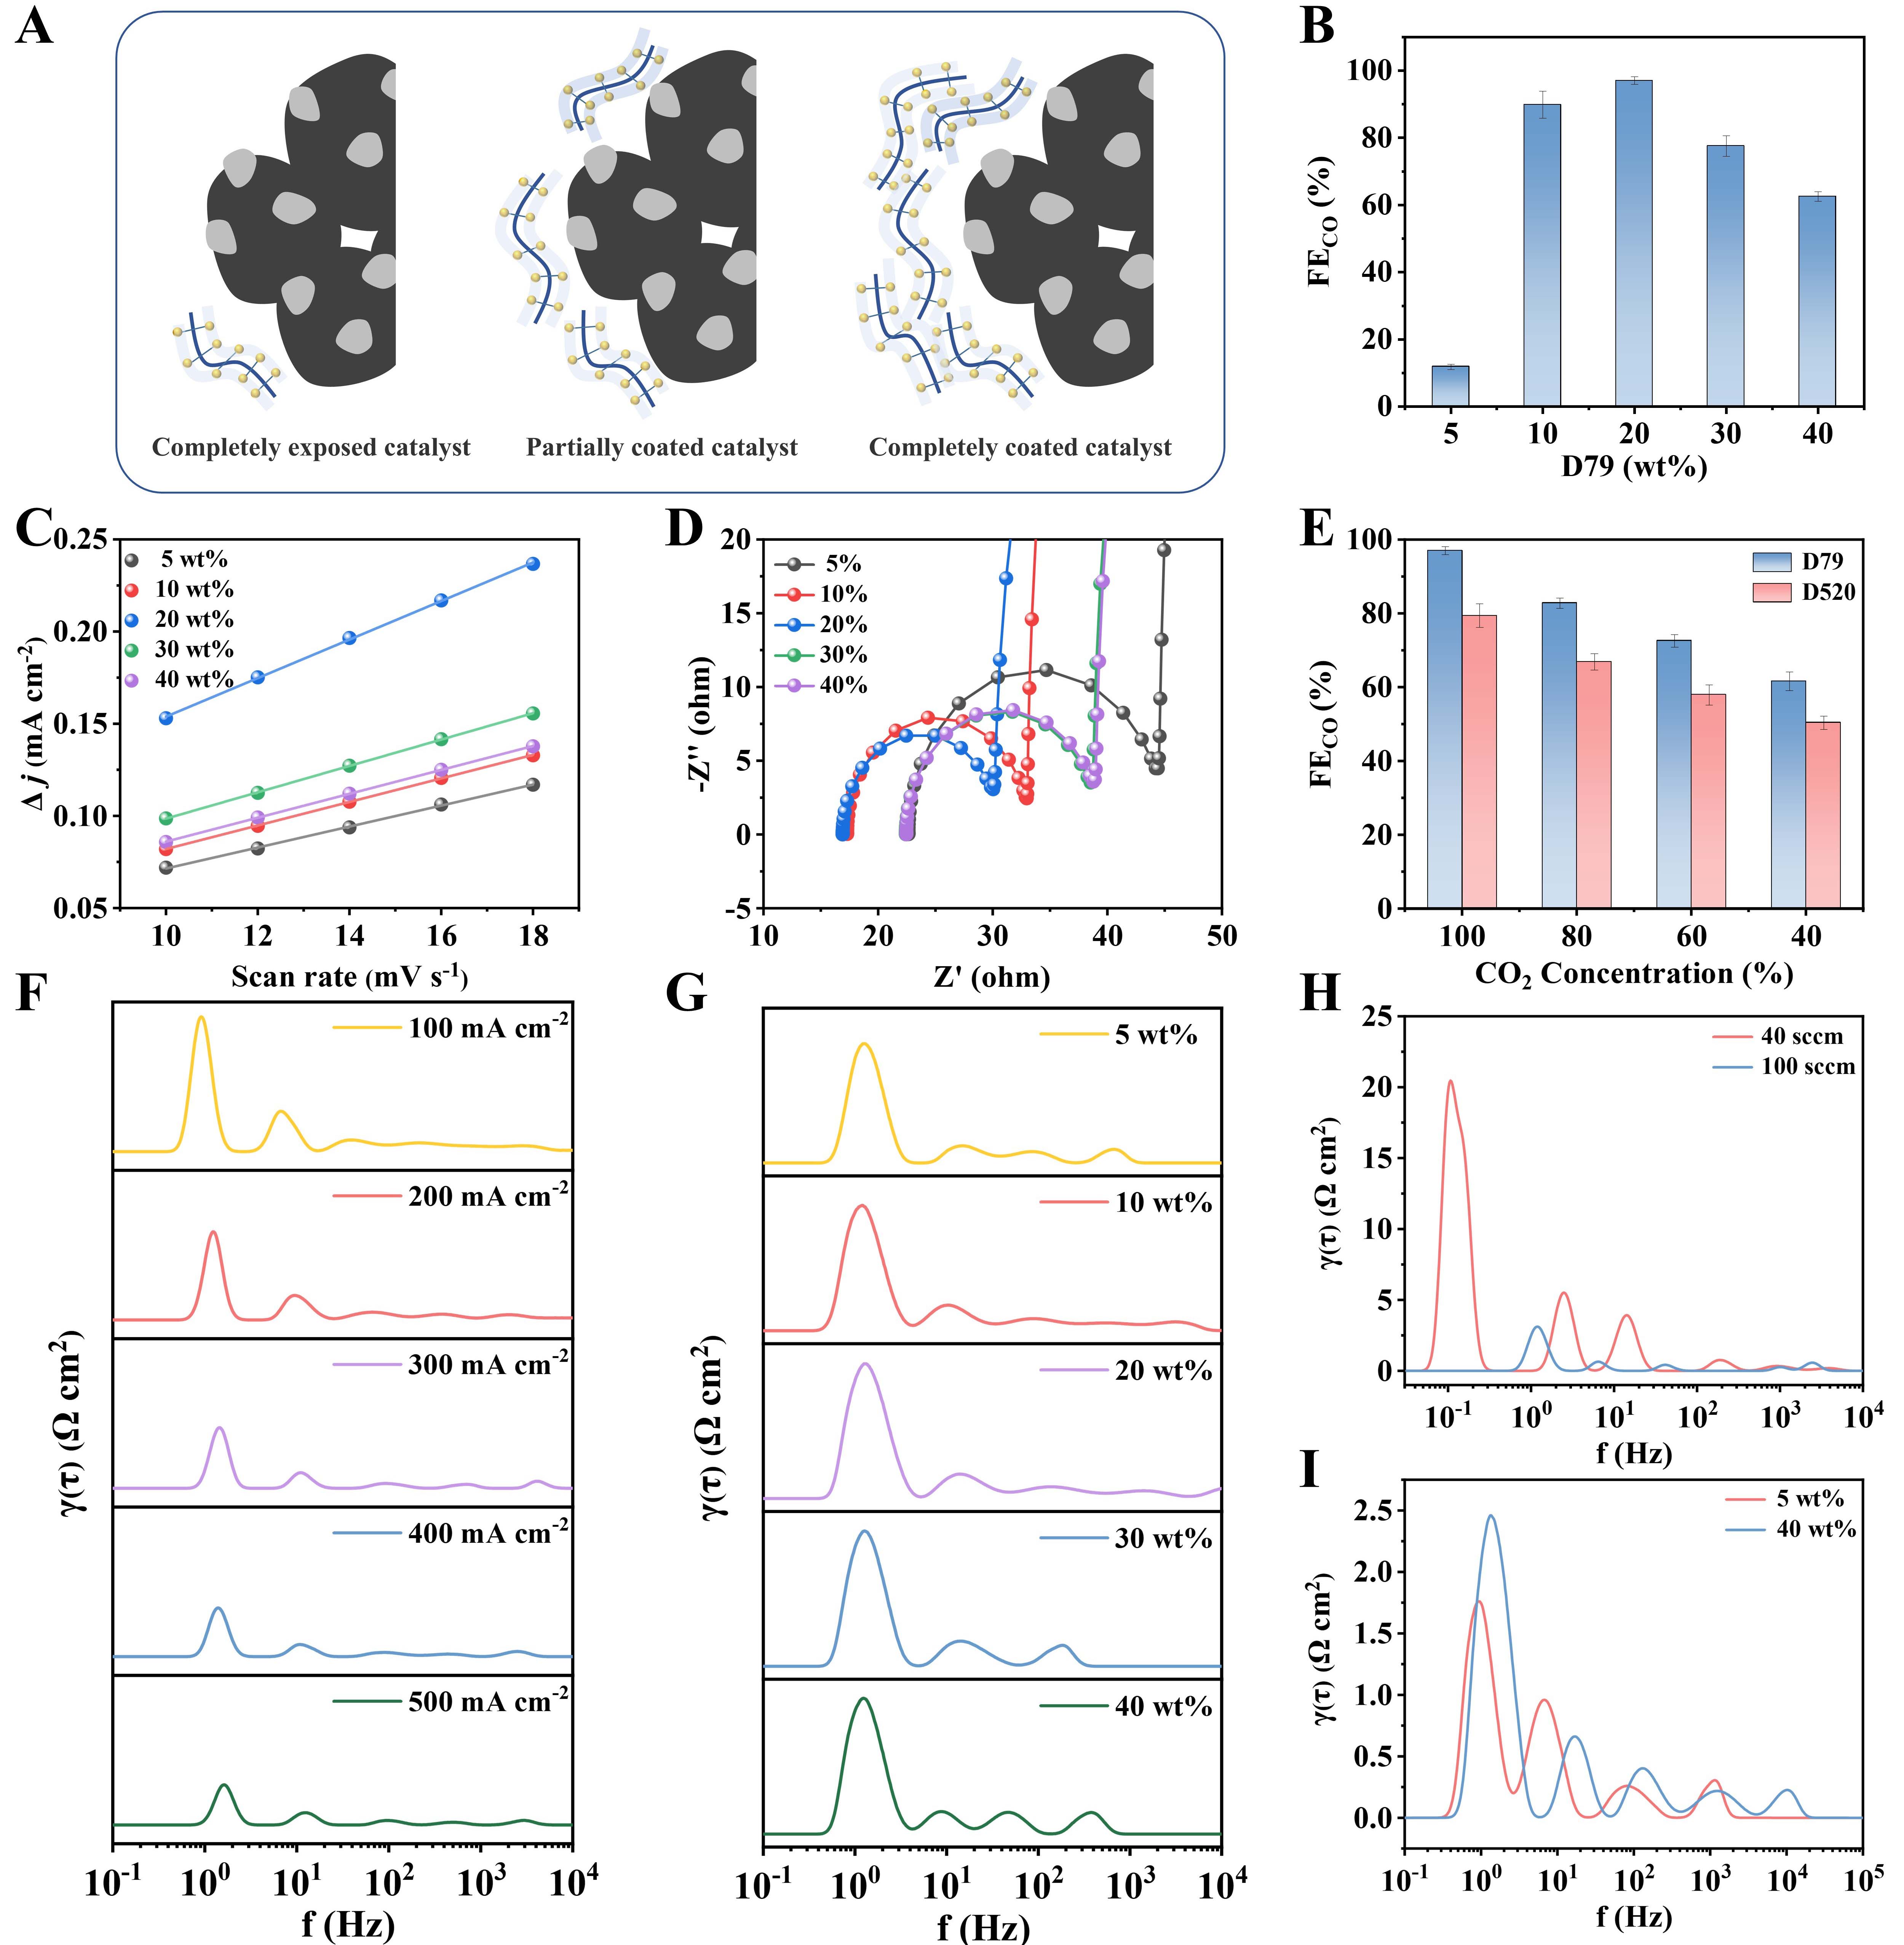
Figure 5. (A) Schematic illustration of the catalyst layer structure with varying ionomer ratio; (B) FECO of GDEs with varying ionomer ratio at 300 mA cm-2; (C) ECSA and (D) EIS of GDEs with varying ionomer ratio; (E) FECO of GDEs with D79 and D520 at different CO2 concentration; (F) DRT plot of GDE with 20 wt% D79 at 100-500 mA cm-2; (G) DRT plot of GDE with varying ionomer ratio at
By converting EIS data from the frequency domain to the time domain, the DRT can effectively resolve multiple processes with close time constants, thereby simplifying the interpretation of EIS results[39,40]. This method has been successfully applied to the diagnostic assessment of various electrochemical systems, including lithium-ion batteries, fuel cells, and water electrolyzers[41,42]. To elucidate the influence of ionomer content on CO2 transport, DRT analysis was conducted[43,44]. On the basis of the characteristic frequency ranges and their responses to variations in ionomer loading, current density, and CO2 partial pressure, the DRT peaks are systematically deconvoluted and assigned as follows: the high-frequency feature (1-10 kHz) is ascribed to ohmic and ionic transport resistance; the mid-frequency feature (10-200 Hz) is attributed to the charge transfer resistance associated with the CO2RR; and the low-frequency feature (1-10 Hz) originates from CO2 mass transport limitations. Figure 5E demonstrates that the FECO declines as the CO2 concentration is reduced, suggesting that CO2 mass transport plays an important role in determining the electrochemical performance. As shown in Figure 5F, as the current density increases from 100 to
CONCLUSIONS
In summary, this study systematically investigated the influence of ionomer side chain on the interfacial microenvironment for CO2RR in an acidic MEA electrolyzer. The SSC ionomer D79, characterized by densely packed sulfonic acid groups, exhibited a substantially higher micropore area (3.36 m2 g-1) than the LSC ionomer D520 (0.053 m2 g-1) and promoted more ordered dipole alignment of water molecules. In situ ATR-SEIRAS revealed that the SSC ionomer facilitates the formation of a strongly hydrogen-bonded interfacial water network (over 60% at -1.7 V vs. RHE), effectively reducing the proton flux and inhibiting water dissociation, thereby suppressing the competitive HER. Consequently, the GDE with D79 maintained a high FECO of 91.1% at 500 mA cm-2, substantially outperforming the LSC-D520 (61.8%). Furthermore, optimization of the ionomer content (20 wt% D79) balanced CO2 transport and reaction kinetics. This work demonstrates that the ionomer side chain effectively regulates the interfacial water hydrogen-bond network and alters the proton transport pathway, offering critical insights into the engineering of microenvironments for acidic CO2RR.
DECLARATIONS
Authors’ contributions
Made substantial contributions to conception and design of the study and performed data acquisition, analysis, and interpretation: Kang, Z.; Zhang, M.; Wang, Y.; Fu, Q.
Provided administrative, technical, and material support: Liao, Q.; Zhu, X
Availability of data and materials
The original contributions presented in this study are included in the article/Supplementary Materials. Further inquiries can be directed to the corresponding authors.
AI and AI-assisted tools statement
Not applicable.
Financial support and sponsorship
The authors highly appreciate the financial support from the National Natural and Science Foundation of China (No. 52394202, 52476056, 52301232) and the Natural Science Foundation of Chongqing Province (2024NSCQ-MSX1109).
Conflicts of interest
All authors declared that there are no conflicts of interest.
Ethical approval and consent to participate
Not applicable.
Consent for publication
Not applicable.
Copyright
© The Author(s) 2026.
Supplementary Materials
REFERENCES
1. Li, L.; Chen, J.; Mosali, V. S. S.; et al. Hydrophobicity graded gas diffusion layer for stable electrochemical reduction of CO2. Angew. Chem. Int. Ed. 2022, 61, e202208534.
2. Nitopi, S.; Bertheussen, E.; Scott, S. B.; et al. Progress and perspectives of electrochemical CO2 reduction on copper in aqueous electrolyte. Chem. Rev. 2019, 119, 7610-72.
3. Luna P, Hahn C, Higgins D, Jaffer SA, Jaramillo TF, Sargent EH. What would it take for renewably powered electrosynthesis to displace petrochemical processes? Science 2019, 364, eaav3506.
4. Jin, J.; Wicks, J.; Min, Q.; et al. Constrained C2 adsorbate orientation enables CO-to-acetate electroreduction. Nature 2023, 617, 724-9.
5. Ha, T. H.; Kim, J.; Choi, H.; Oh, J. Selective zero-gap CO2 reduction in acid. ACS. Energy. Lett. 2024, 9, 4835-42.
6. Wang, X.; Li, P.; Tam, J.; et al. Efficient CO and acrolein co-production via paired electrolysis. Nat. Sustain. 2024, 7, 931-7.
7. Goyal, A.; Marcandalli, G.; Mints, V. A.; Koper, M. T. M. Competition between CO2 reduction and hydrogen evolution on a gold electrode under well-defined mass transport conditions. J. Am. Chem. Soc. 2020, 142, 4154-61.
8. Xie, Y.; Ou, P.; Wang, X.; et al. High carbon utilization in CO2 reduction to multi-carbon products in acidic media. Nat. Catal. 2022, 5, 564-70.
9. Monteiro, M. C. O.; Philips, M. F.; Schouten, K. J. P.; Koper, M. T. M. Efficiency and selectivity of CO2 reduction to CO on gold gas diffusion electrodes in acidic media. Nat. Commun. 2021, 12, 4943.
10. Wu, W.; Wang, Y. The role of protons in CO2 reduction on gold under acidic conditions. J. Am. Chem. Soc. 2025, 147, 11662-6.
11. Song, Y.; Musgrave, C. B.; Su, J.; et al. Efficient CO2-to-methanol electrocatalysis in acidic media via microenvironment-tuned cobalt phthalocyanine. Nat. Nanotechnol. 2025, 21, 78-86.
12. Zhu, Y.; Tian, P.; Jiang, H.; et al. Synergistic effect of platinum single atoms and nanoclusters boosting electrocatalytic hydrogen evolution. CCS. Chem. 2021, 3, 2539-47.
13. Cheng, Y.; Li, Q.; Salaman, M. I. B.; et al. Microenvironment tailoring for electrocatalytic CO2 reduction: effects of interfacial structure on controlling activity and selectivity. J. Am. Chem. Soc. 2025, 147, 12438-48.
14. Xu, Z.; Zhang, X.; Wang, Q. In situ spectroscopy study of PrO1.83/CuO interface in CO2 electroreduction: microenvironment regulation and enhancement mechanism. Appl. Catal. B. Environ. Energy. 2026, 385, 126261.
15. Zhang, Z.; Wang, T.; Cai, Y.; et al. Probing electrolyte effects on cation-enhanced CO2 reduction on copper in acidic media. Nat. Catal. 2024, 7, 807-17.
16. Fan, J.; Pan, B.; Wu, J.; et al. Immobilized tetraalkylammonium cations enable metal-free CO2 electroreduction in acid and pure water. Angew. Chem. Int. Ed. 2024, 63, e202317828.
17. Li, G.; Huang, L.; Wei, C.; et al. Backbone engineering of polymeric catalysts for high-performance CO2 reduction in bipolar membrane zero-gap electrolyzer. Angew. Chem. Int. Ed. 2024, 136, e202400414.
18. Wu, B.; Wang, B.; Cai, B.; et al. A solid-state electrolyte facilitates acidic CO2 electrolysis without alkali metal cations by regulating proton transport. J. Am. Chem. Soc. 2024, 146, 29801-9.
19. Xing, M.; Zhang, H.; Kang, Z.; Zhang, M.; Zhu, X.; Fu, Q. High-performance CO2 electrolysis in membrane electrode assemblies: the role of non-alkali cations. Chem. Sci. 2026, Online ahead of print.
20. Yang, Y.; Wang, J.; Shi, Y.; et al. Decoupling product selectivity in electrocatalytic CO2 reduction by steering the interfacial water structure. J. Am. Chem. Soc. 2026, 148, 11284-95.
21. Mi, Z.; Wang, T.; Xiao, L.; Wang, G.; Zhuang, L. Catalytic peculiarity of alkali metal cation-free electrode/polyelectrolyte interfaces toward CO2 reduction. J. Am. Chem. Soc. 2024, 146, 17377-83.
22. Krivina, R. A.; Lindquist, G. A.; Yang, M. C.; et al. Three-electrode study of electrochemical ionomer degradation relevant to anion-exchange-membrane water electrolyzers. ACS. Appl. Mater. Interfaces. 2022, 14, 18261-74.
23. Liang, Z.; Chen, W.; Liu, J.; et al. FT-IR study of the microstructure of Nafion® membrane. J. Membr. Sci. 2004, 233, 39-44.
24. Bard, A. J.; Faulkner, L. R.; White, H. S. Electrochemical methods: fundamentals and applications, 3rd Edition. John Wiley & Sons; 2022. Available from: https://www.wiley.com/en-cn/shop/general-chemistry/electrochemical-methods-fundamentals-and-applications-3rd-edition-p-9781119334057 [Last accessed on 30 Jul 2026].
25. Sun, J.; Wu, B.; Wang, Z.; et al. Rational catalyst layer design enables tailored transport channels for efficient CO2 electrochemical reduction to multi-carbon products. Energy. Environ. Sci. 2025, 18, 1027-37.
26. Zhao, C.; Wang, Y.; Li, Z.; et al. Solid-diffusion synthesis of single-atom catalysts directly from bulk metal for efficient CO2 reduction. Joule 2019, 3, 584-94.
27. Zhang, Q.; Tan, X.; Bedford, N. M.; et al. Direct insights into the role of epoxy groups on cobalt sites for acidic H2O2 production. Nat. Commun. 2020, 11, 4181.
28. Ponomar, M. A.; Kislyi, A. G.; Kozmai, A. E.; et al. Characterization and process-structure-properties modeling of ion-exchange membranes of Aquivion®-type based on perfluorosulphonic acid ionomer with short side chains. Int. J. Hydrogen. Energy. 2025, 115, 170-85.
29. Schaefer, J.; Backus, E. H. G.; Nagata, Y.; Bonn, M. Both inter- and intramolecular coupling of O-H groups determine the vibrational response of the water/air interface. J. Phys. Chem. Lett. 2016, 7, 4591-5.
30. Rao, R. R.; Huang, B.; Katayama, Y.; et al. pH- and cation-dependent water oxidation on rutile RuO2(110). J. Phys. Chem. C. 2021, 125, 8195-207.
31. Despa, F.; Fernández, A.; Berry, R. S. Dielectric modulation of biological water. Phys. Rev. Lett. 2004, 93, 228104.
32. Kharod, R. A.; Andrews, J. L.; Dincă, M. Teaching metal-organic frameworks to conduct: ion and electron transport in metal-organic frameworks. Ann. Rev. Mater. Res. 2022, 52, 103-28.
33. Li, C.; Le, J.; Wang, Y.; et al. In situ probing electrified interfacial water structures at atomically flat surfaces. Nat. Mater. 2019, 18, 697-701.
34. Wang, Y.; Zhang, J.; Zhao, J.; et al. Strong hydrogen-bonded interfacial water inhibiting hydrogen evolution kinetics to promote electrochemical CO2 reduction to C2+. ACS. Catal. 2024, 14, 3457-65.
35. Xing, Z.; Hu, L.; Ripatti, D. S.; Hu, X.; Feng, X. Enhancing carbon dioxide gas-diffusion electrolysis by creating a hydrophobic catalyst microenvironment. Nat. Commun. 2021, 12, 136.
36. Kwon, W.; Kim, J.; Rhee, S. A new equivalent circuit model for porous carbon electrodes in charge transfer reaction of iodide/triiodide redox couples. Electrochim. Acta. 2012, 68, 110-3.
37. Rezaei Niya, S. M.; Hoorfar, M. Study of proton exchange membrane fuel cells using electrochemical impedance spectroscopy technique - A review. J. Power. Sources. 2013, 240, 281-93.
38. Garcia-navarro, J.; Schulze, M.; Friedrich, K. Measuring and modeling mass transport losses in proton exchange membrane water electrolyzers using electrochemical impedance spectroscopy. J. Power. Sources. 2019, 431, 189-204.
39. Li, Y.; Jiang, Y.; Dang, J.; et al. Application of distribution of relaxation times method in polymer electrolyte membrane water electrolyzer. Chem. Eng. J. 2023, 451, 138327.
40. Schmidt, J. P.; Berg, P.; Schönleber, M.; Weber, A.; Ivers-Tiffée, E. The distribution of relaxation times as basis for generalized time-domain models for Li-ion batteries. J. Power. Sources. 2013, 221, 70-7.
41. Iurilli, P.; Brivio, C.; Wood, V. Detection of lithium-ion cells’ degradation through deconvolution of electrochemical impedance spectroscopy with distribution of relaxation time. Energy. Technol. 2022, 10, 2200547.
42. Giesbrecht, P. K.; Freund, M. S. Investigation of water oxidation at IrO2 electrodes in nafion-based membrane electrode assemblies using impedance spectroscopy and distribution of relaxation times analysis. J. Phys. Chem. C. 2022, 126, 17844-61.
43. Chen, L.; Chen, J.; Chen, J.; Xi, S.; Stewart, J.; Wang, L. Operando interfacial diagnosis in MEA reactors for energy-efficient CO reduction at high rate. Joule 2026, 10, 102361.
44. Chen, Q.; Kube, A.; Kopljar, D.; Friedrich, K. A. Advanced impedance analysis for performance degradation during low-temperature CO2 electroreduction. ACS. Energy. Lett. 2024, 9, 6096-103.
Cite This Article
 Open Access
How to Cite
Download Citation
Export Citation File:
Type of Import
Tips on Downloading Citation
Citation Manager File Format
Type of Import
Direct Import: When the Direct Import option is selected (the default state), a dialogue box will give you the option to Save or Open the downloaded citation data. Choosing Open will either launch your citation manager or give you a choice of applications with which to use the metadata. The Save option saves the file locally for later use.
Indirect Import: When the Indirect Import option is selected, the metadata is displayed and may be copied and pasted as needed.
About This Article
Special Topic
Copyright

Data & Comments
Data
0











Comments
Comments must be written in English. Spam, offensive content, impersonation, and private information will not be permitted. If any comment is reported and identified as inappropriate content by OAE staff, the comment will be removed without notice. If you have any queries or need any help, please contact us at [email protected].