

Bisphenol analogues in soils from four circular economy E-waste dismantling parks: emission characteristics and health risks
 0
0 Abstract
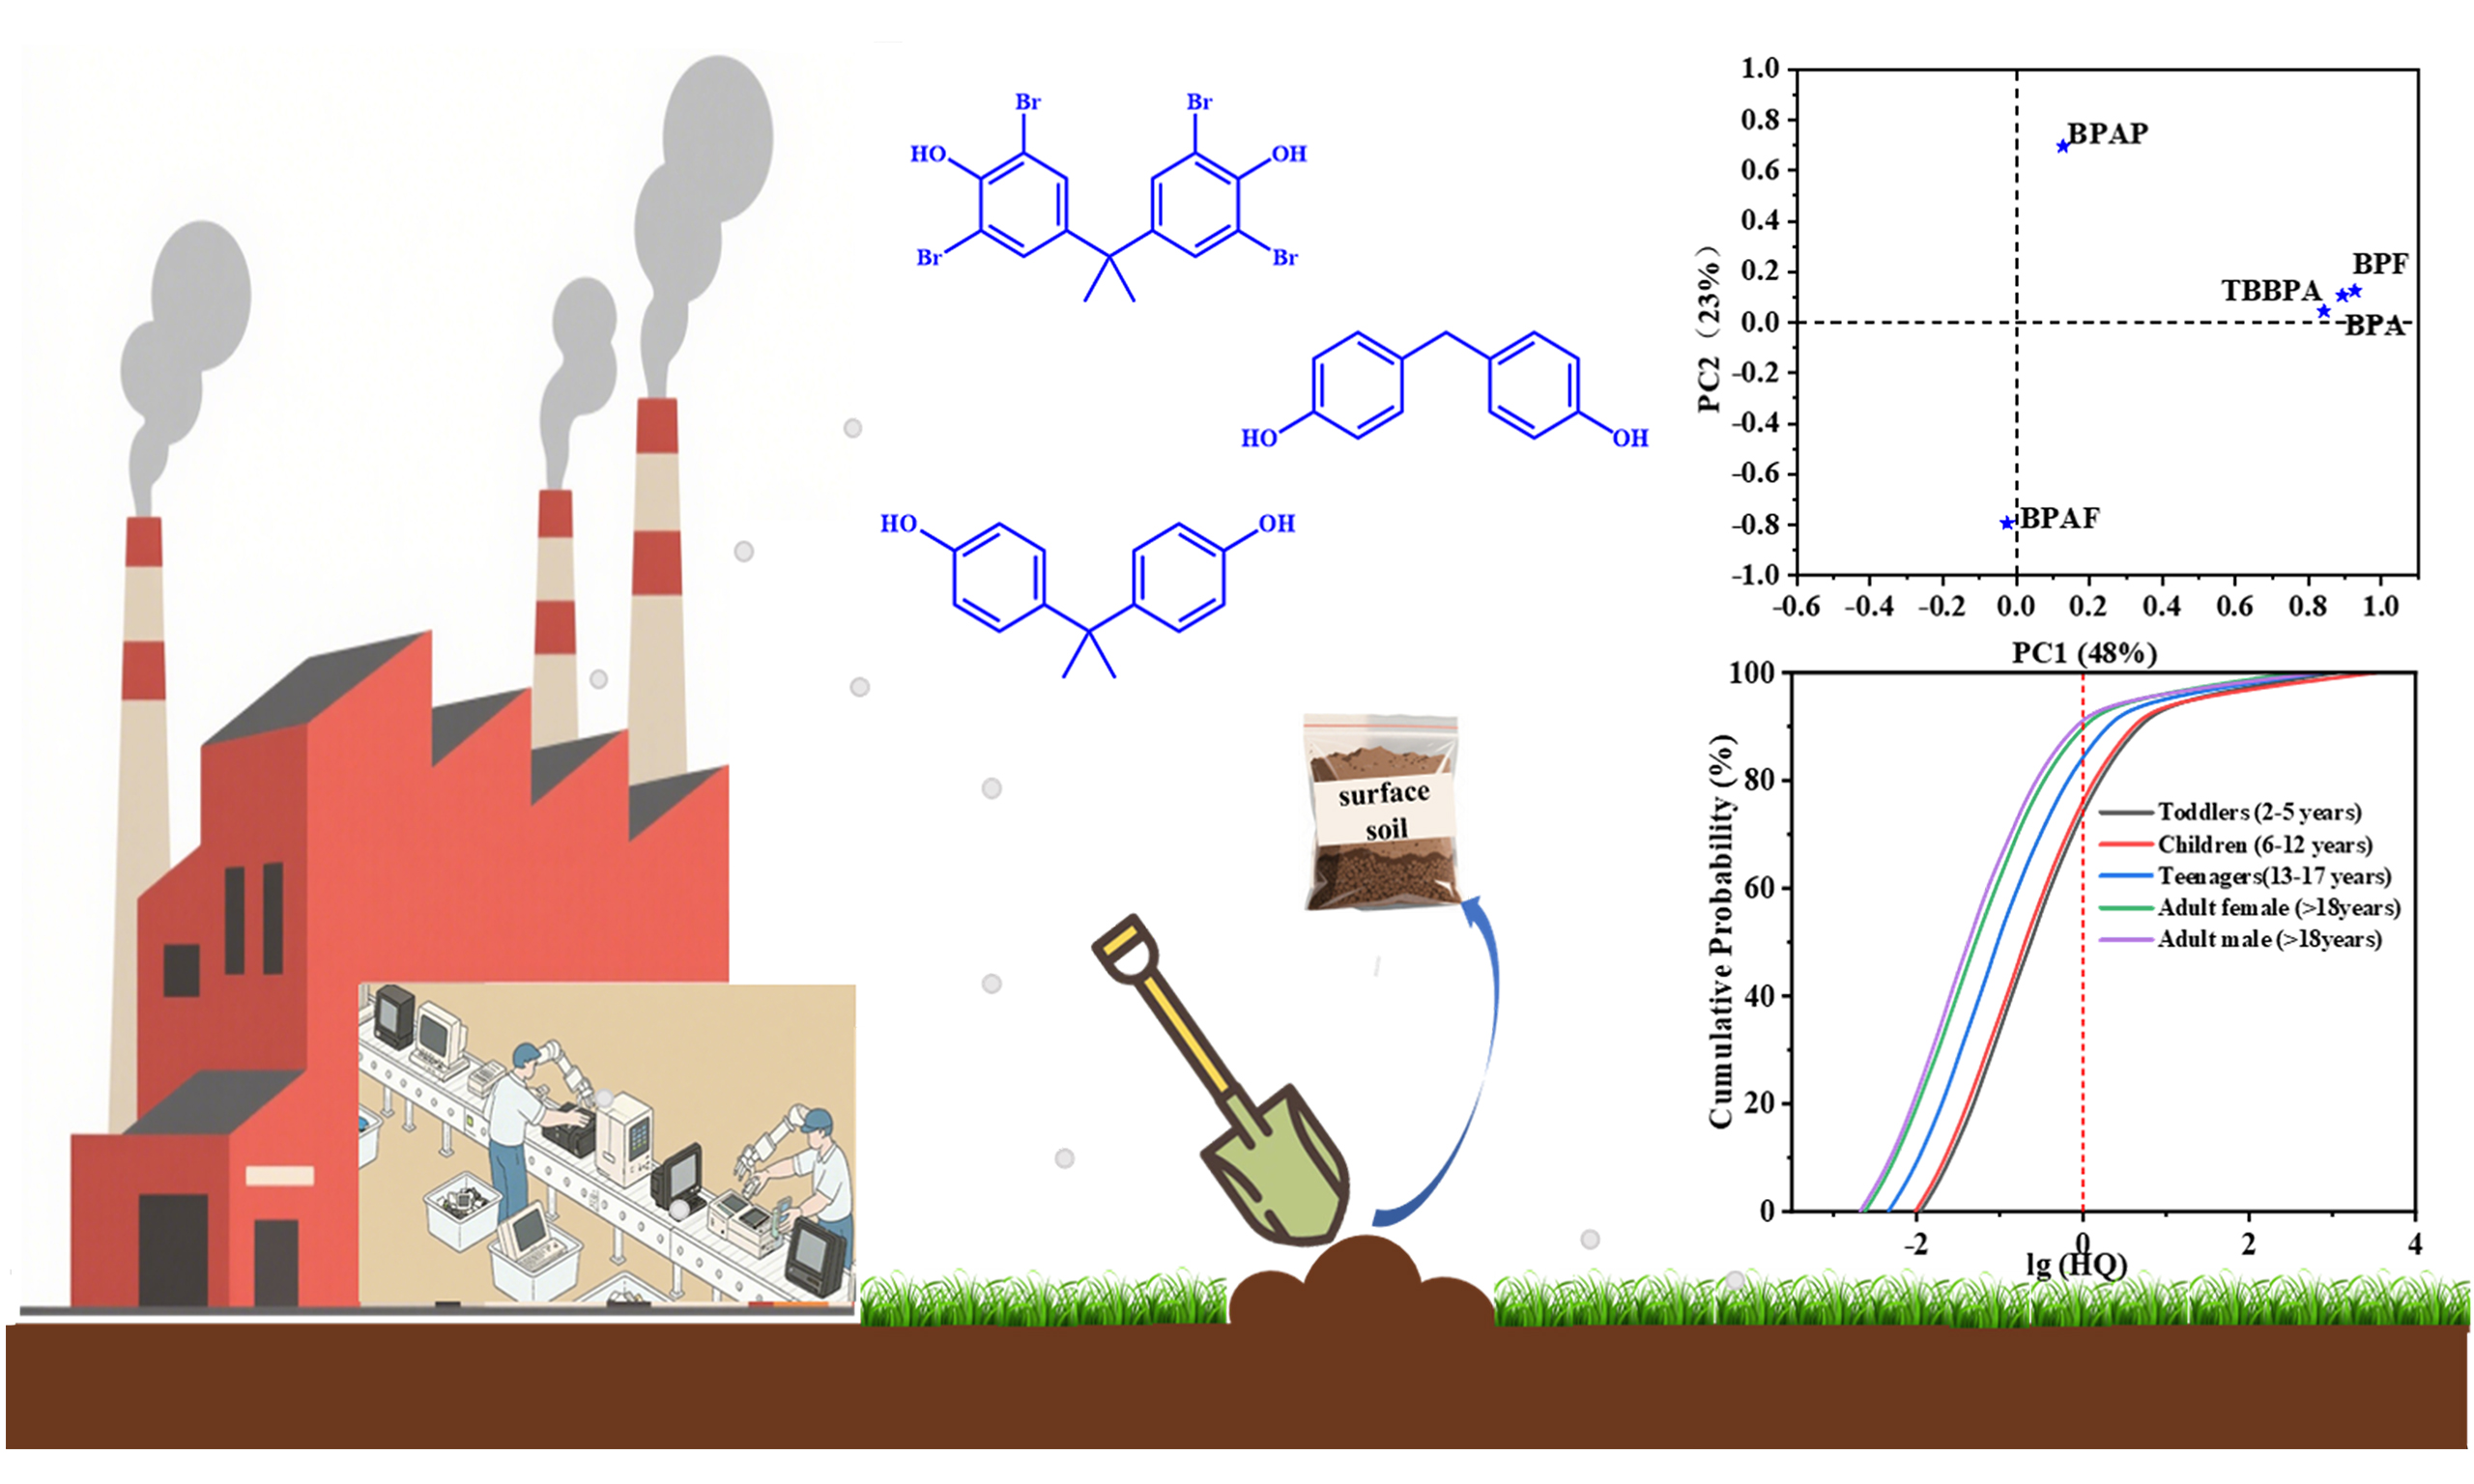
Traditional electronic waste (E-waste) dismantling activities release substantial bisphenol analogues (BPs). In recent years, China has promoted the transformation of traditional E-waste dismantling parks into circular economy parks, yet the contamination characteristics of BPs under this new model remain poorly understood. In the present study, we systematically analyzed the pollution characteristics and health risks of 10 BPs in soils surrounding four circular economy E-waste parks [Ziya (ZY) in Tianjin, Fengjiang (FJ) and Binhai (BH) in Zhejiang, and Qingyuan (QY) in Guangdong]. The results showed that BPs were widely detected in soils surrounding the parks, with bisphenol A (BPA) accounting for 55%-77% of total concentrations, followed by tetrabromobisphenol A (TBBPA) (6%-33%) and bisphenol F (BPF) (5%-14%). Significant inter-park heterogeneity was observed: FJ exhibited higher median BPA, BPF, and TBBPA than ZY (P < 0.05), while its BPF concentrations surpassed those in BH and QY (P < 0.05). Further correlation and principal component analyses revealed strong positive associations among BPA, BPF, and TBBPA (r = 0.638-0.873), which collectively loaded highly on PC1 (33%-52%), and their co-release mechanisms were closely related to the E-waste dismantling and incineration process. In addition, the spatial distribution of BPs showed a radial decline with each park as the core, suggesting potential health risks to surrounding populations. Risk assessment using estimated daily intake showed that BPA exposures exceeded the European Food Safety Authority’s updated tolerable daily intake. Monte Carlo simulation indicated that 97%, 60%, 80%, 25%, and 15% of the population were at risk of non-carcinogenic effects from BPA, BPF, bisphenol AF, bisphenol S, and bisphenol AP, respectively.
Keywords
INTRODUCTION
With the rapid technological advancement of electric/electronic products (e-products), global electronic waste (E-waste) has reached over 62 million tons since 2022, an 82% increase from the 2010 level[1]. Despite the Chinese government’s implementation of import restrictions on foreign E-waste in recent years, domestically generated E-waste continues to dominate[2].
Bisphenol A (BPA), one of the most extensively produced chemicals worldwide, is extensively utilized in the production of polycarbonate plastics and resin coatings, resulting in its pervasive presence in electronic products[3,4]. Statistical data indicate that plastic components constitute approximately 30% of E-waste, translating to the generation of 18.6 million tons of plastic waste annually worldwide from E-waste[5]. Subsequent processing activities for E-waste facilitate the release of toxic substances into atmospheric, soil, and aquatic environments[6-8]. Fu and Kawamura found a significant positive correlation between BPA and 1,3,5-triphenylbenzene (plastic combustion tracer), suggesting that open-air incineration of plastic-containing municipal solid waste acts as a primary contributor to atmospheric BPA emissions[9]. Subsequent studies further revealed that combustion of printed circuit boards similarly liberates a large amount of BPA[10]. Moreover, Pan et al. reported that the median value of BPA in the dust of a typical E-waste dismantling park in Qingyuan City (9,220 ng/g) was significantly higher than that of local indoor dust (1,270 ng/g) and household dust in Guangzhou (1,410 ng/g), further indicating that E-waste dismantling activities would aggravate BPA pollution[11].
In addition to BPA, bisphenol analogues (BPs) are increasingly utilized in commercial products[12]. For example, bisphenol S (BPS), bisphenol F (BPF), and bisphenol AF (BPAF) are used in the production of specialized plastics and epoxy resins, while BPS additionally serves as a critical material in electronic packaging applications[13]. Tetrabromobisphenol A (TBBPA), a brominated BPA derivative, is widely added to consumer products as a flame retardant due to its superior fire resistance[14]. It is estimated to dominate over 60% of the global market share, and China remains one of the primary producers[15]. Tetrachlorobisphenol A (TCBPA), a structural analog of TBBPA, has emerged as an alternative with marked increases in industrial application over recent years[16]. Consequently, in E-waste dismantling settings, individuals may be simultaneously exposed to multiple BPs. These contaminants readily enter the human body via inhalation of airborne particulates, dietary intake, and dermal contact, posing potential health hazards to both occupational workers and residents near dismantling parks.
As reported by Li et al., the median urinary concentration of Σ4BPs (comprising BPA, BPF, BPS, and BPAF) was significantly higher in workers (14.2 ng/mL) than in urban residents (4.52 ng/mL) from a typical E-waste dismantling park in Tianjin[17]. Similarly, elevated urinary BPA and BPF levels were observed in E-waste workers from the E-waste dismantling park in Qingyuan, compared to rural populations[5], indicating heightened exposure risks in E-waste dismantling parks. Concurrently, mounting epidemiological evidence has established linkages between BPs and adverse health outcomes, including endocrine disruption, reproductive dysfunction, and cardiovascular disorders[18-20]. With growing emphasis on environmental protection, China has been driving the transition of traditional dismantling parks toward circular economy industrial parks in recent years. However, the pollution profiles of BPs under this emerging industrial paradigm remain inadequately characterized.
Thus, the current study selected surface soils collected from four circular economy E-waste dismantling parks across three provinces from high, mid, and low latitude regions in China, including Tianjin, Zhejiang, Guangdong, to conduct the following investigations: (1) identify the occurrence of 10 BPs in soils surrounding E-waste dismantling parks; (2) analyze the pollution characteristics and emission profiles of BPs in soil samples; and (3) assess potential human exposure risks through systematic risk assessment. This study not only provides us with a deeper understanding of the pollution characteristics of bisphenol compounds under the new mode, but also offers a scientific basis for relevant departments to formulate pollution policies for the E-waste dismantling industry.
EXPERIMENTAL
Reagents and materials
Standard materials of 10 BPs, including BPA, bisphenol Z (BPZ), bisphenol B (BPB), BPS, bisphenol P (BPP), bisphenol AP (BPAP), BPF, BPAF, TBBPA, and TCBPA, were purchased from AccuStandard Inc. (New Haven, U.S.). 13C12-BPA and TBBPA-d10 are isotope internal standards purchased from Cato Research Chemicals (Eugene, USA) and Dr Ehrenstorfer (Augsburg, Germany).
High-performance liquid chromatography (HPLC) grade solvents (methanol, acetonitrile) and Poly-Sery HLB Pro solid phase extraction (SPE) cartridges (200 mg / 6 mL) were obtained from CNW Technologies (Dusseldorf, Germany). Acetone was bought from Guangzhou Anjiehui Trading Co., Ltd.
Sample collection and preparation
The four study sites included: Ziya (ZY) circular economy industrial park (Tianjin Province, China); Fengjiang (FJ) and Binhai (BH) metal resource recycling park (Zhejiang Province, China); and Qingyuan (QY) circular economy industrial park (Guangdong Province, China). ZY, the largest circular economy industrial park in northern China, was founded in 2003. It handles 1.5 million tons of waste electromechanical equipment every year. It mainly carries out automotive E-waste dismantling, non-ferrous metal recycling, and rubber and plastic material recycling. The sampling area covered an area of 8 km × 8 km in the park, and one background sample was collected from Nankai University at 50 km northeast of the park. FJ, established in 2003, was able to dismantle 3 million tons of waste metal materials per year, and completed the industrial migration to BH in 2015. The sampling area included 6 km × 6 km of FJ and 6 km × 6 km of BH, and a background sample was collected in the foothills of Wenling Mountain 10 km away. QY was established in 2006, focusing on the combination of electronic material manufacturing and the circular economy. The sampling area covers a range of 7 km × 7 km in the park and a background sample was collected in the new rural community 15 km away.
Based on the principle of grid distribution, 195 surface soil sampling points were set up around the four industrial parks, and each point was composed of five sub-samples. The samples were wrapped with aluminum foil paper during sampling, sealed and transported to the laboratory by cold chain. After freeze-drying, the sample was ground through a 100-mesh sieve and stored in a brown glass bottle at -20 °C for analysis. The sampling area includes various land use types such as industrial areas, residential areas, farmland, and natural vegetation coverage areas. The spatial distribution of specific sampling points is shown in Supplementary Figure 1.
Analytical protocols
The soil extraction and purification procedures were conducted as follows. Typically, 0.5 g of soil sample was weighed and placed in a Teflon centrifuge tube. Add 10 mL of methanol/acetone mixture (1:1, v/v). Then add internal standards (13C12-BPA and BBPA-d10), vortex mix for 1 min, and perform ultrasonic extraction for 10 min. Subsequently, the mixture was centrifuged at 4,000 rpm for 10 min, and the supernatant was collected. This extraction-centrifugation cycle was repeated twice, and all supernatants were combined. The pooled extract was concentrated to approximately 1 mL for subsequent purification.
The concentrated extract was purified through a SPE cartridge. Prior to loading the sample, the SPE cartridge was preconditioned sequentially with 6 mL of methanol and 6 mL of ultrapure water to activate the sorbent. Following sample loading, a 10 mL mixed solution of methanol and acetonitrile (1:1, v/v) was used to elute the target chemical. Finally, the eluate was dried under a nitrogen stream and reconstituted in 500 μL of methanol. The reconstituted solution was stored at -20 °C until instrumental analysis.
Instrumental analysis
The determination of BPs was performed using an S6000 Ultra HPLC system (Huapukeji, China) coupled with an SCIEX Triple Quad 3500 triple quadrupole mass spectrometer (AB Sciex, Framingham, MA, USA) operated in negative ionization mode. A C18 reversed-phase analytical column (100 mm × 2.1 mm, 2.5 µm) was employed for chromatographic separation, with the column temperature maintained at 40 °C. The mobile phase consisted of methanol and 2 mM ammonium acetate aqueous solution. The injection volume was 5 μL and the flow rate was 0.3 mL/min. The gradient based on methanol was as follows: 0-1 min, 25%; 1-3 min, 25%-60%; 3-6 min, 60%-99%; 6-10 min, 99%; 10-10.1 min, 99%-25%; 10.1-12 min, 25%. For mass spectrometry, the temperature of the ion source was set at 500 °C, and the spray voltage of the ion source was set at 5,500 V. The mass spectrum and multiple reaction monitoring (MRM) parameters are detailed in Supplementary Table 1.
Quality assurance and quality controls
Every 10 soil samples were analyzed with one blank matrix and one spiked matrix to ensure the validity of the experimental data and to check for any possible contamination. The analysis results of the spiked samples showed that the recovery of the target analytes was between 65.8% and 117.0%, the relative standard deviations were 2.63%-14.6%, and the regression coefficient of the calibration curve for the quantitative target analyte was > 0.99. The concentrations corresponding to 3 times signal-to-noise ratio and 10 times signal-to-noise ratio were set as the limit of detection (LOD) and limit of quantitation (LOQ), respectively. The detailed data are listed in Supplementary Table 2.
Statistical analysis
The concentration of the target compound below LOD was recorded as not detected (n.d.). For the analyte concentration between LOD and LOQ, if the detection rate of the compound exceeded 50%, the concentration was recorded as 1/2 LOQ; otherwise, the concentration was recorded as 1/4 LOQ[21]. All data were analyzed by SPSS (IBM, USA). The contour map was drawn using Surfer (Golden Software, USA) software, and the Kriging method was used for interpolation. Origin (Origin Lab, USA) processes other graphics.
Estimated daily intake and risk assessment
Oral and dermal exposure represent the primary pathways for human contact with soil contaminants. Therefore, it is particularly important to assess the potential risks of oral and dermal exposure to BPs to human health. The estimated daily intake (EDI, μg/kg/day), hazard quotient (HQ) and hazard index (HI), considering the non-carcinogenic endpoint, were calculated as follows.
where Csoil is the level of BPs in soil samples (ng/g), IR is the daily oral ingestion rate of soil (mg/d), and BW is body weight (kg). The IR and BW values of different age groups of the Chinese population were selected from the 2013 and 2016 Exposure Factors Handbook of Chinese Population (Adults/Children)[22].
where Csoil is the concentration of BPs in soil (μg/kg); AEXP is the dermal exposure surface area; Fm is the dermal absorption factor; DAE is the degree of skin covered; DAR denotes the dermal absorption rate; TB is the exposure duration via soil contact; Fa is the relative absorption factor (assumed as 1 in the worst-case scenario, indicating complete dermal absorption of all BPs); and BW is the body weight (kg)[23-25]. Detailed information on the parameters, values, and units in the formula can be found in Supplementary Table 4.
where the BPA reference dose (RfD) recommended by the U.S. Environmental Protection Agency is 50 μg/kg-bw/day[26]. In 2015, the provisional allowable daily intake (TDI) of BPA recommended by the European Food Safety Authority was 4 μg/kg-bw/day[27]. In 2023, the recommended TDI was revised to 0.2 ng/kg-bw/day[28]. The RFDs for BPF and BPS are 8.09 and 0.37 ng/kg-bw/day, respectively[29], while the RFDs for BPAF and BPAP are 0.04 and 2.31 ng/kg-bw/day, respectively[30]. HQ > 1 or HI > 1 is considered indicative of a potential non-carcinogenic health risk.
RESULTS AND DISCUSSION
Detection frequencies of BPs
The detection frequencies (DF) of BPs in each park are shown in Table 1. In this study, Σ10BPs (DF = 100%) were detected in all soil samples collected from four E-waste dismantling parks, indicating ubiquitous contamination from these compounds. BPA exhibited the highest DF across all parks: 98.6% in ZY, 97.4% in FJ, 100% in BH, and 98% in QY. Among the alternatives, BPF and BPAF demonstrated detection rates exceeding 70% at all sites, while BPAP maintained > 60% DF except in QY (47.1%). Notably, BPB was exclusively detected in ZY with a detection frequency of 60.9%, and BPP demonstrated DF exceeding 50% solely in BH and QY. However, BPZ demonstrated an extremely low detection frequency (0%-1.9%) throughout the study parks. In addition, the detection rate of TBBPA in FJ (94.7%), BH (91.2%) and QY (94.1%) was higher than that in ZY (68.1%). Compared with non-industrial park (54.8%)[22], the elevated TBBPA levels observed in these E-waste dismantling parks suggest potential amplification of exposure risks associated with industrial activities[11]. In contrast, its chlorinated substitute TCBPA showed limited occurrence (DF < 15%), which was related to the lower market share of TCBPA[31]. In summary, a multitude of scholars have reported that the release of BPs is closely related to E-waste dismantling activities[5,9]. This study also shows that the use of BPA in the production process of electronic products is gradually shifting to its derivatives, such as BPF, BPAF, BPAP, BPB, BPP, and TBBPA, which needs more attention.
Concentration of BPs in the soil of the four parks (ng/g dw)
| Compounds | ZY | FJ | BH | QY | ||||||||
| Median | Range | DF | Median | Range | DF | Median | Range | DF | Median | Range | DF | |
| BPA | 18.1 | n.d.-326 | 98.6% | 48.0 | n.d.-582 | 97.4% | 21.9 | n.d.-1,355 | 100.0% | 20.8 | n.d.-1,077 | 98.0% |
| BPF | 3.19 | n.d.-86.2 | 92.8% | 10.7 | n.d.-101 | 97.4% | 3.70 | n.d.-147 | 97.1% | 1.63 | n.d.-142 | 80.4% |
| BPAF | 0.073 | n.d.-0.327 | 95.7% | 0.060 | n.d.-104 | 86.8% | 0.058 | n.d.-1.82 | 97.1% | 0.030 | n.d.-4.33 | 70.6% |
| BPS | n.d. | n.d.-1.02 | 46.4% | n.d. | n.d.-4.16 | 34.2% | n.d. | n.d.-5.80 | 29.4% | n.d. | n.d.-3.16 | 39.2% |
| BPB | 0.630 | n.d.-19.2 | 60.9% | n.d. | n.d.-31.0 | 7.9% | n.d. | / | 0.0% | n.d. | n.d.-0.093 | 5.8% |
| BPAP | 0.067 | n.d.-11.2 | 62.3% | 0.134 | n.d.-1.44 | 81.6% | 0.074 | n.d.-1.79 | 76.5% | n.d. | n.d.-6.47 | 47.1% |
| BPZ | n.d. | n.d.-0.869 | 1.4% | n.d. | / | 0.0% | n.d. | / | 0.0% | n.d. | n.d.-4.94 | 1.9% |
| BPP | n.d. | n.d.-19.9 | 37.7% | n.d. | n.d.-4.80 | 13.2% | 1.18 | n.d.-37.8 | 55.9% | 1.64 | n.d.-29.4 | 68.6% |
| TCBPA | n.d. | n.d.-0.648 | 4.3% | n.d. | n.d.-81.5 | 10.5% | n.d. | / | 0.0% | n.d. | n.d.-3.65 | 5.9% |
| TBBPA | 1.45 | n.d.-971 | 68.1% | 29.0 | n.d.-1,694 | 94.7% | 7.46 | n.d.-626 | 91.2% | 7.51 | n.d.-662 | 94.1% |
| Σ10BPs | 38.7 | 3.57-1,029 | 100% | 114 | 3.96-2,109 | 100% | 41.7 | 5.00-1,841 | 100% | 33.6 | 2.93-1,759 | 100% |
Levels of BPs in the four parks
Distribution of BPs in collected samples around the four E-waste dismantling parks, including ZY, FJ, BH, and QY, is presented in Table 1. The total concentration of BPs (Σ10BPs) in soil samples was 3.57-1,029 ng/g in ZY, 3.96-2,109 ng/g in FJ, 5.00-1,841 ng/g in BH, and 2.93-1,759 ng/g in QY. Among them, the median values of Σ10BPs in FJ (114 ng/g) were more than twice as high as those in ZY (38.7 ng/g), BH (41.7 ng/g), and QY (33.6 ng/g). However, there was only a significant difference between the concentration of soil samples in FJ and QY (P < 0.01). Compared to the previously reported levels of total BPs (median: Σ32BPs = 4.5 ng/g) in surface soil of typical urban and rural areas across China[22], the concentrations of BPs measured around E-waste recycling parks in this study were significantly higher, indicating that E-waste dismantling activities substantially contribute to the elevation of bisphenol compound levels in soils.
Table 2 summarizes the concentrations of BPs in soils from different regions. As the predominant congener among BPs, BPA displayed median values of 18.1, 48.0, 21.9, and 20.8 ng/g across the four parks of ZY, FJ, BH, and QY, which were significantly lower than those reported near an E-waste dismantling park in Guiyu (60.7 ng/g)[32]. This reduction can be primarily attributed to enhanced governmental environmental remediation initiatives[33]. In addition to that, the median concentration in FJ exceeded the other parks by over two-fold, though statistically significant differences (P < 0.05) were observed solely between FJ and ZY, highlighting heterogeneous BPA emission characteristics among E-waste dismantling facilities.
Levels of BPs in soils from various regions
| Sampling sites | Sample types | Time | Sample size | BPA | BPS | BPB | BPF | BPZ | TBBPA | ΣBPs | Ref. |
| China (Qingyuan) | Wire and cable recycling parks | 2020 | 37 | 3,440 (n.d.-2,5900) | 167 (25.2-1,230) | [32] | |||||
| Surrounding area | 174 (n.d.-2,400) | 6.38 (1.02-766) | |||||||||
| China (Shouguang) | Chemical industry parks | 2020 | 31 | 1.58 (n.d.-35.3) | 5.99 (n.d.-387) | ||||||
| China (Guiyu) | E-waste dismantling park | 2018 | 24 | 1,870 (366-108,000) | 527 (82.6-98,300) | ||||||
| Surrounding area | 83 | 60.7 (n.d.-4,060) | 17.4 (n.d.-8,490) | ||||||||
| China (Qingyuan and Shantou) | E-waste dismantling | 2021 | 24 | 3,350 (532-16,740) | 9.86 (n.d.-25.0) | 11.9 (1.05-655) | 920 (30.3-4,580) | 3.75 (n.d.-83.4) | 1,850 (268-6,390) | 6,968 (962-47,165) | [34] |
| Surroundings | 34 | 84.1 (7.20-4,050) | n.d. (n.d.-14.3) | 0.17 (n.d.-12.0) | 12.3 (2.17-238) | 0.21 (n.d.-9.24) | 55.9 (n.d.-3,850) | 197 (10.3-7,751) | |||
| China (Longtang) | E-waste recycling | 2011 | 87 | NA (0.50-325) | NA (n.d.-220) | [35] | |||||
| China (Taizhou city) | E-waste recycling | 2017/2021 | 68 | 3.65 (n.d.-12.3) | 1.27 (0.03-8.35) | 2.32 (0.08-8.81) | NA (0.58-33.8) | [36] |
Concurrently, the concentrations of BPA alternatives (BPF, BPAP, and BPAF) also showed different spatial variation among the four E-waste dismantling parks. The concentrations of BPF ranged from n.d. to
Furthermore, the concentrations of TBBPA across the four industrial parks ranged as follows: ZY (n.d.-
Composition profiles and source implications of BPs
The compositional profiles of BPs across four E-waste recycling parks are shown in Figure 1. Generally, BPA dominated Σ10BPs in all studied sites, constituting 77%, 55%, 64%, and 66% of the total BPs in ZY, FJ, BH, and QY, respectively. Additionally, TBBPA emerged as the secondary dominant BP in FJ (33%), BH (22%), and QY (24%) except ZY (6%). Wei et al. reported that BPA was the most abundant BP (34.9%), followed by TBBPA (20.4%) in soil samples from E-waste dismantling parks in Taizhou[36]. BPF constituted the third most prevalent BP in FJ, BH, and QY, with proportional contributions ranging from 5% to 12% of total BPs. A human biomonitoring study revealed significantly higher urinary BPF concentrations in residents near E-waste recycling facilities compared to rural populations[5], indicating its extensive adoption as a primary BPA substitute in electronic products. Furthermore, the second most abundant compound in ZY was BPF (14%), aligning with the BP compositional characteristics reported by Pan et al. in E-waste dust samples from South China[11].
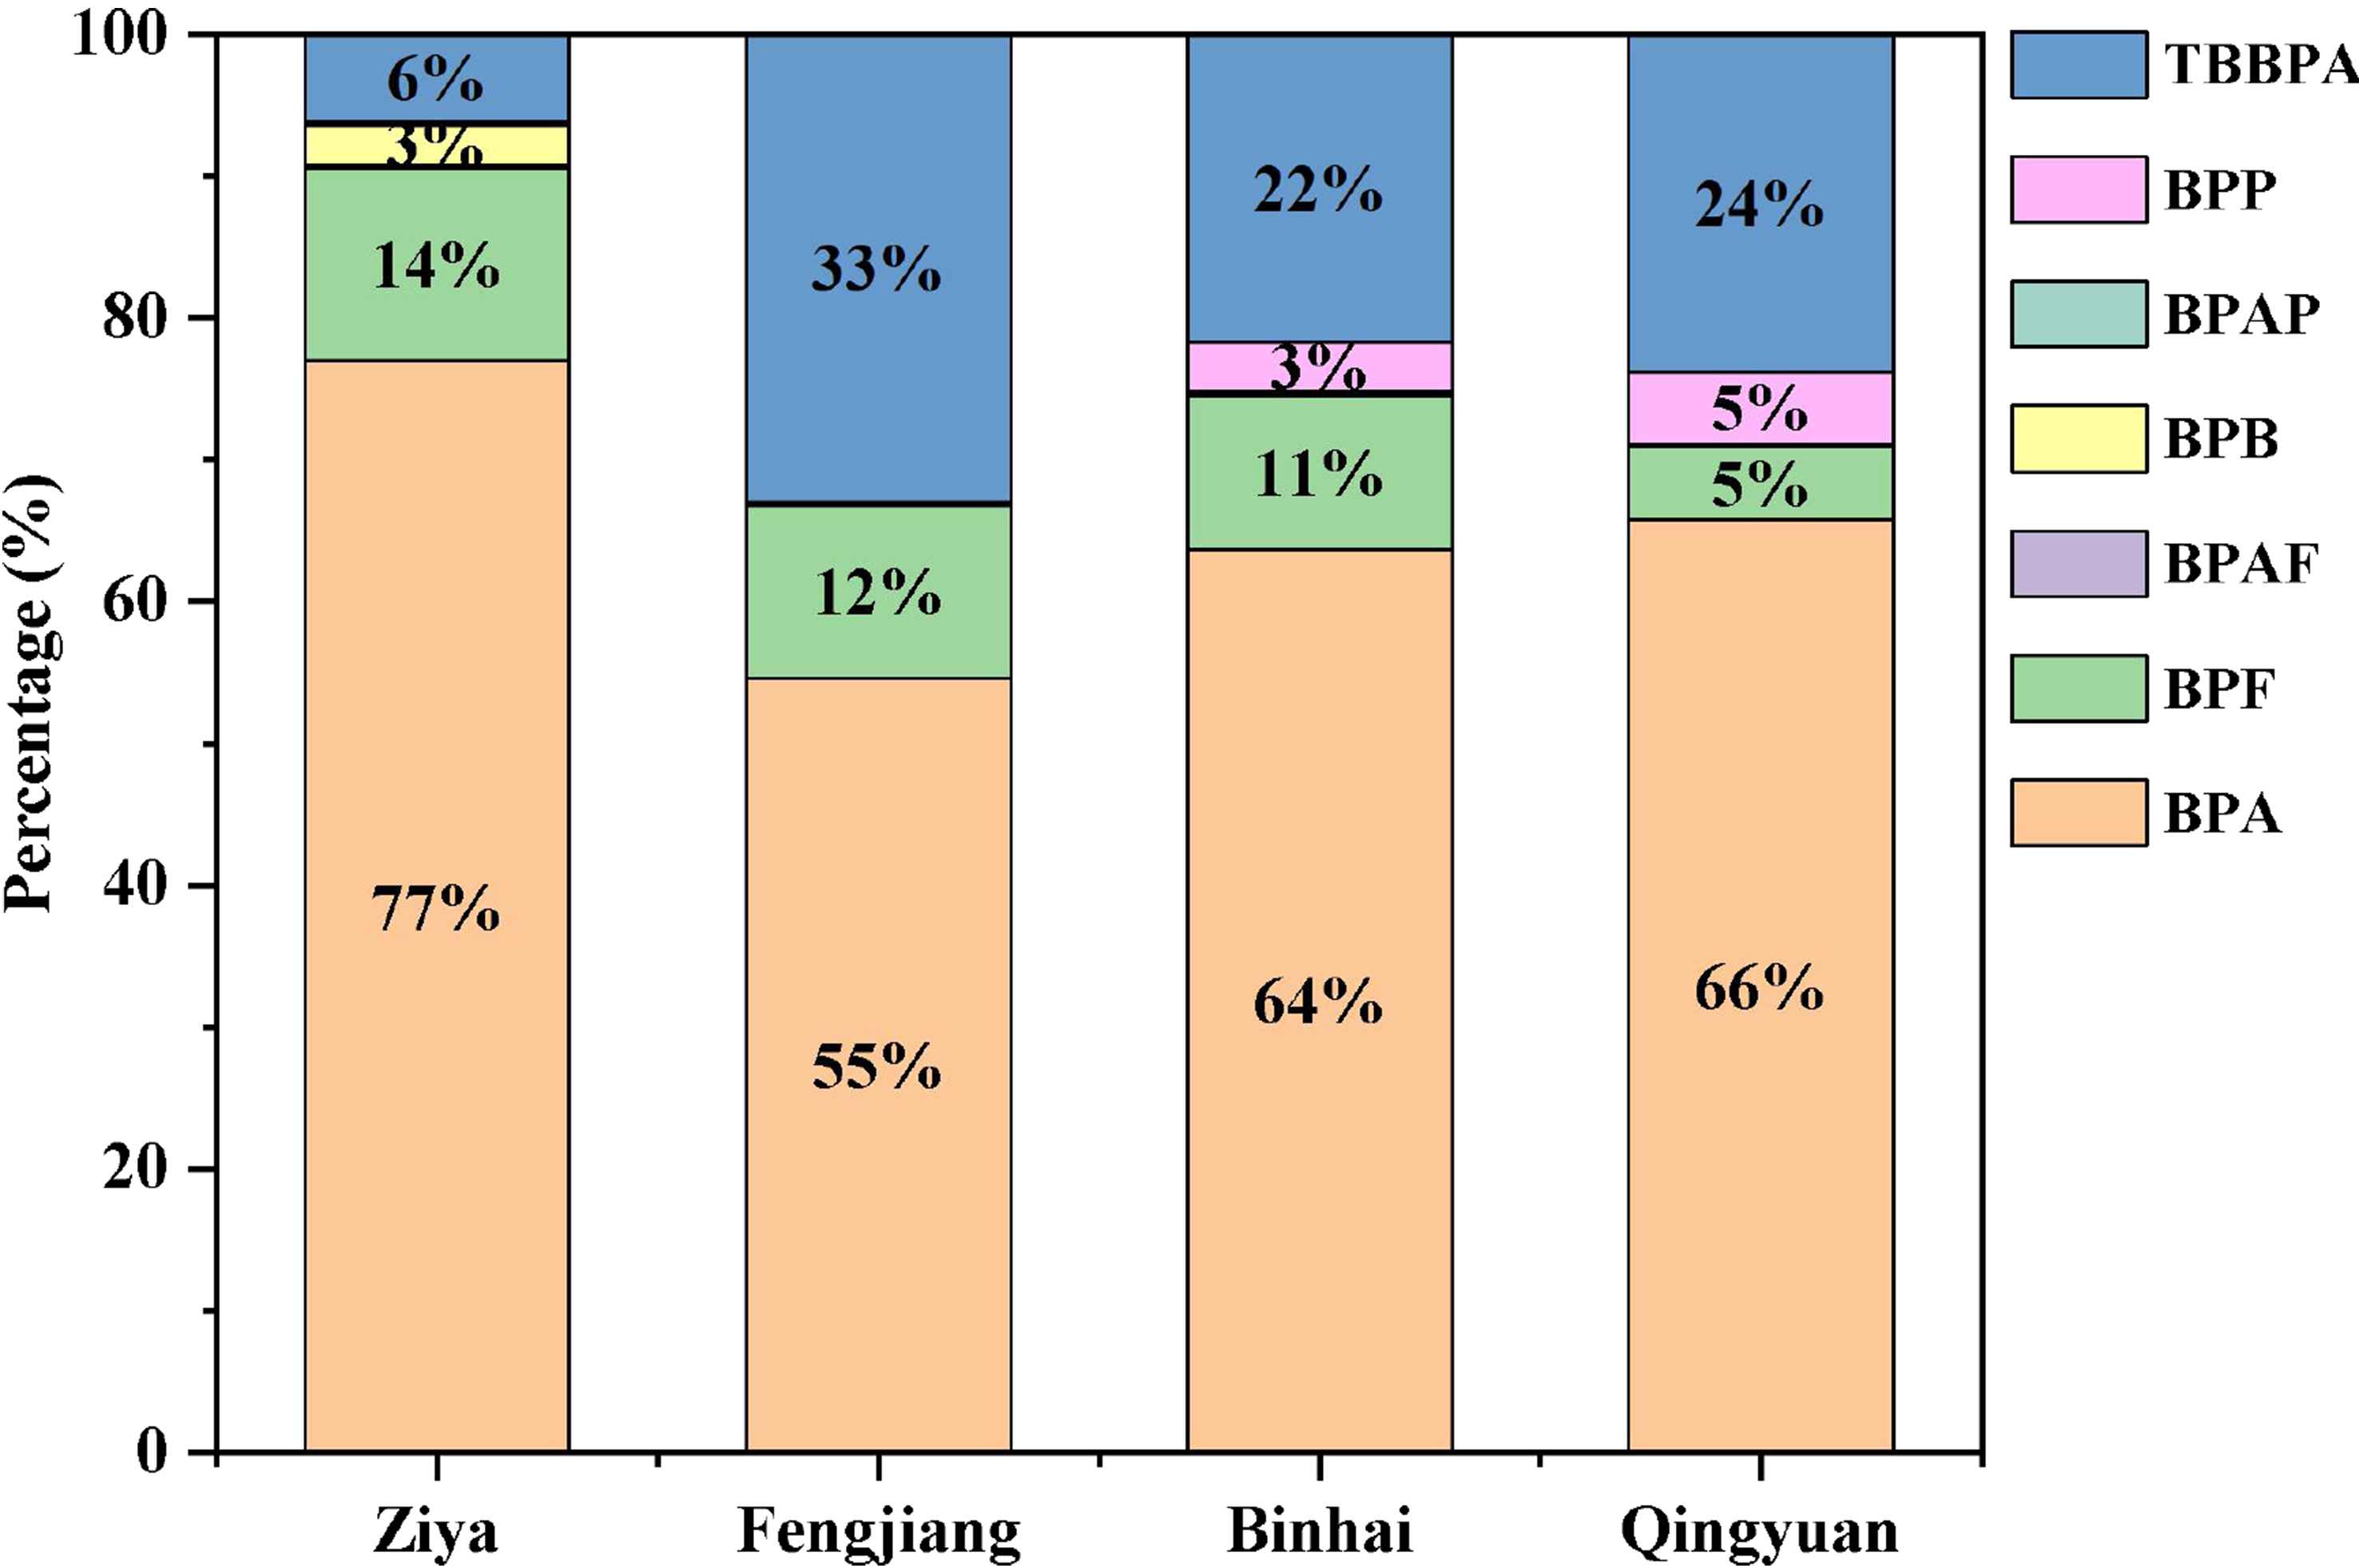
Figure 1. Composition profiles of BPs in soil in the four parks. BPs: Bisphenol analogues; TBBPA: tetrabromobisphenol A; BPP: bisphenol P; BPAP: bisphenol AP; BPB: bisphenol B; BPAF: bisphenol AF; BPF: bisphenol F; BPA: bisphenol A.
Correlation analysis among BPs provides critical insights into potential pollution sources. Figure 2 illustrates inter-compound correlations of BP concentrations in surface soils surrounding four E-waste dismantling parks. Strong positive correlations (r = 0.638-0.873, P < 0.01) were observed among BPA, BPF, and TBBPA concentrations across all parks. Existing literature has documented significant positive correlations among BPs (r = 0.173-0.698; P < 0.05) in E-waste dust samples[11], indicating the prevalent co-application of diverse BPs in electronic equipment and their shared emission sources during E-waste dismantling. In addition, weak to moderate positive correlations (r = 0.288-0.569, P < 0.05) emerged between BPAF and BPA, BPF, or TBBPA in BH and QY, and BPAP exhibited similar correlations (r = 0.296-0.432, P < 0.05) with BPA and BPF in ZY and BH. These findings correspond with the widespread utilization of diverse BPs in electronics manufacturing[5], suggesting their potential release into surrounding environments through E-waste treatment processes.
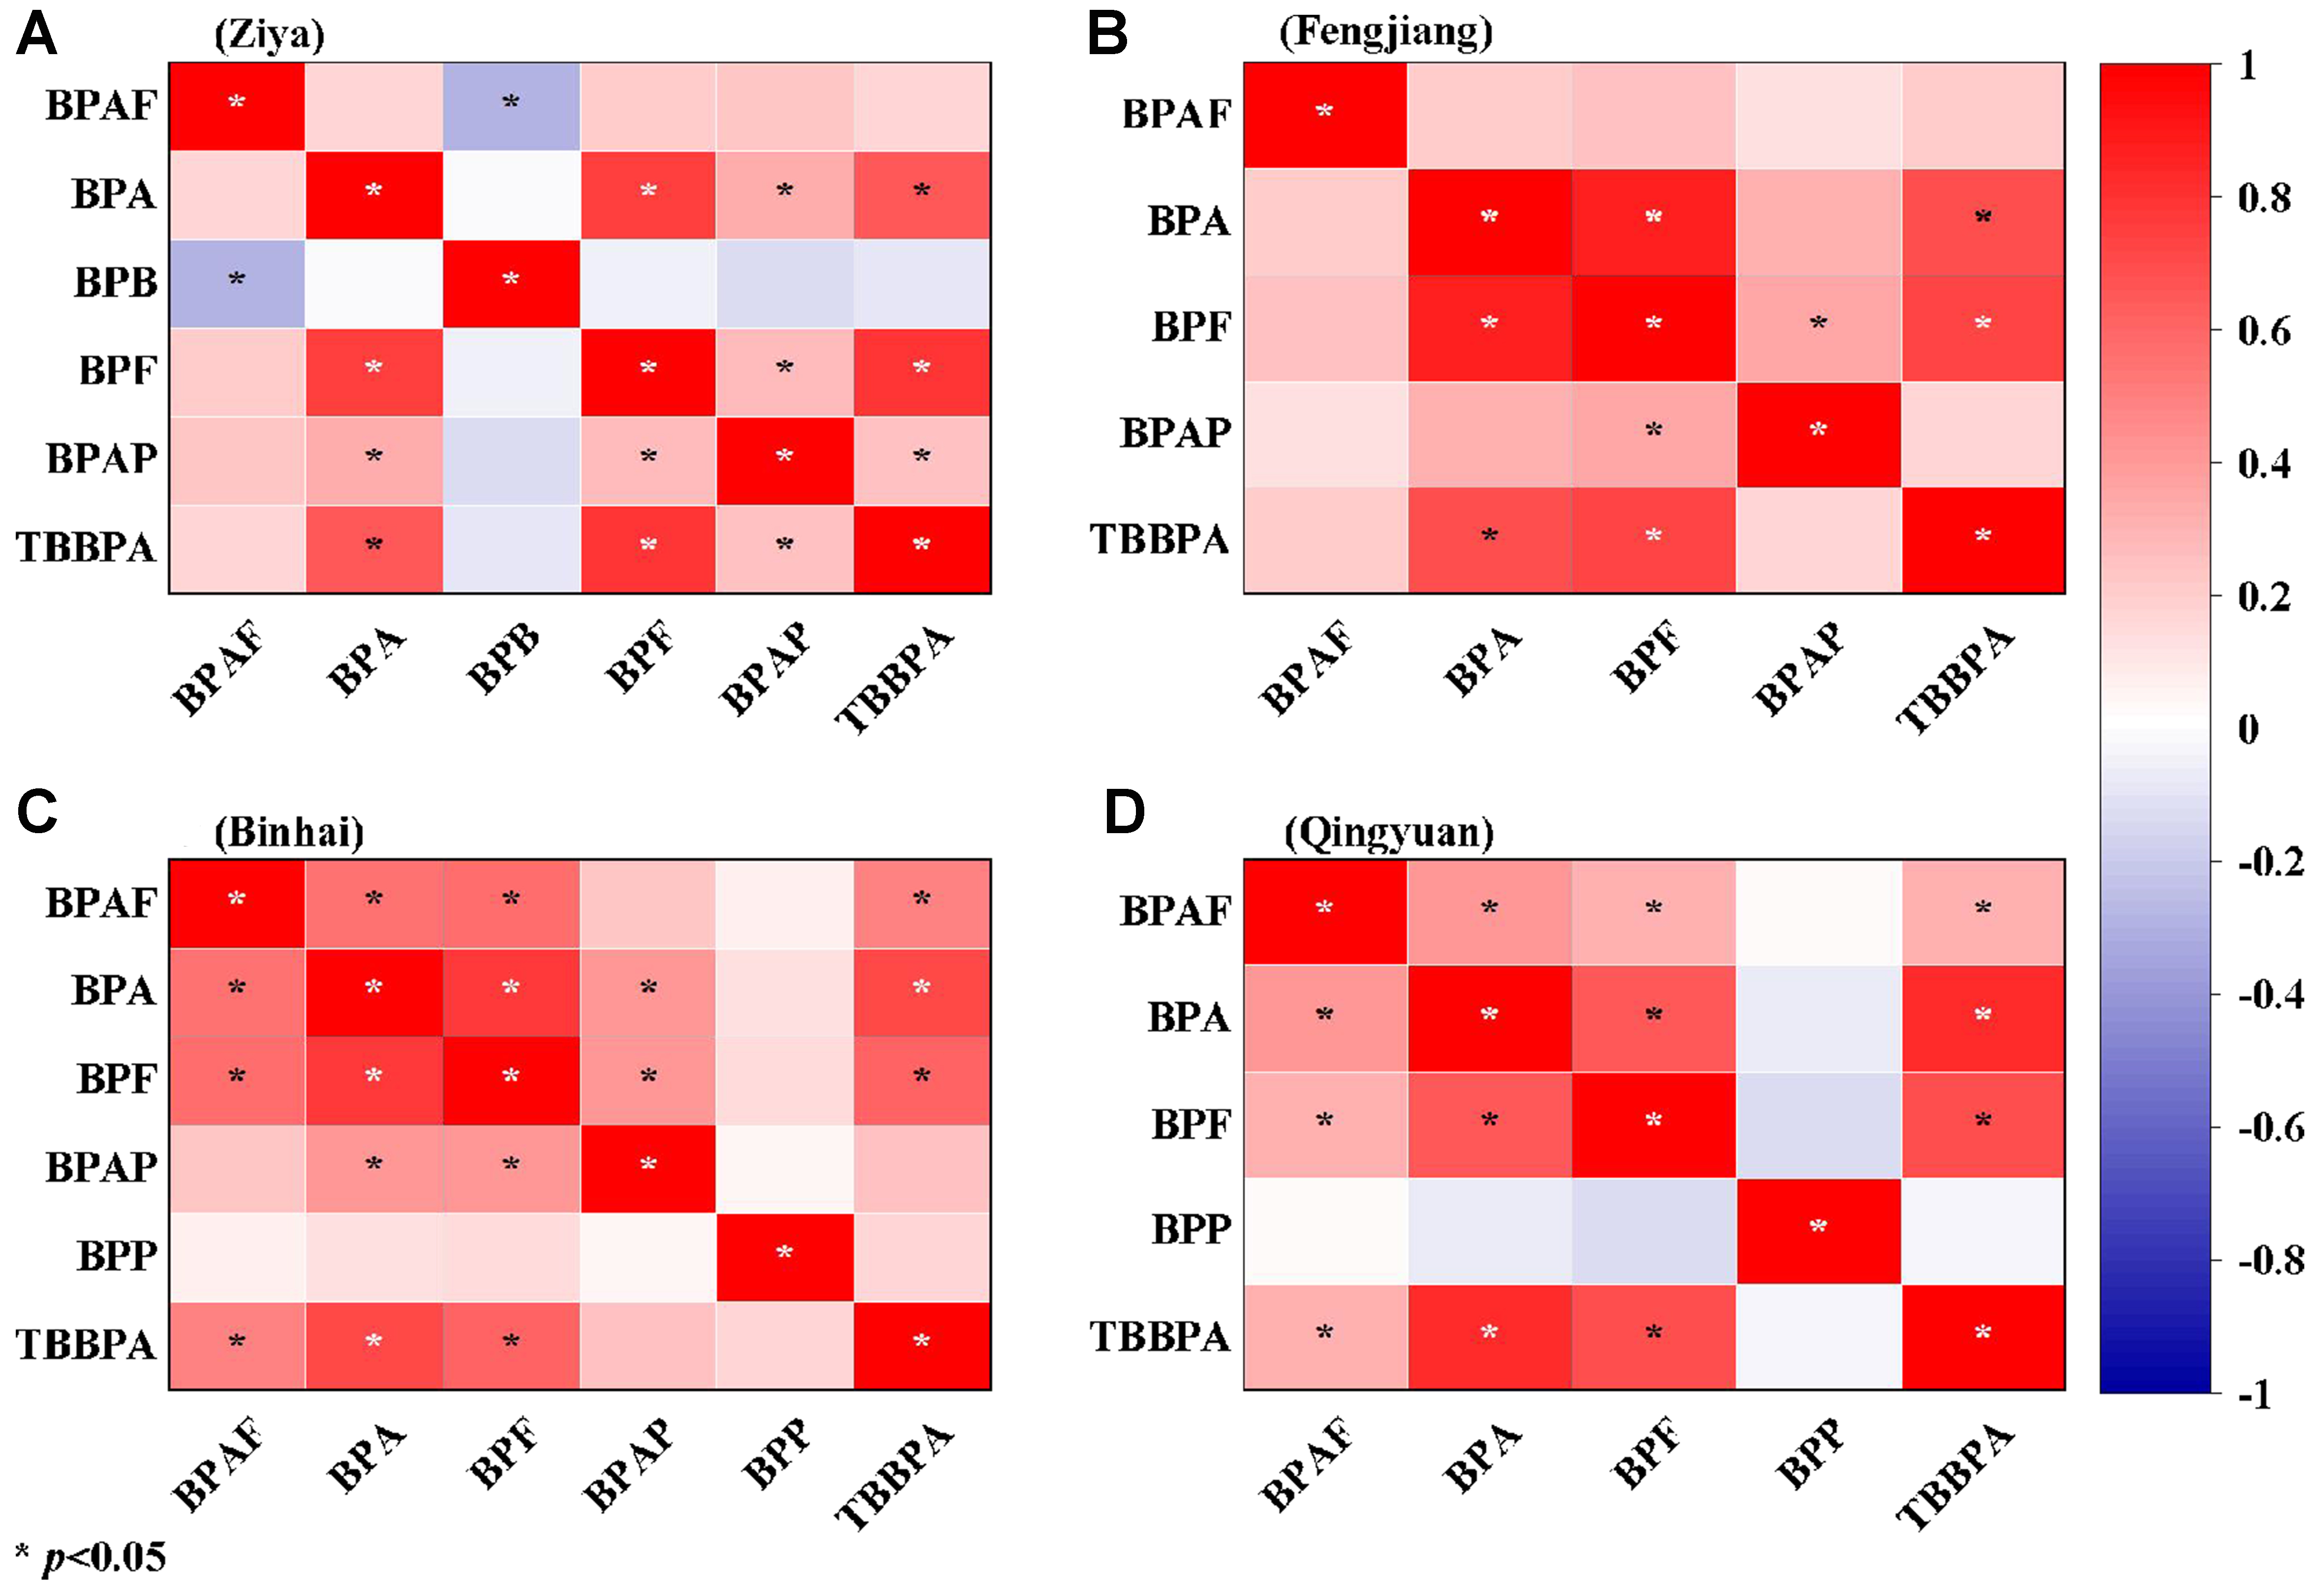
Figure 2. The correlation among BP compounds in the soil around the four E-waste dismantling parks. BP: Bisphenol analogue; E-waste: electronic waste; BPAF: bisphenol AF; BPA: bisphenol A; BPB: bisphenol B; BPF: bisphenol F; BPAP: bisphenol AP; TBBPA: tetrabromobisphenol A.
To further elucidate the pollution source characteristics of BPs in four E-waste dismantling parks, principal component analysis (PCA) was performed on BPs with DF exceeding 50% in surrounding soils. Figure 3A presents the PCA results for ZY, where PC1 [variance accounted for (VAF) = 33%] exhibited high loadings for BPA (0.83), BPF (0.89), and TBBPA (0.68), indicating their common origin. This pattern strongly correlates with combustion processes in E-waste treatment. As a fundamental component of polycarbonates and epoxy resins, BPA is extensively present in circuit boards, device casings, and structural components[4]. BPF has been widely adopted as a BPA alternative in electronic manufacturing because of its superior thermal stability and impact resistance[12]. TBBPA, a halogenated BPA derivative, serves as the predominant brominated flame retardant in electronic equipment[31]. Unlike traditional physical additive flame retardants, in high-end electronic materials such as printed circuit boards and engineering plastics, TBBPA participates in polymer synthesis through chemical bonding, becoming an integral part of the material’s molecular chains to achieve enhanced flame-retardant effects. Their co-occurrence in PC1 confirms the synchronous release mechanism of BP-containing polymeric materials during incineration. However, PC2 (VAF = 23%) revealed contrasting loadings between BPAF (0.79) and BPB (-0.752), potentially reflecting distinct contamination pathways. Notably, as shown in Figure 3B-D, PC1 in FJ, BH, and QY exhibited consistent high loadings for BPA (0.892-0.903), BPF (0.879-0.927), and TBBPA (0.636-0.987), aligning with the trends in ZY. This consistency further verifies E-waste incineration as the primary control factor for the release of BPs across all study parks. Interestingly, previous compositional profiles analysis of BPs across E-waste dismantling parks revealed that ZY exhibited a significantly lower proportion of TBBPA compared to QY, BH, and FJ. PCA further demonstrated higher VAF values in PC1 for FJ (48%), BH (40%), and QY (52%) compared to ZY park, indicating lower TBBPA generation through incineration processes in ZY.
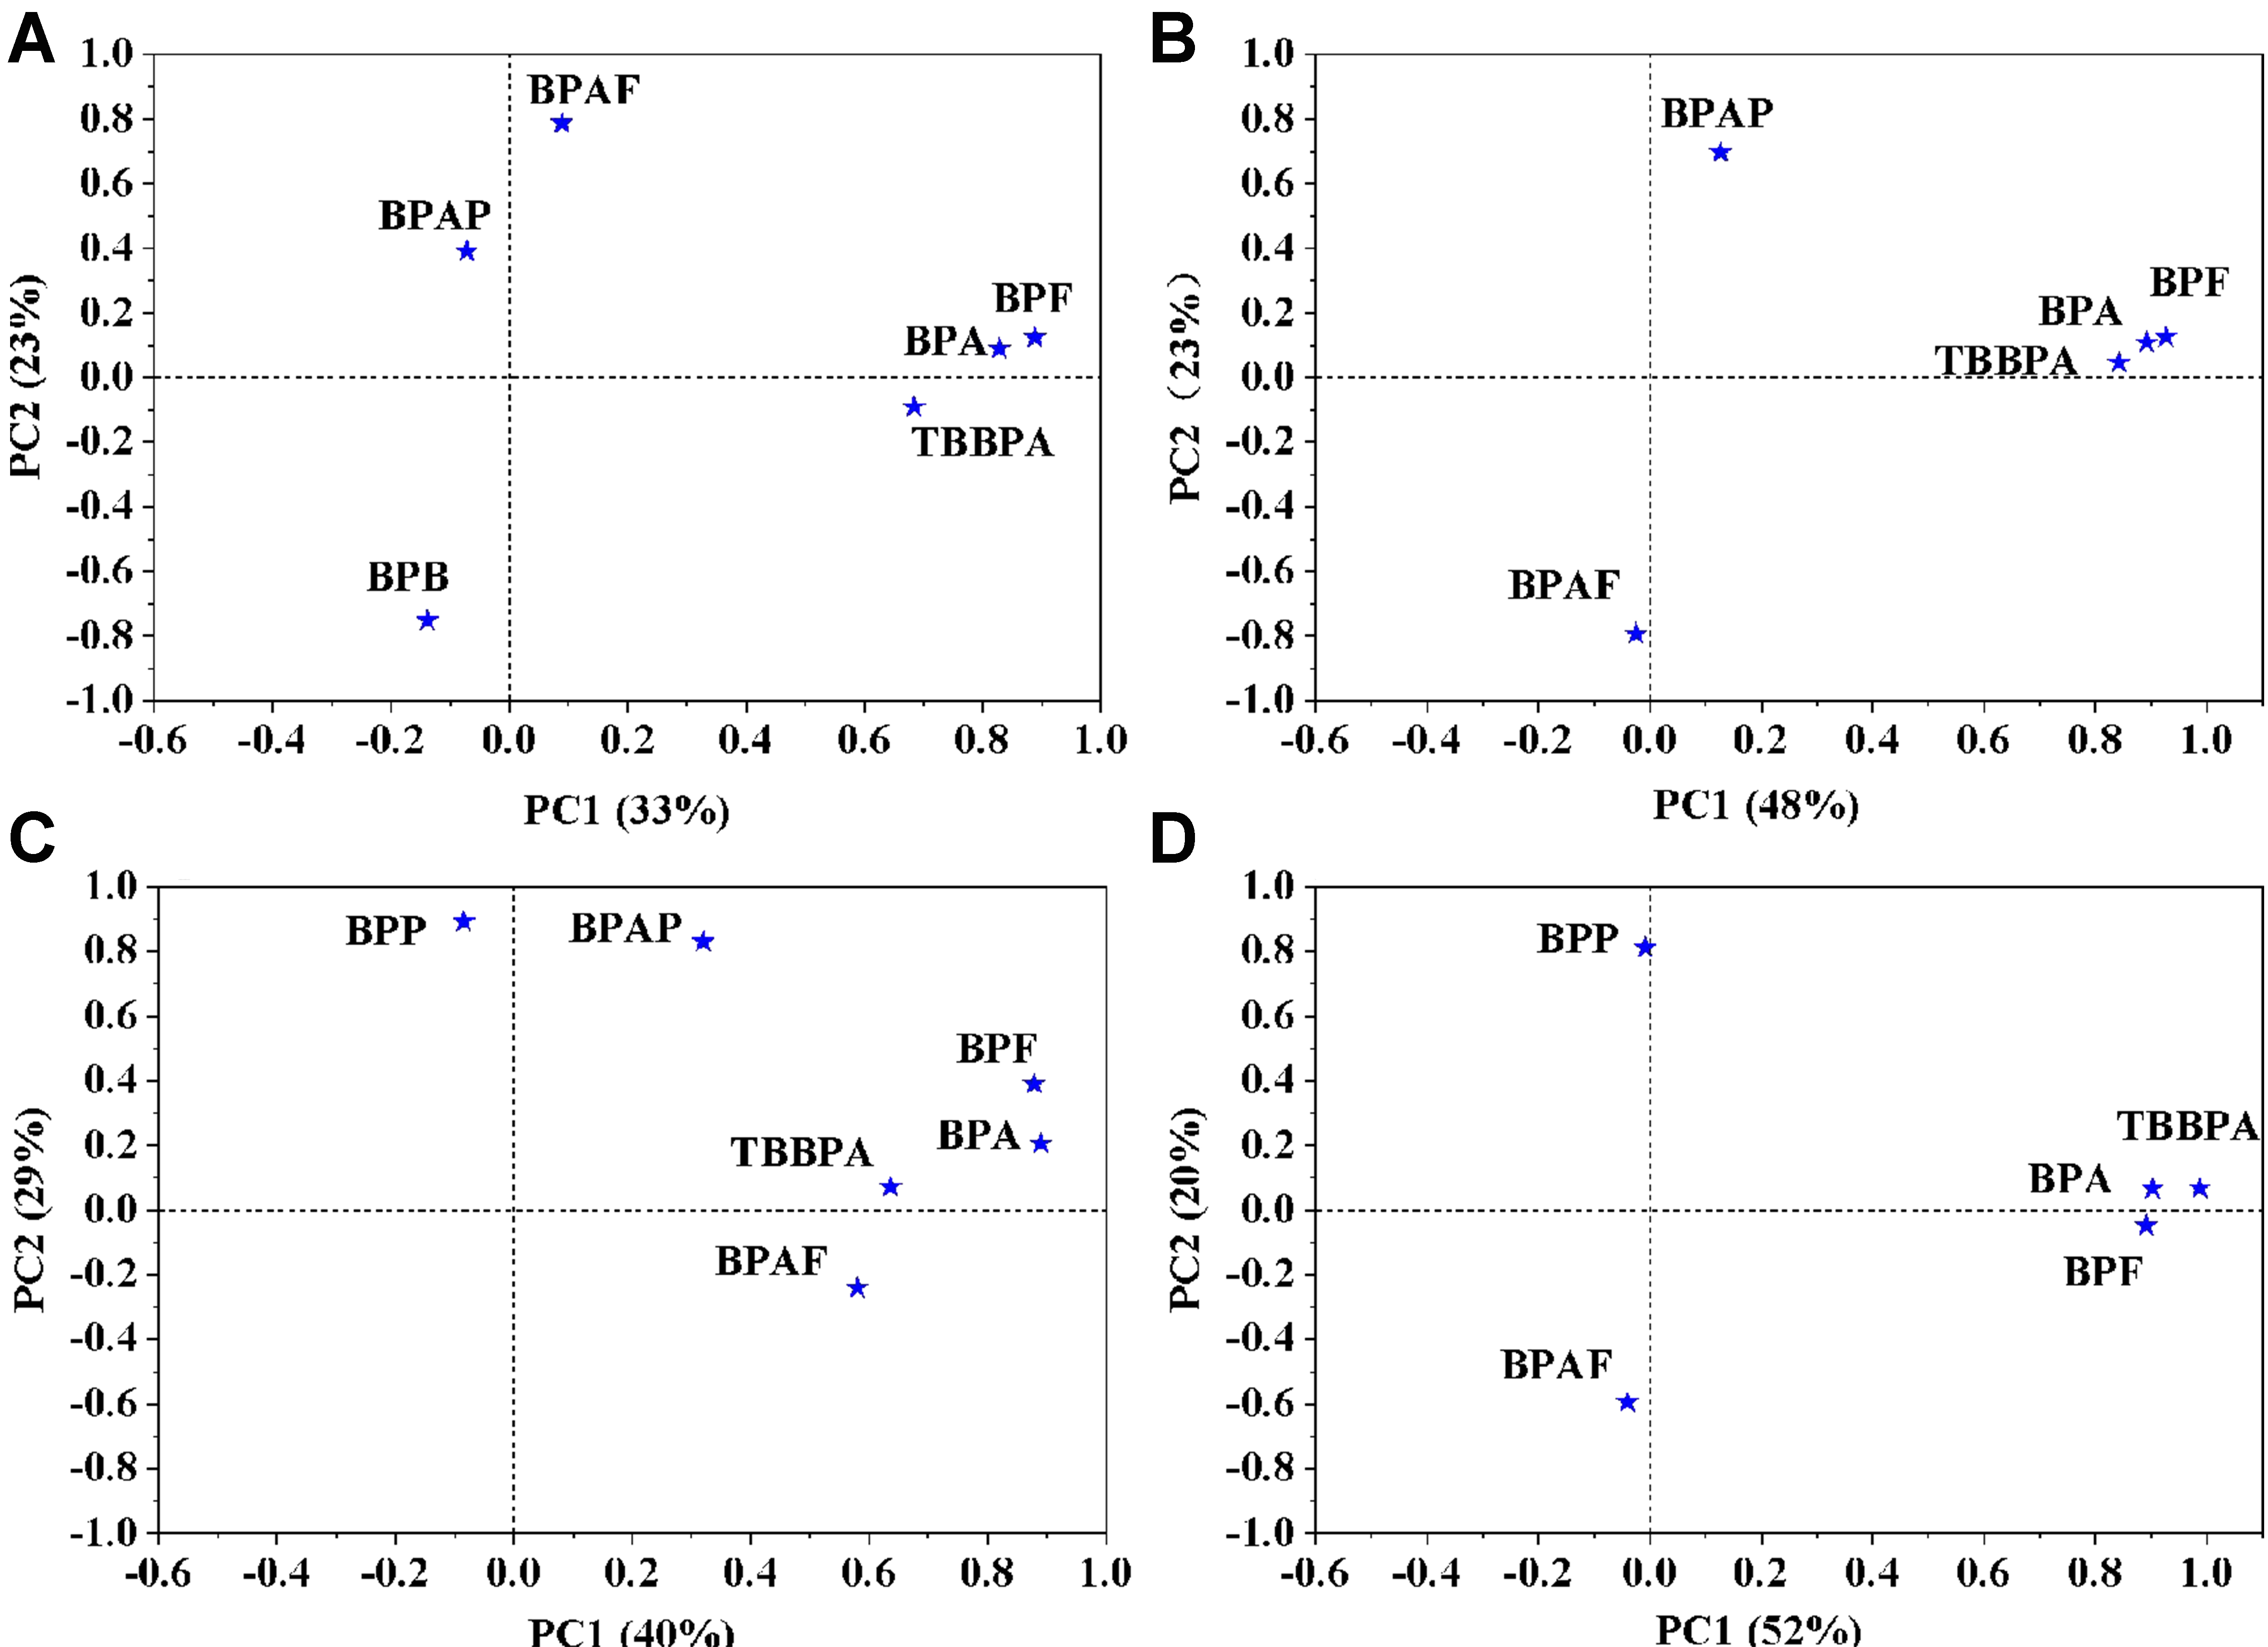
Figure 3. PCA of BPs (detection frequency > 50%) in (A) ZY, (B) FJ, (C) BH, and (D) QY. PCA: Principal component analysis; BPs: bisphenol analogues; ZY: Ziya circular economy Industrial Park; FJ: Fengjiang Metal Resource Recycling Park; BH: Binhai Metal Resource Recycling Park; QY: Qingyuan circular economy Industrial Park; BPAF: bisphenol AF; BPAP: bisphenol AP; BPF: bisphenol F; BPA: bisphenol A; TBBPA: tetrabromobisphenol A; BPB: bisphenol B.
Spatial distribution of BPs in the parks and surrounding areas
To visualize the contamination levels of Σ10BPs in soils surrounding E-waste dismantling parks and their impacts on adjacent areas, contour plots were generated to analyze the spatial distribution of Σ10BPs. Figure 4 displays the spatial distribution characteristics of Σ10BPs concentration contour plots.
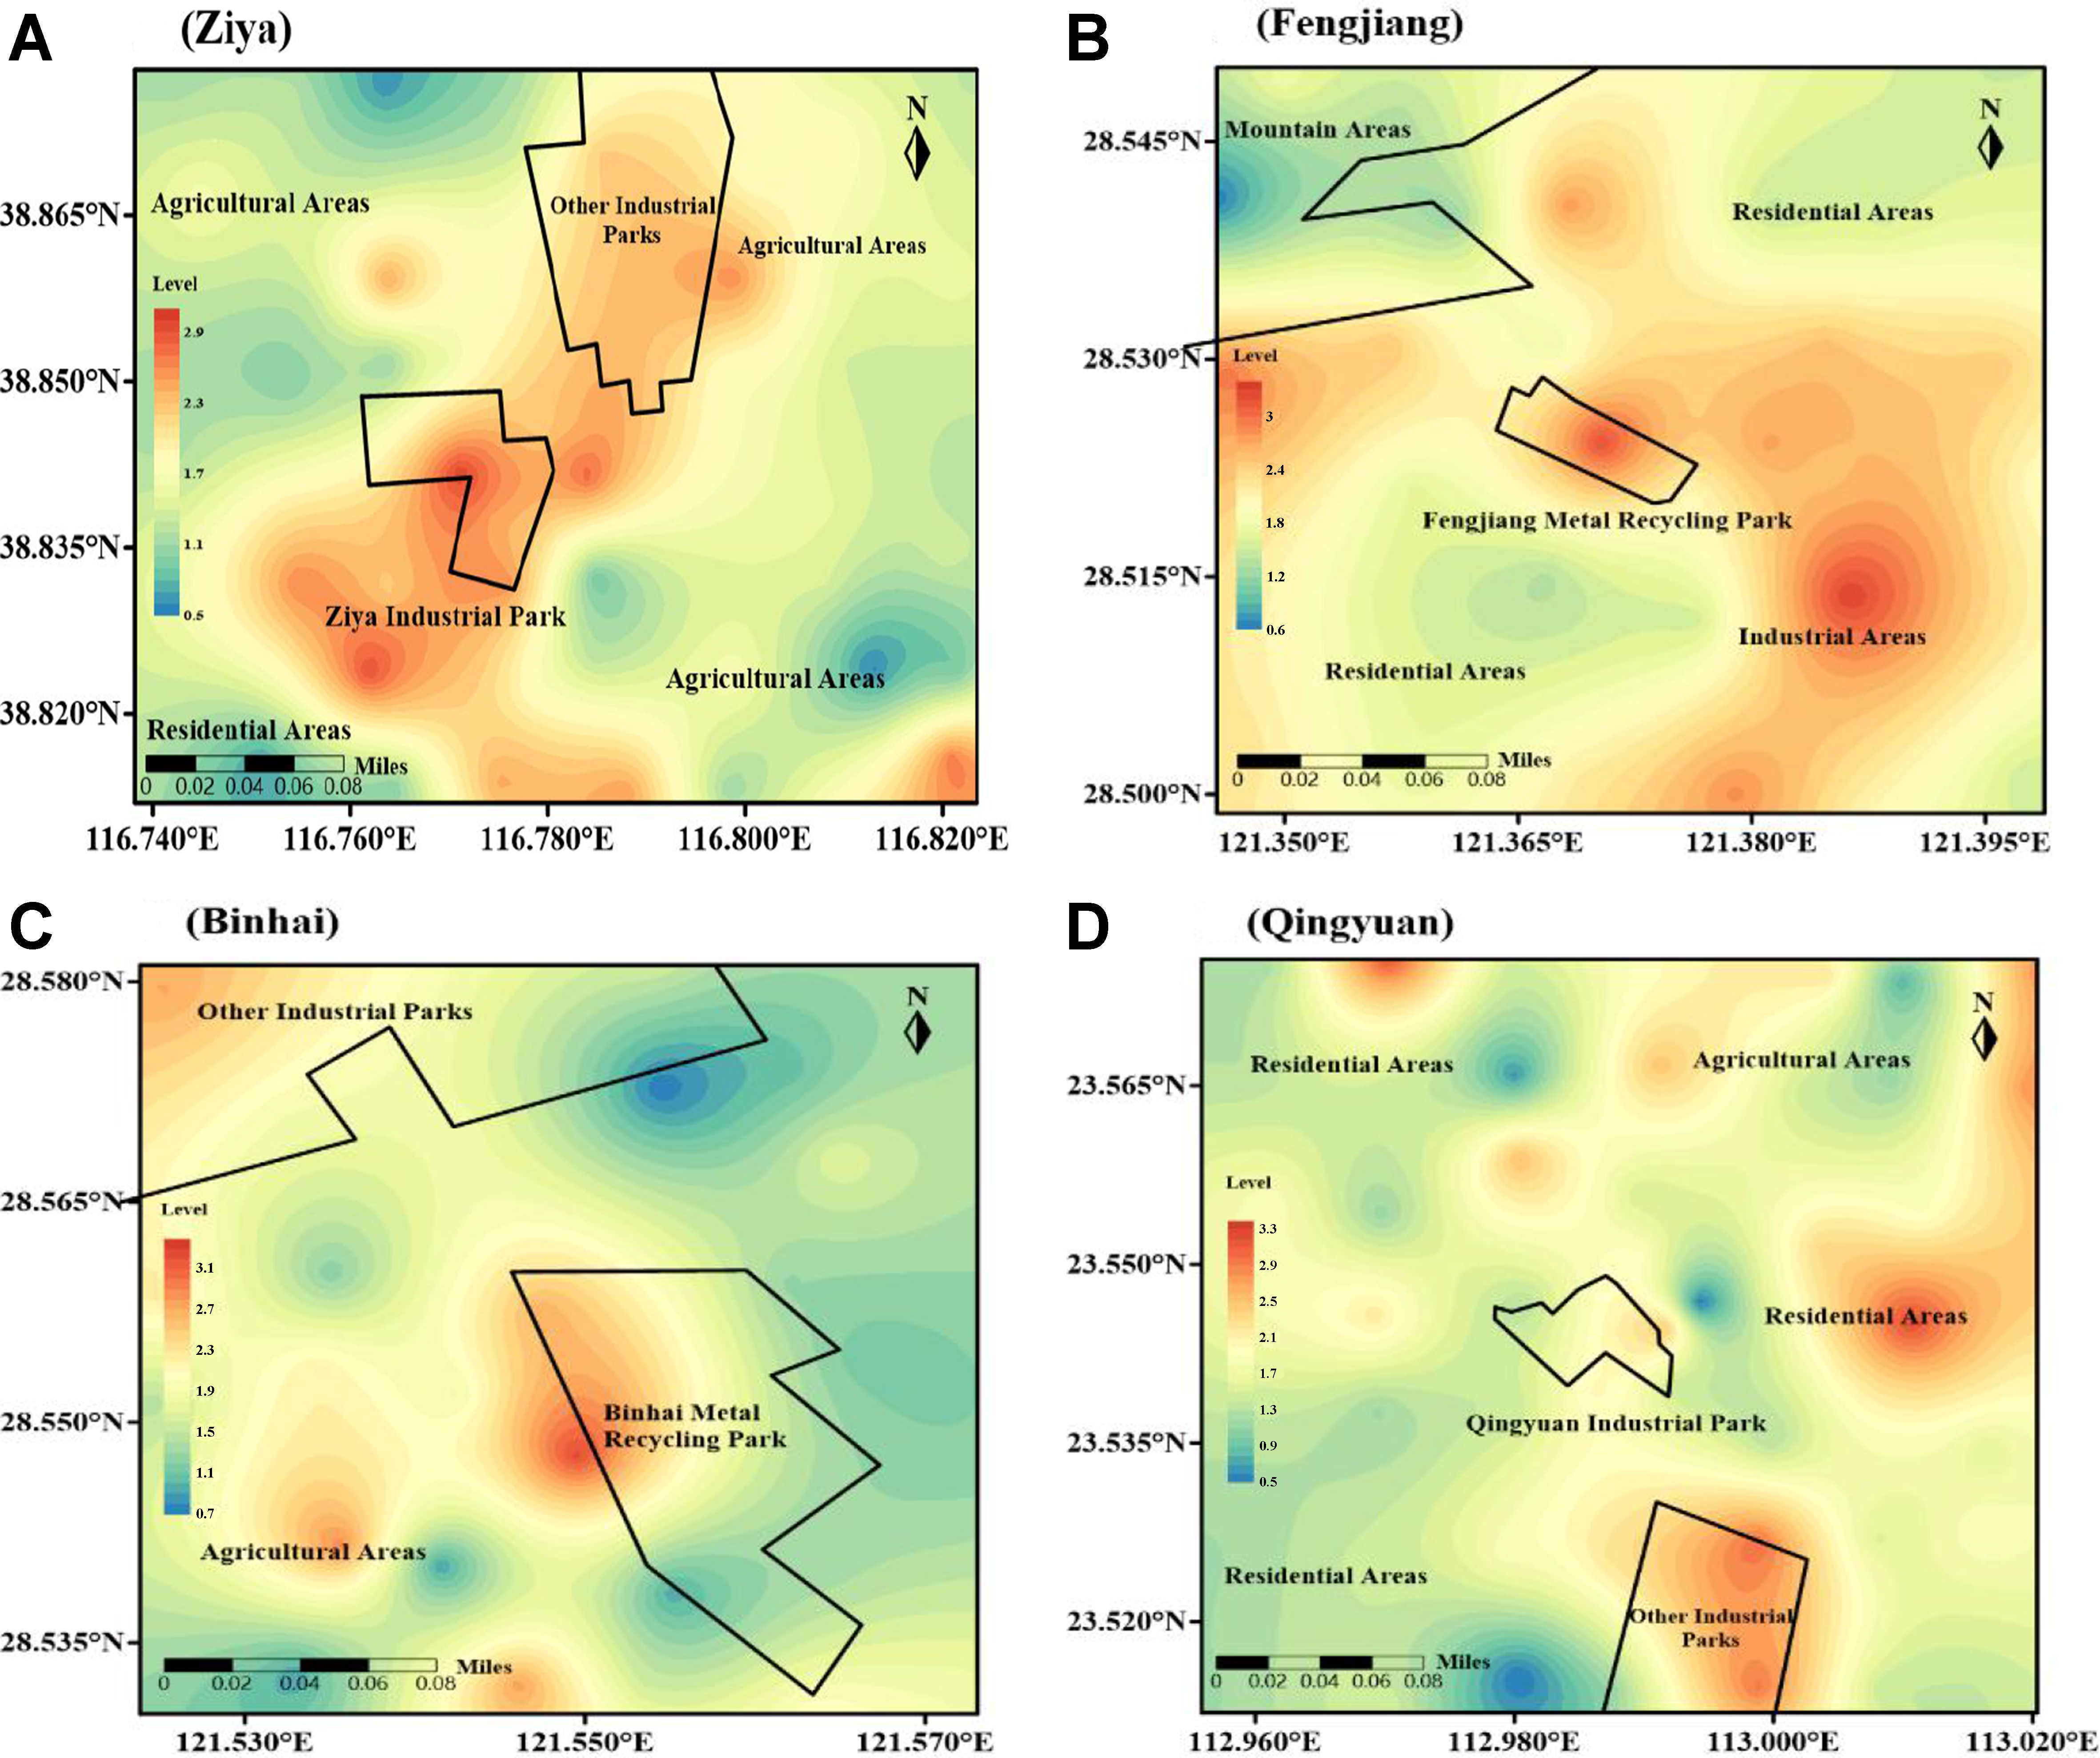
Figure 4. The spatial distributions of Σ10BPs in four E-waste dismantling parks. (A) Ziya circular economy industrial park; (B) Fengjiang metal resource recycling park; (C) Binhai metal resource recycling park; (D) Qingyuan circular economy industrial park. The observed value of each sampling point is increased by one before the logarithmic transformation (log10). Σ10BPs: The total concentration of bisphenol analogues; E-waste: electronic waste.
In ZY [Figure 4A], contamination levels exhibited a south-to-north decreasing trend, with the maximum concentrations (1,029 μg/kg dw) occurring in the southern sector. Notably, the pollution was more significant in the area closer to the park, which was directly related to the factors of intensive industrial activities and high pollutant emission intensity. Although prevailing winds in Tianjin generally flow south-to-north[37], pollutant hotspots showed no downwind extension, indicating that spatial distribution was predominantly controlled by localized emission intensity rather than meteorological dispersion effects. Furthermore, despite the presence of other industrial parks northeast of the park, their contamination levels remained slightly lower than those in ZY, likely due to smaller-scale industrial operations.
In FJ [Figure 4B], the results demonstrated a radial contamination pattern centered around the metal recycling park (2,019 μg/kg dw), with concentrations decreasing northeastward. However, distinct high-concentration point sources (1,693 μg/kg dw) persisted in scattered southeastern industrial areas, highlighting the predominant control of industrial activities on pollutant distribution. Enhanced BP accumulation eastward correlated with springtime easterly wind patterns. Overall, BP concentrations displayed core-to-periphery attenuation patterns radiating from FJ and adjacent industrial clusters, though decay rates and directional trends exhibited spatial heterogeneity influenced by combined geoenvironmental and anthropogenic factors.
Contamination in BH [Figure 4C] was concentrated in the western sector, forming a fan-shaped dispersion into southwestern inland areas. This spatial pattern demonstrates significant coastal zone proximity effects, where persistent land-sea breeze circulation has served as a critical modulator of atmospheric particulate transport pathways, particularly governing the directional migration of industrial emissions. The industrial park’s contamination level (1,841 μg/kg dw) doubled that of adjacent agricultural areas (786 μg/kg dw), a disparity attributable to BP emissions and accumulation during industrial processing operations.
In QY [Figure 4D], contamination patterns reflected both historical legacies and industrial transformation. Soil BP concentrations near decommissioned E-waste dismantling sites (1,043 μg/kg dw) exceeded those in newly constructed industrial areas (107 μg/kg dw) by an order of magnitude, consistent with the region’s historical status as a regional E-waste processing hub. BP hotspots detected northeastward in residential parks suggested dual contamination mechanisms: (1) historical accumulation of persistent soil residues from legacy industrial activities; and (2) ongoing contributions from domestic anthropogenic sources. The spatial correlation between village hotspots and former industrial parks underscores the long-term environmental persistence of BPs, while current human activities continue to drive localized pollution inputs.
Across the four E-waste dismantling parks, BP concentrations exhibited peak values in the E-waste dismantling park, gradually decreasing toward peripheral areas, demonstrating the direct contribution of industrial emissions to soil BP contamination. Pollutants were attenuated with increasing distance from industrial parks through natural processes, including atmospheric dispersion, surface runoff, and vegetation adsorption, forming a characteristic distance-decay pattern. In addition, land-use zoning further modulated contamination distribution: agricultural and residential areas exhibited lower concentrations due to reduced anthropogenic activity or ecological buffering, while pollution loads in transition zones remained elevated under localized influences (e.g., traffic emissions, secondary industrial sources).
EDI and risk assessment
As typical environmental endocrine-disrupting chemicals, BPs have been extensively documented for their health hazards[38,39]. In this study, HQ was employed to evaluate the potential health risks of BPs in soils surrounding E-waste dismantling parks.
Supplementary Table 5 presents the risk of oral exposure to BPA for populations surrounding the four E-waste dismantling parks. The median and 95th percentile EDI ranges were 0.014-0.197 and 0.178-1.50 μg/kg-bw/day, respectively. Children aged 2-12 years exhibited higher median EDI values (0.065-0.197 μg/kg-bw/day) than adults (0.014-0.042 μg/kg-bw/day), indicating elevated BPA exposure risks in this age group. Compared to reported BPA exposure levels (median EDI: 0.039 μg/kg-bw/day) among children in seven Asian countries[40], the exposure in E-waste dismantling parks exceeded these values by 1.7-5.0-fold, suggesting that E-waste activities exacerbate childhood BPA exposure. Using RfD of 50 μg/kg-bw/day, the median HQ ranged from 2.79 × 10⁻⁴ to 3.95 × 10⁻³, and the 95th percentile HQ ranged from 3.56 × 10⁻³ to 3.01 × 10⁻², which are far below the risk threshold of a unit. Similar conclusions were drawn when applying TDI of 4 μg/kg-bw/day, indicating minimal health risks from BPA exposure in these areas. However, when adopting the European Food Safety Authority’s updated TDI (0.2 ng/kg-bw/day, 2023), median and 95th percentile HQ values surged to 987 and 9,710, respectively, which substantially exceed the safety threshold (HQ > 1), thereby confirming non-carcinogenic risks. Monte Carlo simulations further revealed that 97% of the population faced BPA-related health risks under this revised TDI [Figure 5]. These findings underscore the critical importance of selecting appropriate RfDs for risk assessment, given that RfD and TDI values are derived from distinct toxicological endpoints.
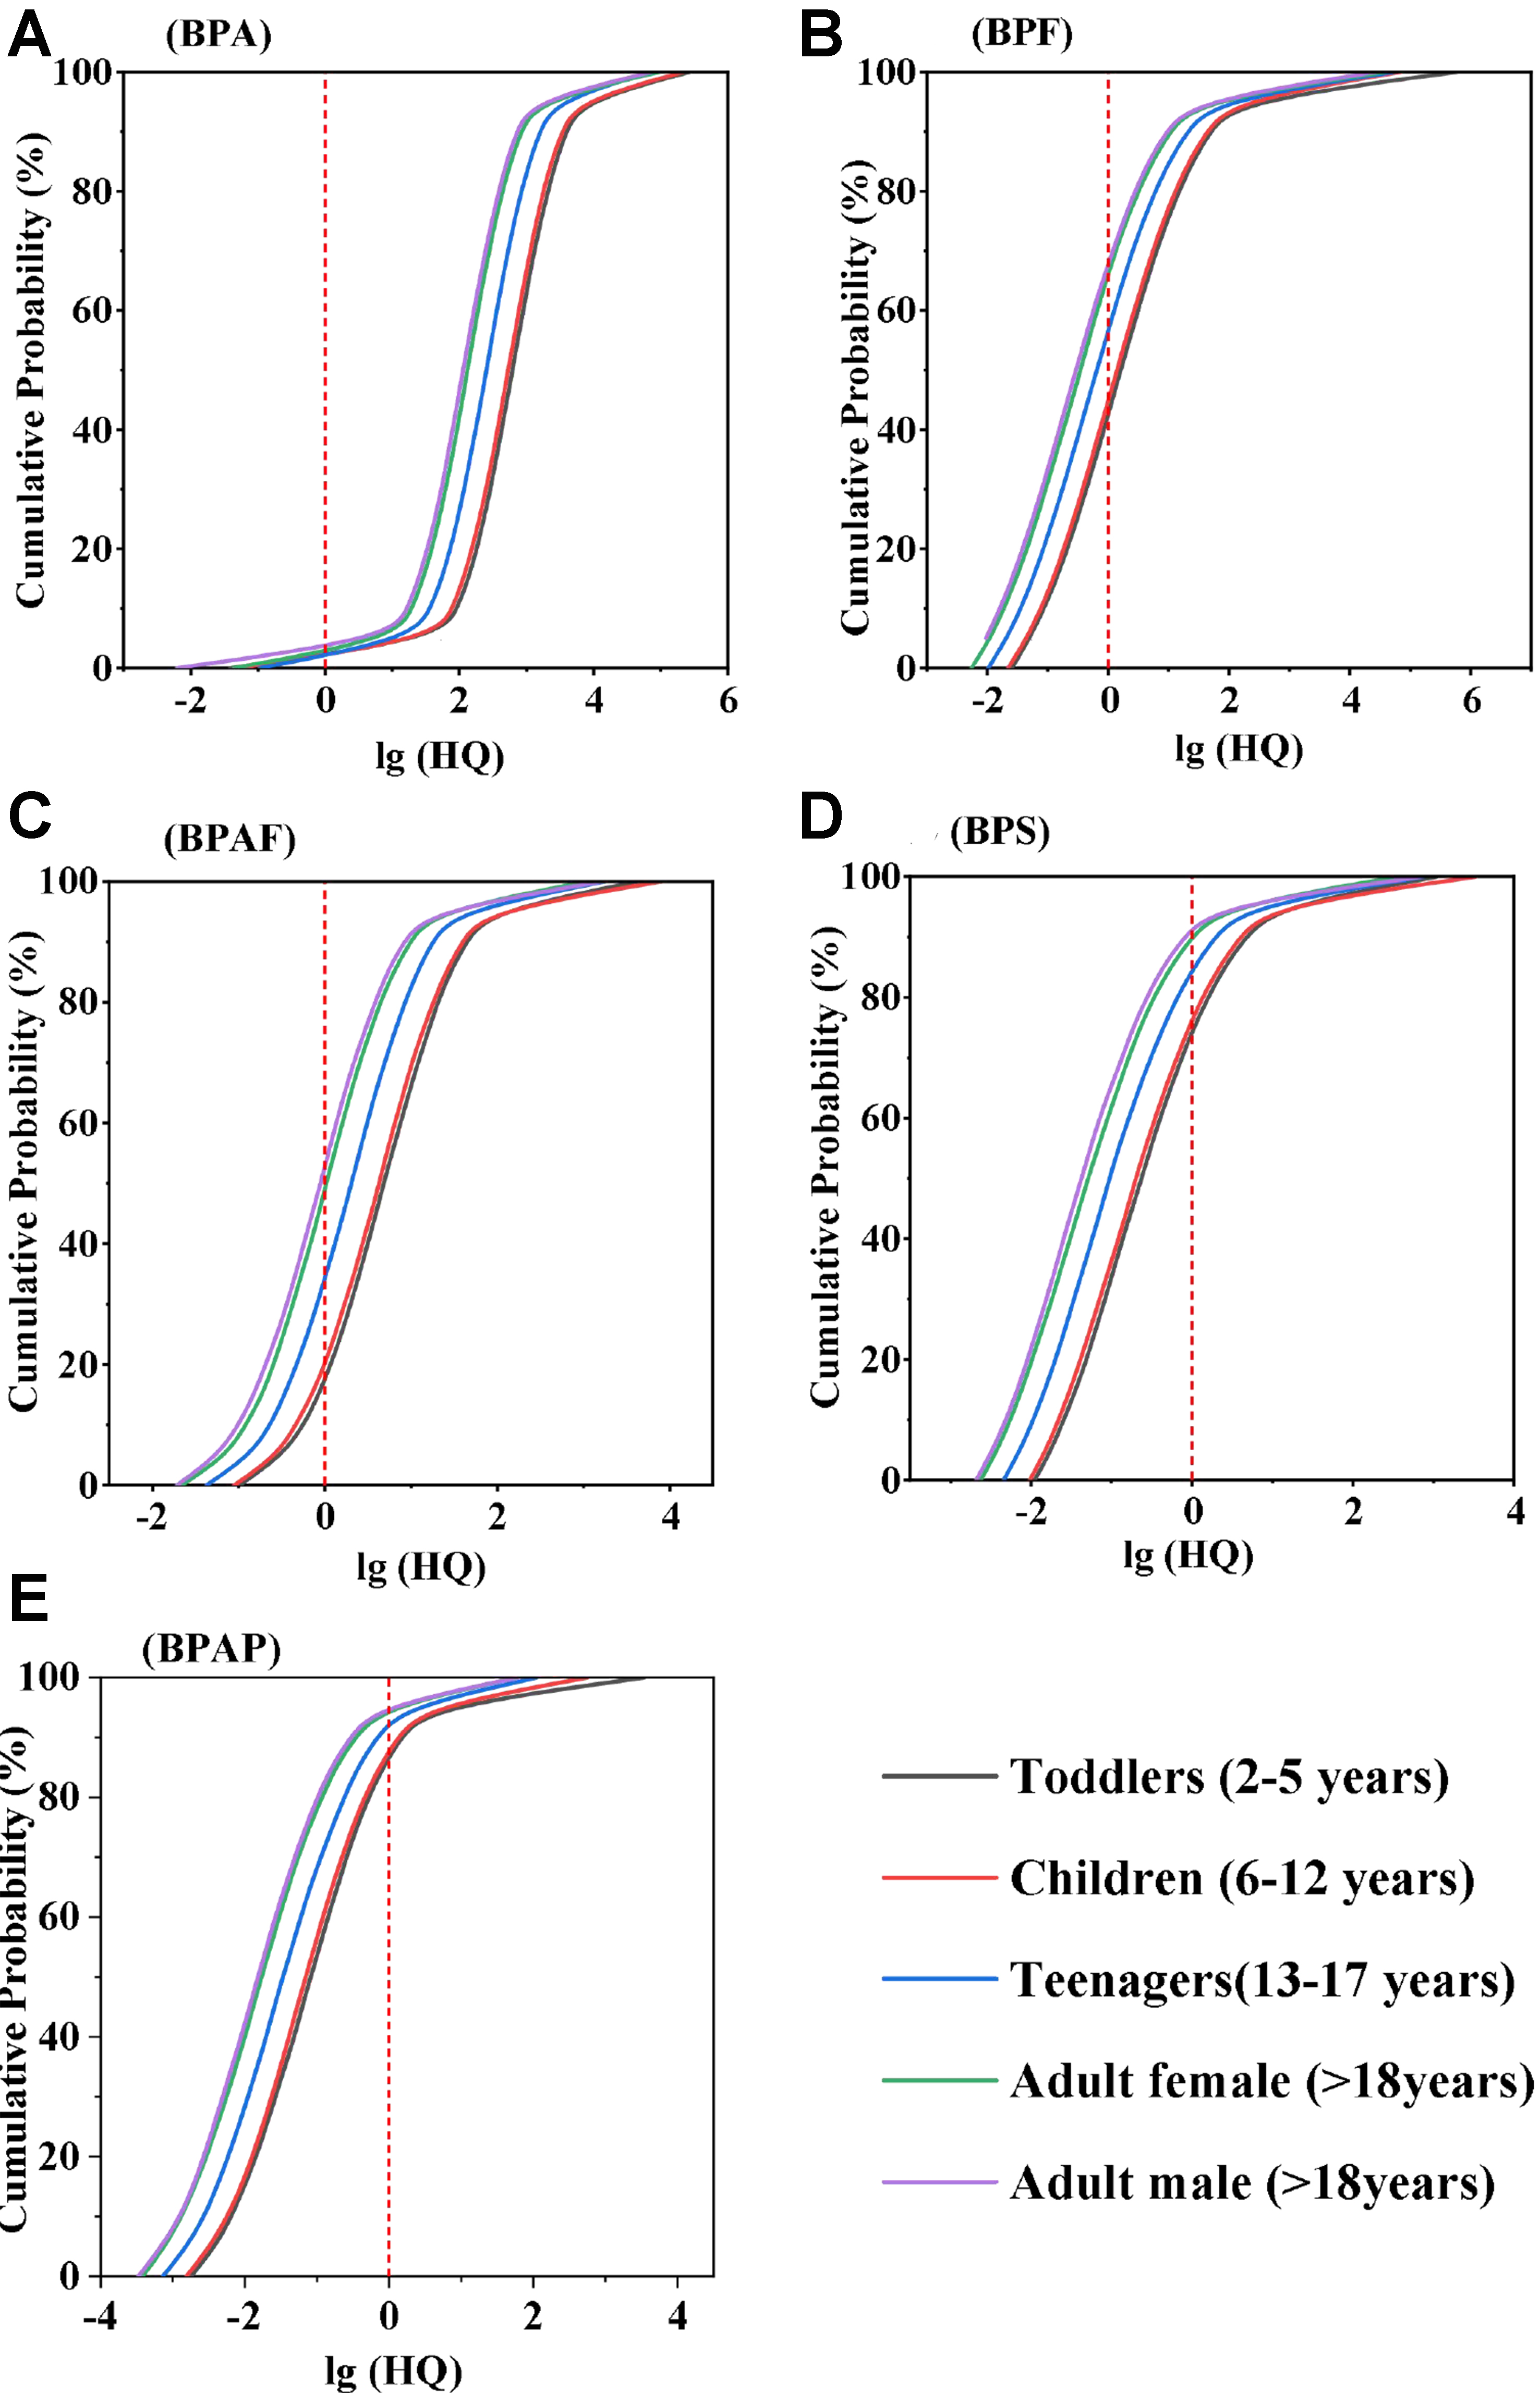
Figure 5. (A) The health risk of BPA exposure was obtained by Monte Carlo simulation based on TDI of 0.2 ng/kg-bw/day; Health risks from Exposure to (B) BPF, (C) BPAF, (D) BPS, and (E) BPAP in Populations Surrounding E-waste dismantling Parks: Monte Carlo Simulation-Based Assessment. BPA: Bisphenol A; TDI: tolerable daily intake; BPF: bisphenol F; BPAF: bisphenol AF; BPS: bisphenol S; BPAP: bisphenol AP; E-waste: electronic waste; HQ: hazard quotient.
Supplementary Tables 6-9 present the EDIs of BPF, BPAF, BPS, and BPAP via oral exposure in soils from the four E-waste dismantling parks, with 95th percentile EDI ranges of 2.3 × 10⁻² - 3.22 × 10⁻¹, 1.5 × 10⁻⁴ - 3.84 × 10⁻³, 3.29 × 10⁻⁴ - 9.28 × 10⁻³, and 4.21 × 10⁻⁴ - 4.56 × 10⁻³ μg/kg-bw/day, respectively. Elevated 95th percentile EDI values in children aged 2-12 years, compared to adults, were attributed to their lower body weight and ongoing physiological development, which may amplify chemical exposure impacts[41]. Non-carcinogenic risks were assessed through HQ calculated using RfDs of 8.09, 0.04, 0.37, and 2.31 ng/kg-bw/day for BPF, BPAF, BPS, and BPAP, respectively. The 95th percentile HQs across age groups were 2.88-39.9 for BPF, 3.75-96.11 for BPAF, 0.9-25.1 for BPS, and 0.18-1.97 for BPAP, with HQ values exceeding 1 signaling potential non-carcinogenic risk. Additionally, Monte Carlo simulation analysis revealed that 60%, 80%, 25%, and 15% of the population were at risk of exposure to BPF, BPAF, BPS, and BPAP, respectively. The present study indicates that the health risks posed by BPs in these areas deserve more attention. Additionally, Supplementary Table 10 presents the HI values for oral exposure to BPs among different age groups in populations surrounding the four E-waste dismantling parks. The results demonstrate that all HI values for BPs are greater than 1, indicating that BPs in the soil pose non-carcinogenic risks.
To assess the health risks of dermal contact with soil BPs for populations near four E-waste dismantling parks, this study calculated the EDI, HQ, and HI for five target BPs (BPA, BPF, BPAF, BPS, and BPAP). Results are detailed in Supplementary Tables 5-10. The 95th percentile EDI values for BPA, BPF, BPAF, BPS, and BPAP ranged from 1.94 × 10⁻⁵ - 1.65 × 10⁻⁴, 2.54 × 10⁻⁶ - 2.74 × 10⁻⁵, 1.63 × 10⁻⁸ - 3.27 × 10⁻⁷, 3.55 × 10⁻⁸ - 7.9 × 10⁻⁷, and 4.59 × 10⁻⁸ - 3.84 × 10⁻⁷ μg/kg-bw/day, respectively. Toddlers and children exhibited higher dermal exposure to BPs than adults, primarily due to their underdeveloped metabolic systems and heightened susceptibility to contaminants. Compared to oral exposure, dermal exposure levels for all five BPs were approximately three orders of magnitude lower, indicating that oral ingestion is the primary exposure pathway for human intake of BPs. Furthermore, HQ and HI values across all age groups were below 1 (HQ < 1, HI < 1), demonstrating that dermal exposure to BPs poses no non-carcinogenic health risks. Nevertheless, targeted risk assessments remain necessary for occupational cohorts or specific high-exposure scenarios.
Study limitations
This study has several limitations. First, the absence of soil samples collected from within the E-waste dismantling park prevented investigation into the pollution profiles associated with different processing techniques, and hindered comparative analysis of BPs composition inside versus outside the park. Second, the study did not examine BPs pollution in other environmental media such as atmospheric and aquatic systems around the park. Integrating BPs detection results from multiple environmental matrices would enable a more systematic investigation of their environmental behaviors in the surrounding area. Third, potential sources of BPs exposure for local populations - such as dietary patterns (e.g., canned foods, bottled water) and plastic packaging usage - were not assessed, limiting a comprehensive evaluation of BPs origins. Finally, the study lacked quantification of BPs bioavailability in soil and their migration and accumulation risks in crops. Factors including soil organic matter content and pH, which influence BP bioavailability, were not addressed.
CONCLUSIONS
This study investigated the occurrence of 10 representative BPs in soils surrounding four E-waste recycling parks (ZY, FJ, BH, and QY) in China. BPA, BPF, BPAF, and TBBPA were ubiquitously detected across all parks, with BPA emerging as the predominant congener, followed by TBBPA and BPF. Correlation and PCA revealed significant positive interrelationships among BPA, BPF, and TBBPA, which collectively exhibited high loadings on PC1. This homologous origin was strongly linked to combustion processes in E-waste dismantling. Spatial distribution patterns demonstrated BP contamination radiating from industrial cores with concentration gradients declining peripherally, underscoring industrial emissions as the primary contributor. However, elevated BPs levels were also identified in residential areas, agricultural parks, and adjacent industrial parks, suggesting supplementary pollution sources. Notably, EDI values for BPA, BPF, BPAF, BPS, and BPAP via soil ingestion exceeded adult levels in minors (2-12 years), indicating heightened exposure risks for this demographic. When applying the EFSA-recommended TDI of 0.2 ng/kg-bw/day for BPA, Monte Carlo simulations projected 97% of the population to face health risks. Similarly, Monte Carlo simulation results for BPF, BPAF, BPS, and BPAP indicated some of the populations were at risk of exposure, respectively. This study indicates that more attention should be paid to the human health risks posed by bisphenol compounds.
DECLARATIONS
Authors’ contributions
Methodology, data analysis and draft preparation: Jiang, K.
Sampling, methodology and data analysis: Yan, J.
Methodology: Ouyang, R.
Data analysis: Mao, Y.; Huang, Z.
Design, reviewing and editing: Long, C.
Availability of data and materials
Information related to this article can be found in Supplementary Figure 1 and Supplementary Tables 1-10. Further data are available from the corresponding author upon reasonable request.
Financial support and sponsorship
The study was supported by the Talent Project of Center for Disease Prevention and Control of Guangdong Province (2024D344) and the Guangdong-Hong Kong-Macao Joint Laboratory for Contaminants Exposure and Health (2020B1212030008).
Conflicts of interest
Jiang, K. and Long, C. are affiliated with the Center for Disease Prevention and Control of Guangdong Province. They declared no competing financial interests or personal relationships that could have influenced the work reported in this study. The other authors declared that there are no conflicts of interest.
Ethical approval and consent to participate
Not applicable.
Consent for publication
Not applicable.
Copyright
© The Author(s) 2025.
Supplementary Materials
REFERENCES
1. Zhang, K.; Schnoor, J. L.; Zeng, E. Y. E-waste recycling: where does it go from here? Environ. Sci. Technol. 2012, 46, 10861-7.
2. Xu, X.; Zeng, X.; Boezen, H. M.; Huo, X. E-waste environmental contamination and harm to public health in China. Front. Med. 2015, 9, 220-8.
3. Huang, S.; Wang, D.; Qi, Z.; Long, C.; Li, G.; Yu, Y. A large-scale nationwide study of urinary phenols in the Chinese population. Sci. Total. Environ. 2023, 894, 164850.
4. Luo, D.; Pan, Y.; Zeng, L.; Du, B.; Li, J.; Mei, S. Occurrence of multiple bisphenol S derivatives in breast milk from Chinese lactating women and implications for exposure in breast-fed infants. Environ. Sci. Technol. Lett. 2021, 8, 176-82.
5. Zhang, T.; Xue, J.; Gao, C. Z.; et al. Urinary concentrations of bisphenols and their association with biomarkers of oxidative stress in people living near E-waste recycling facilities in China. Environ. Sci. Technol. 2016, 50, 4045-53.
6. Du, B.; Shen, M.; Chen, H.; et al. Beyond traditional organophosphate triesters: prevalence of emerging organophosphate triesters and organophosphate diesters in indoor dust from a mega E-waste Recycling Industrial Park in South China. Environ. Sci. Technol. 2020, 54, 12001-12.
7. Lu, S.; Yang, D.; Ge, X.; et al. The internal exposure of phthalate metabolites and bisphenols in waste incineration plant workers and the associated health risks. Environ. Int. 2020, 145, 106101.
8. Wu, Y.; Li, Y.; Kang, D.; et al. Tetrabromobisphenol A and heavy metal exposure via dust ingestion in an E-waste recycling region in Southeast China. Sci. Total. Environ. 2016, 541, 356-64.
9. Fu, P.; Kawamura, K. Ubiquity of bisphenol A in the atmosphere. Environ. Pollut. 2010, 158, 3138-43.
10. Owens, C.V. Jr; Lambright, C.; Bobseine, K.; et al. Identification of estrogenic compounds emitted from the combustion of computer printed circuit boards in electronic waste. Environ. Sci. Technol. 2007, 41, 8506-11.
11. Pan, Y.; Xie, R.; Wei, X.; Li, A. J.; Zeng, L. Bisphenol and analogues in indoor dust from E-waste recycling sites, neighboring residential homes, and urban residential homes: implications for human exposure. Sci. Total. Environ. 2024, 907, 168012.
12. Chen, D.; Kannan, K.; Tan, H.; et al. Bisphenol analogues other than BPA: environmental occurrence, human exposure, and toxicity - a review. Environ. Sci. Technol. 2016, 50, 5438-53.
13. Bittner, G. D.; Yang, C. Z.; Stoner, M. A. Estrogenic chemicals often leach from BPA-free plastic products that are replacements for BPA-containing polycarbonate products. Environ. Health. 2014, 13, 41.
14. Zeng, K.; Zhang, Z.; Liu, L.; et al. A typical derivative and byproduct of tetrabromobisphenol A: development of novel high-throughput immunoassays and systematic investigation of their distributions in Taizhou, an e-waste recycling area in eastern China. Environ. Pollut. 2020, 263, 114382.
15. Czarny-Krzymińska, K.; Krawczyk, B.; Szczukocki, D. Bisphenol A and its substitutes in the aquatic environment: occurrence and toxicity assessment. Chemosphere 2023, 315, 137763.
16. Yu, Y.; Hao, C.; Xiang, M.; Tian, J.; Kuang, H.; Li, Z. Potential obesogenic effects of TBBPA and its alternatives TBBPS and TCBPA revealed by metabolic perturbations in human hepatoma cells. Sci. Total. Environ. 2022, 832, 154847.
17. Li, X.; Wang, X.; Liu, Y.; Zhu, H.; Wang, L. First evidence of occupational and residential exposure to bisphenols associated with an E-waste dismantling site: a case study in China. Ecotoxicol. Environ. Saf. 2023, 263, 115206.
18. Pal, S.; Sahu, A.; Verma, R.; Haldar, C. BPS-induced ovarian dysfunction: protective actions of melatonin via modulation of SIRT-1/Nrf2/NFĸB and IR/PI3K/pAkt/GLUT-4 expressions in adult golden hamster. J. Pineal. Res. 2023, 75, e12869.
19. Duan, Y.; Yao, Y.; Wang, B.; et al. Association of urinary concentrations of bisphenols with type 2 diabetes mellitus: a case-control study. Environ. Pollut. 2018, 243, 1719-26.
20. Kim, J. I.; Lee, Y. A.; Shin, C. H.; Hong, Y. C.; Kim, B. N.; Lim, Y. H. Association of bisphenol A, bisphenol F, and bisphenol S with ADHD symptoms in children. Environ. Int. 2022, 161, 107093.
21. GB 17378.2-2007. The specification for marine monitoring - Part 2: Data processing and quality control of analysis. 2007. https://codeofchina.com/standard/GB17378.2-2007.html. (accessed 11 Oct 2025).
22. Weng, C. Y.; Zhang, Y. Y.; Zhu, F. J.; Jia, S. M.; Ma, W. L. National investigation of bisphenols in the surface soil in China. Sci. Total. Environ. 2024, 956, 177319.
23. Yang, X.; Dai, C.; Zheng, G.; et al. Bisphenol analogues in soils and lettuce (Lactuca sativa L.) around typical factories in eastern China: occurrence, contamination characteristics, and health risks. Environ. Pollut. 2025, 373, 126126.
24. Song, S.; Ruan, T.; Wang, T.; Liu, R.; Jiang, G. Distribution and preliminary exposure assessment of bisphenol AF (BPAF) in various environmental matrices around a manufacturing plant in China. Environ. Sci. Technol. 2012, 46, 13136-43.
25. Brand, E.; Otte, P. F.; Lijzen, J. P. A. CSOIL 2000: an exposure model for human risk assessment of soil contamination: a model description. 2007. https://www.rivm.nl/bibliotheek/rapporten/711701054.pdf. (accessed 11 Oct 2025).
26. United States Environmental Protection Agency. Integrated risk information system. Bisphenol A. CASRN 80-05-7 | DTXSID7020182. https://iris.epa.gov/ChemicalLanding/&substance_nmbr=356. (accessed 11 Oct 2025).
27. EFSA Panel on Food Contact Materials, Enzymes, Flavourings and Processing Aids (CEF). Scientific opinion on the risks to public health related to the presence of bisphenol a (BPA) in foodstuffs. Part II - BPA oxicological assessment and risk characterisation. EFSA. J. 2015, 13, 3978.
28. EFSA Panel on Food Contact Materials, Enzymes and Processing Aids (CEP); Lambré, C.; Barat Baviera, J. M.; Bolognesi, C.; et al. Re-evaluation of the risks to public health related to the presence of bisphenol a (BPA) in foodstuffs. EFSA J. 2023, 21, 6857.
29. Cao, J.; Ma, W.; Gao, Y.; Long, C.; Yu, Y. Derivation of the oral reference dose (RfD) for bisphenol S and bisphenol F based on epidemiological and experimental studies. Ecotoxicol. Environ. Saf. 2025, 293, 118045.
30. Xia, Y.; Ma, W.; Cao, J.; Gao, Y.; Yu, Y.; Long, C. Oral reference dose (RfD) derivation for five bisphenol A alternatives integrating BMD and NOAEL/LOAEL approaches. Ecotoxicol. Environ. Saf. 2025, 303, 118911.
31. Liu, K.; Li, J.; Yan, S.; Zhang, W.; Li, Y.; Han, D. A review of status of tetrabromobisphenol A (TBBPA) in China. Chemosphere 2016, 148, 8-20.
32. Ge, X.; Ma, S.; Huo, Y.; et al. Mixed bromine/chlorine transformation products of tetrabromobisphenol A: potential specific molecular markers in E-waste dismantling areas. J. Hazard. Mater. 2022, 423, 127126.
33. Fu, J.; Zhang, A.; Wang, T.; et al. Influence of E-waste dismantling and its regulations: temporal trend, spatial distribution of heavy metals in rice grains, and its potential health risk. Environ. Sci. Technol. 2013, 47, 7437-45.
34. Zhao, L.; Zhou, F.; Wang, S.; et al. Bisphenol chemicals in surface soil from E-waste dismantling facilities and the surrounding areas: spatial distribution and health risk. Toxics 2024, 12, 379.
35. Huang, D. Y.; Zhao, H. Q.; Liu, C. P.; Sun, C. X. Characteristics, sources, and transport of tetrabromobisphenol A and bisphenol A in soils from a typical e-waste recycling area in South China. Environ. Sci. Pollut. Res. Int. 2014, 21, 5818-26.
36. Wei, D.; Yuan, K.; Ai, F.; et al. Occurrence, spatial distributions, and temporal trends of bisphenol analogues in an E-waste dismantling area: implications for risk assessment. Sci. Total. Environ. 2023, 867, 161498.
37. Wu, Z.; Han, W.; Xie, M.; Han, M.; Li, Y.; Wang, Y. Occurrence and distribution of polybrominated diphenyl ethers in soils from an E-waste recycling area in northern China. Ecotoxicol. Environ. Saf. 2019, 167, 467-75.
38. Qiu, W.; Liu, S.; Chen, H.; et al. The comparative toxicities of BPA, BPB, BPS, BPF, and BPAF on the reproductive neuroendocrine system of zebrafish embryos and its mechanisms. J. Hazard. Mater. 2021, 406, 124303.
39. Hyun, M.; Rathor, L.; Kim, H. J.; et al. Comparative toxicities of BPA, BPS, BPF, and TMBPF in the nematode Caenorhabditis elegans and mammalian fibroblast cells. Toxicology 2021, 461, 152924.
40. Zhang, Z.; Alomirah, H.; Cho, H. S.; et al. Urinary bisphenol A concentrations and their implications for human exposure in several Asian countries. Environ. Sci. Technol. 2011, 45, 7044-50.
Cite This Article
How to Cite
Download Citation
Export Citation File:
Type of Import
Tips on Downloading Citation
Citation Manager File Format
Type of Import
Direct Import: When the Direct Import option is selected (the default state), a dialogue box will give you the option to Save or Open the downloaded citation data. Choosing Open will either launch your citation manager or give you a choice of applications with which to use the metadata. The Save option saves the file locally for later use.
Indirect Import: When the Indirect Import option is selected, the metadata is displayed and may be copied and pasted as needed.
About This Article
Special Topic
Copyright

Data & Comments
Data
0


Comments
Comments must be written in English. Spam, offensive content, impersonation, and private information will not be permitted. If any comment is reported and identified as inappropriate content by OAE staff, the comment will be removed without notice. If you have any queries or need any help, please contact us at [email protected].