

Associations between heavy metal(loid) exposure and renal function: a cross-sectional study in Dutch kidney patients and kidney donors
 0
0 
Abstract
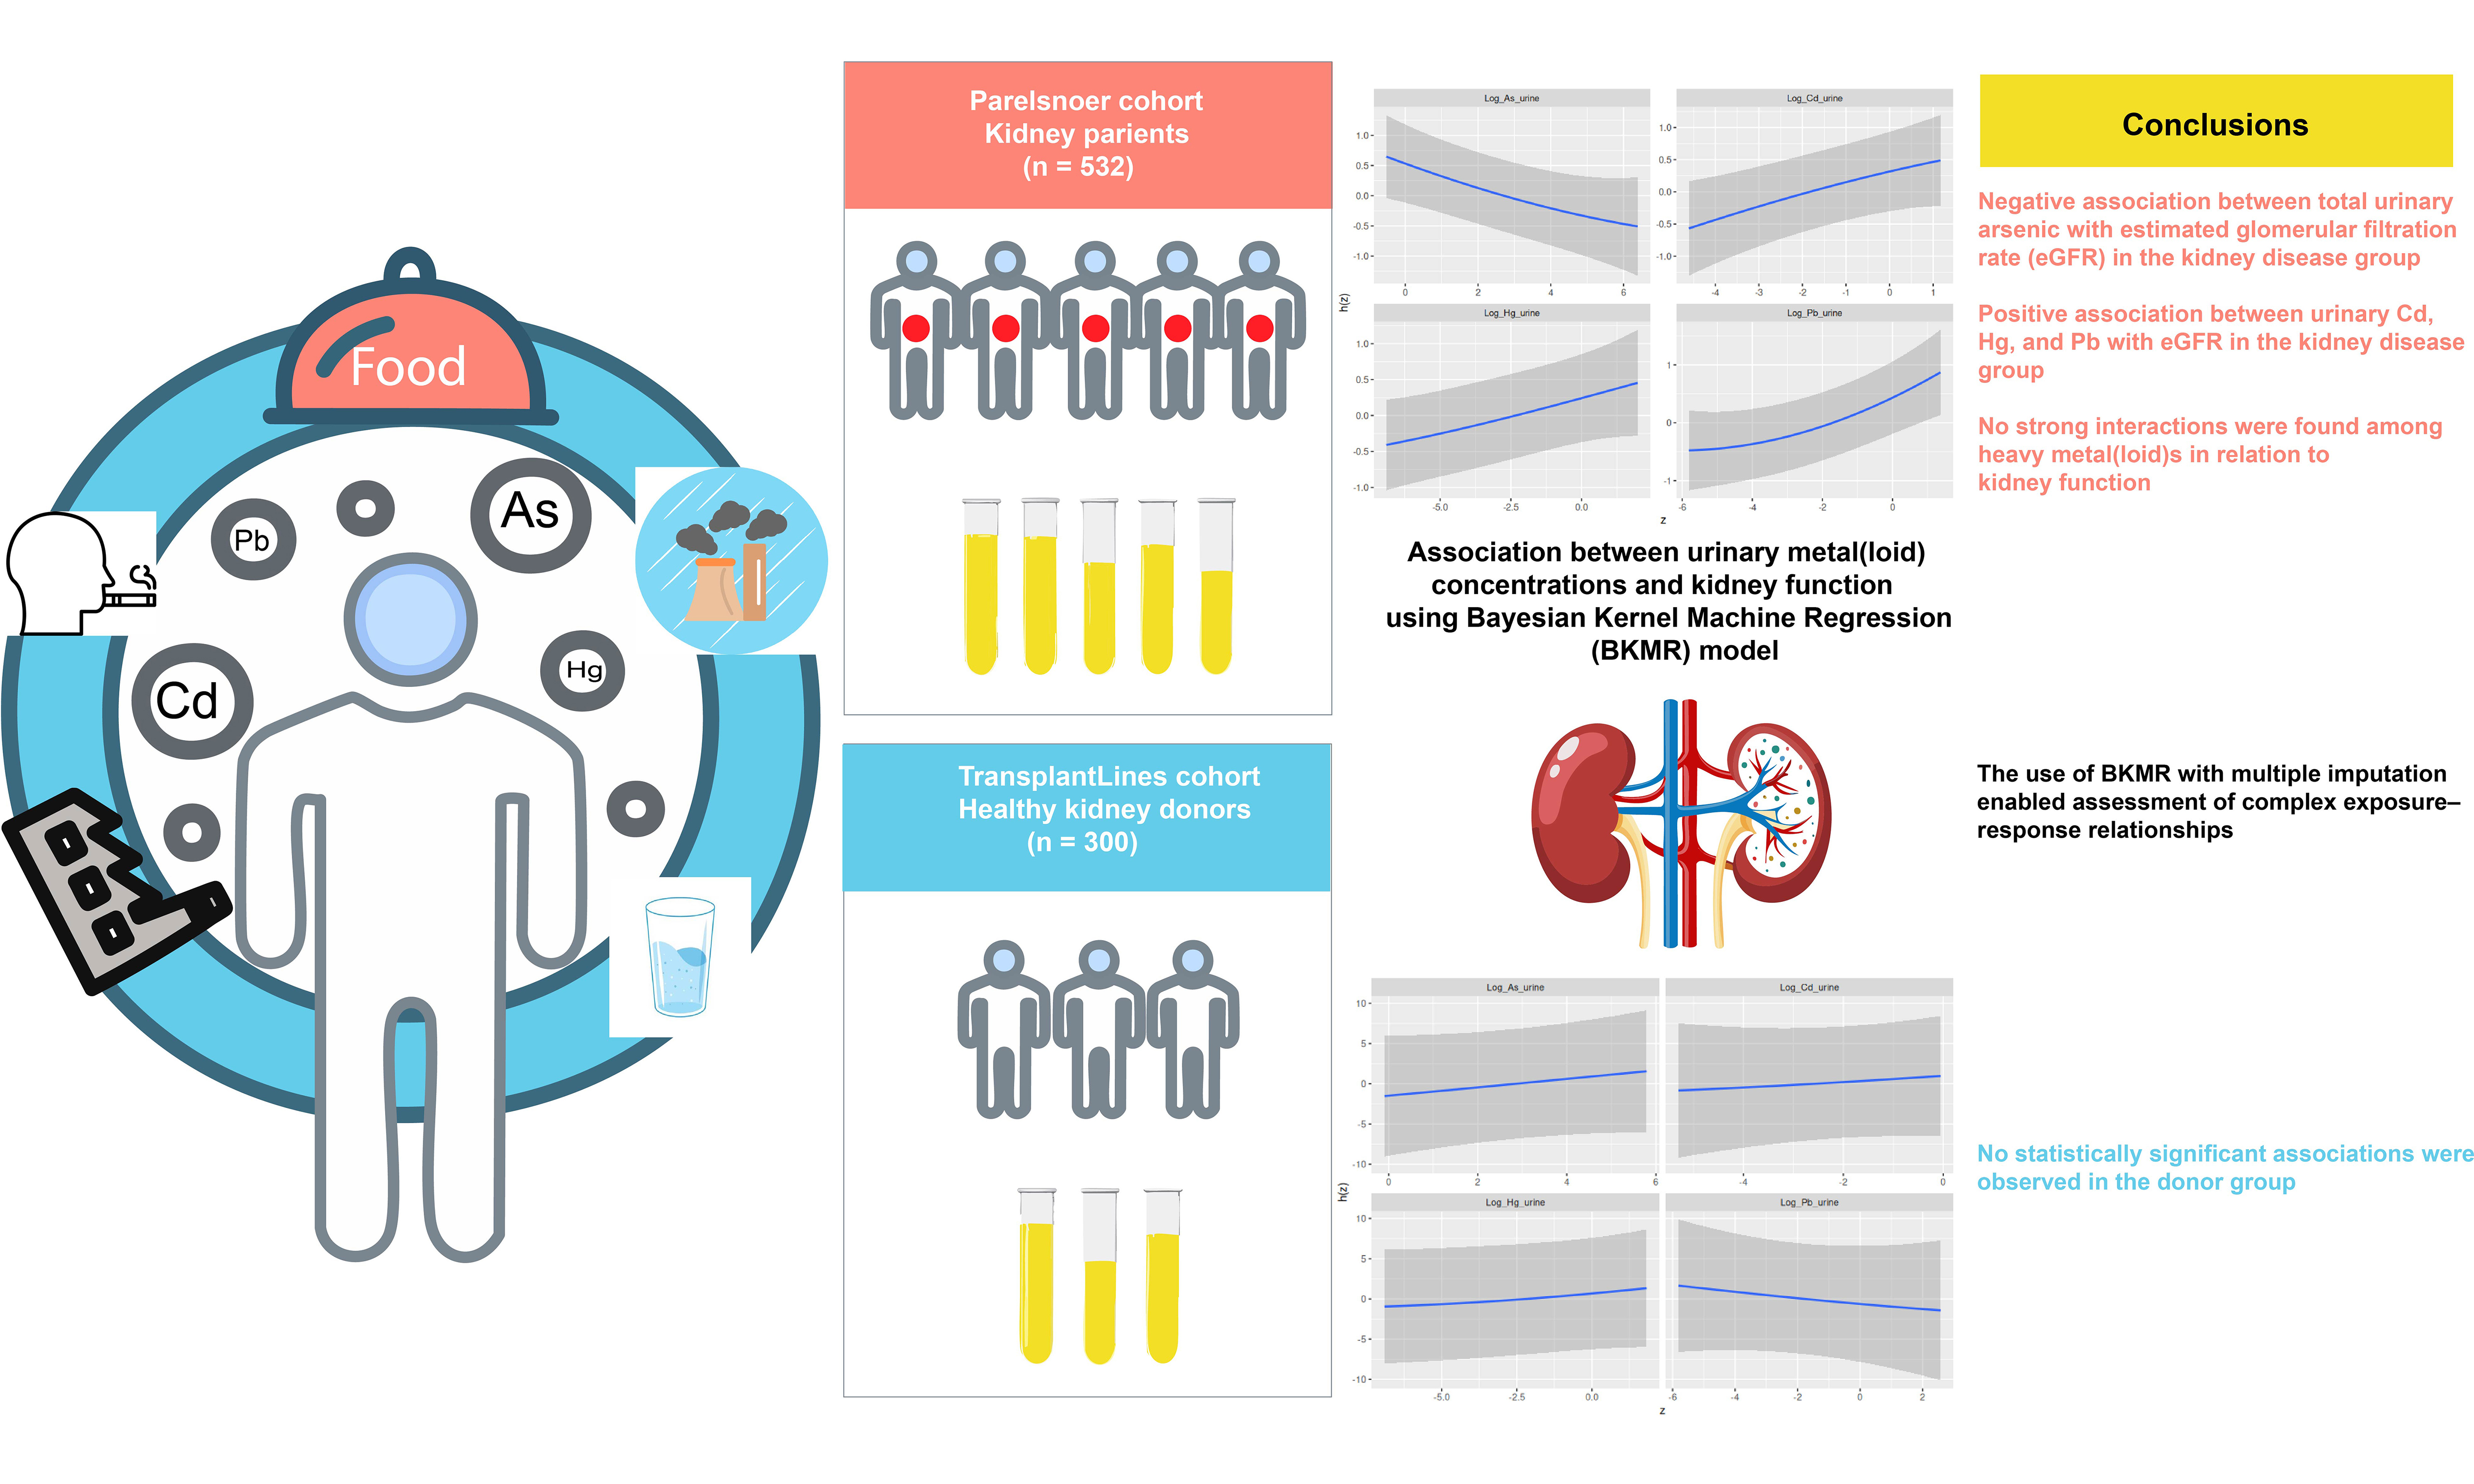
Certain heavy metal(loid)s are established nephrotoxicants; however, the associations between metal(loid) exposure and renal function remain complex and may be confounded in observational studies. This study investigated the relationships between urinary concentrations of total arsenic (As), cadmium (Cd), mercury (Hg), and lead (Pb) and estimated glomerular filtration rate (eGFR) in two distinct Dutch populations: individuals with kidney disease (the disease group) and healthy kidney donors prior to nephrectomy (the donor group). We applied a Bayesian Kernel Machine Regression (BKMR) model with multiple imputation to assess both individual and combined associations between urinary metal(loid) concentrations and eGFR using cross-sectional data. In the disease group, urinary Cd, Hg, and Pb concentrations showed weak positive associations with eGFR, whereas urinary total As concentrations were weakly negatively associated with eGFR. Further mechanistic studies are warranted to explain these findings. No statistically significant associations were found in the donor group, possibly due to compensatory renal mechanisms. No strong interactions were detected among heavy metal(loid)s in relation to renal function. Model diagnostics confirmed the robustness of the results.
Keywords
INTRODUCTION
Over the past century, industrial processes have significantly increased human exposure to heavy metals[1]. Among these heavy metals, arsenic (As), cadmium (Cd), mercury (Hg), and lead (Pb) pose the greatest threats to human health[2]. Although As is a metalloid, it is often classified as a heavy metal. These heavy metal(loid)s have been extensively studied, and their effects on human health are regularly reviewed by international bodies such as the World Health Organization (WHO) (Chemical Safety and Health).
The kidney is a primary target organ for heavy metal toxicity due to its capability to reabsorb and concentrate divalent ions and metals[3]. The extent and manifestation of renal damage depend on the type and chemical form of the metal, the dose, and the duration of exposure. Both acute and chronic heavy metal intoxication can cause nephropathy, with severity ranging from tubular dysfunction - such as acquired Fanconi syndrome - to various stages of chronic kidney disease (CKD), including renal failure, which may occasionally be fatal[4].
Fortunately, the kidney possesses a remarkable capacity to compensate for the loss of functional mass[5]. Experimental studies have shown that after unilateral nephrectomy, the glomerular filtration rate (GFR) of the remaining kidney can increase by 40%-60%, primarily due to elevated glomerular plasma flow and hydraulic pressure[6]. This rise in single-nephron GFR is typically accompanied by a proportional increase in tubular reabsorption, thereby maintaining glomerulotubular balance and masking early renal functional impairments during standard clinical assessment. As a result, chemically induced renal damage may remain undetected until compensatory mechanisms are exhausted by substantial nephron loss or injury[6]. Individuals with compromised renal function - due to aging, disease, or both - may therefore be more vulnerable to the effects of environmental toxicants[7].
In a previous study by de Wit-Bos et al.[8], data from 21,409 individuals aged 50 years or older - obtained from the US National Health and Nutrition Examination Survey (NHANES) biennial surveys between 1999 and 2018 - were used to assess the health risks of Cd and Pb exposure. The analysis showed no clear exposure-response relationship between blood Cd and Pb concentrations and estimated glomerular filtration rate (eGFR), except in individuals aged 75 years and older. A potential explanation provided in that study is that age-related renal decline may decrease the kidney’s compensatory capacity (i.e., its ability to maintain function despite damage), thereby making exposure-response relationships more detectable in older individuals.
Whether the association between heavy metal(loid)s exposure and renal function differs between vulnerable populations and healthy individuals has rarely been studied. Only a few studies in patients with diabetes or hypertension have been described[9,10]. To address this gap, the present study investigates the relationship between exposure to selected heavy metal(loid)s and eGFR, with a particular focus on differences between individuals with known kidney diseases and those considered healthy. This analysis aims to improve our understanding of differential susceptibility to heavy metal-induced nephrotoxicity across population subgroups.
Assessing the association between heavy metal(loid)s exposure and renal function is challenging due to possible interactions among heavy metal(loid)s. Accounting for such interactions among four metal(loid)s requires a highly flexible modeling approach. Bayesian Kernel Machine Regression (BKMR), first proposed by Bobb et al.[11], combines Bayesian and statistical learning methods to regress exposure-response functions using Gaussian kernel functions. It was developed specifically to assess the effects of multi-pollutant mixtures on health outcomes[12]. The flexibility of the model is largely data-driven. A further advantage of BKMR is its capacity to incorporate a relatively large number of covariates while simultaneously modeling complex interactions among exposures. This makes it particularly well-suited for environmental health research, where high-dimensional covariate structures are common and confounding adjustment is critical. BKMR has been widely applied in environmental health studies[13-16].
The aims of the present study are: (1) to measure urinary concentrations of heavy metal(loid)s in kidney patients and healthy individuals; and (2) to examine the association between urinary heavy metal(loid) concentrations and renal function within each group. To assess potential nonlinear exposure-response relationships and interactions among co-exposures, BKMR was applied to both groups.
EXPERIMENTAL
Sample collection
Twenty-four-hour urine samples were collected once from 532 patients with kidney disease at the time of enrolment in the Parelsnoer National Registry for Renal Function (NRF) cohort at the University Medical Center Groningen, the Netherlands. In 2007, the Netherlands Federation of University Medical Centers (NFU) established the Parelsnoer Institute (PSI), which is a collaborative network of all eight Dutch University Medical Centers (UMCs) and functions as the national standard for clinical biobanking[17,18]. The Parelsnoer NRF cohort includes patients with various types and stages of kidney disease, including primary glomerular diseases (n = 19), secondary glomerular diseases (n = 2), autosomal dominant polycystic kidney disease (ADPKD) (n = 36), CKD at different stages (n = 474), and one patient with an unspecified diagnosis. CKD staging was defined according to the Kidney Disease: Improving Global Outcomes (KDIGO) 2012 Clinical Practice Guideline for the Evaluation and Management of CKD[19]. In the disease group, eGFR could not be calculated for 85 participants due to missing data for one or more required parameters. Among the remaining 447 participants, 49 (11.0%) were classified as CKD stage 1 (eGFR ≥ 90 mL/min/1.73 m2), 82 (18.3%) as stage 2 (eGFR 60-89 mL/min/1.73 m2), 137 (30.6%) as stage 3 (eGFR 30-59 mL/min/1.73 m2), 124 (27.7%) as stage 4 (eGFR 15-29 mL/min/1.73 m2), and 55 (12.3%) as stage 5 (eGFR < 15 mL/min/1.73 m2). Details of the eGFR calculation are provided in Section “eGFR calculation”. Notably, patients with CKD stages 1-4 attending the outpatient nephrology clinic of the University Medical Center Groningen were eligible for inclusion. As CKD is not defined solely by reduced eGFR, individuals with an eGFR ≥
The PSI does not collect samples from healthy individuals. Therefore, a total of 300 samples were obtained from healthy volunteers enrolled in the TransplantLines (TxLines) cohort, a Dutch research initiative focusing on the long-term outcomes of organ transplantation (umcgresearch.org, accessed on 28 May 2024). These individuals were medically approved as potential kidney donors. For the current study, 24-hour urine samples were collected during pre-donation screening visits.
This study was approved by the Medical Ethical Committee of the University Medical Center Groningen (M09.074242 for the Parelsnoer cohort and # 2014/077 for the TxLines cohort). All participants provided written informed consent prior to inclusion.
eGFR calculation
The eGFR was calculated based on serum creatinine concentration using Equation (1), obtained from the literature[20]. Parameters such as sex, age, and race, which may influence muscle quality, were incorporated into the equation.
where
Scr = serum creatinine concentration (mg/dL);
k = 0.7 for females and 0.9 for males;
α = -0.329 for females and -0.411 for males;
min = the minimum of Scr/k or 1 (if the ratio is above 1); and
max = the maximum of Scr/k or 1 (if the ratio is below 1).
Demographic data
For both the disease and donor groups, a comprehensive physical examination was performed by trained personnel following standardized protocols. This examination included measurements of standing height, body weight, waist circumference, and blood pressure. Blood samples were collected and analyzed for glucose, glycated hemoglobin (HbA1c), albumin, creatinine, and cholesterol [total cholesterol, low-density lipoprotein cholesterol (LDL-C), and high-density lipoprotein cholesterol (HDL-C)]. Sociodemographic factors, family history, medical history, medication use, health status, and lifestyle information were obtained through an interviewer-administered questionnaire.
Smoking status was categorized into two groups: current smokers (those who had smoked at least one cigarette per day in the past month) and non-smokers. Alcohol consumption was similarly classified into current drinkers (those who consumed alcohol at least once a week over the past month) and non-drinkers. However, in the Parelsnoer cohort, alcohol consumption data were not recorded for 395 patients (74.2%) and were therefore excluded from subsequent analyses. Educational attainment was classified into three levels: primary school or below, middle school, and high school or beyond.
Body mass index (BMI) was calculated as weight in kilograms divided by height in meters squared. Hypertension was defined as blood pressure ≥ 140/90 mmHg, in accordance with WHO guidelines[21]. Diabetes was defined as HbA1c > 6.5% (48 mmol/mol), following the American Diabetes Association criteria[22]. Hyperlipidemia was defined as LDL-C ≥ 190 mg/dL (4.9 mmol/L), as recommended by Grundy et al.[23].
Urinary heavy metal(loid) measurement
Urinary concentrations of total As, Cd, Hg, and Pb were measured using an inductively coupled plasma mass spectrometer (ICP-MS; Thermo Scientific iCAP TQ, USA) equipped with an autosampler (Elemental Scientific 2DX, USA). Sample preparation involved adding 3.00 mL of dilution solvent to 100 µL of urine. Details of all reagents and materials used are provided in Supplementary Table 1.
Five samples were analyzed on different dates to establish the limits of detection (LODs) for each metal(loid). The LODs for As, Cd, Hg, and Pb were 0.08, 0.007, 0.09, and 0.04 µg/L, respectively. The limits of quantification (LOQs) for As, Cd, Hg, and Pb were 1, 0.25, 0.5, and 5 µg/L, respectively. Notably, the measured As reflects total urinary As, encompassing both inorganic and organic species. The analytical method demonstrated sufficient sensitivity to detect the target analytes in most samples [Supplementary Table 2]. In human biomonitoring studies, concentrations below the LOD are typically reported. However, a high percentage of values below the LOD can complicate comparisons across studies. In the current study, metal(loid) concentrations below the LOD were assigned a value of LOD/√2 according to the NHANES Analysis Guidelines[24]. It has been reported that when more than 60% of samples from a study population are below the LOD, percentile estimates (e.g., 25th percentile, median) and geometric means cannot be calculated[25]. Health Canada considers a lower threshold, indicating that when more than 40% of values are below the LOD, percentiles are still reported, but means are not recommended[26]. In the present study, this was not a concern, as the proportion of values below the LOD was less than 20% in both the disease and donor groups.
A priori covariate selection
Although the primary aim of this study is to examine associations rather than causal relationships between heavy metal(loid)s and renal function, we adjusted for a set of covariates in the analysis. This adjustment helps better isolate the associations of interest and improves the interpretability of the findings. These covariates were chosen a priori based on evidence from previous studies[27-29] and directed acyclic graphs (DAGs)[30,31]. DAGs are diagrams that link variables using arrows to denote assumed direct causal effects (protective or causative) of one variable on another[32]. The identified covariates included age, sex, education, race, BMI, albumin level, diabetes, hyperlipidemia, hypertension, and smoking status. All covariates were included in the BKMR model.
Statistical methods
Descriptive analysis
Participant characteristics were summarized using descriptive statistics. Continuous variables were reported as mean ± standard deviation (SD) and median (minimum, maximum) to comprehensively describe their distributions. Categorical variables were presented as counts and percentages. Differences between groups were evaluated using the Wilcoxon rank-sum test (for continuous variables) and the chi-square test (for categorical variables), with corresponding P-values reported. A P-value < 0.05 was considered statistically significant.
Multiple imputation
Some participants had missing values for one or more variables, primarily due to non-response to questionnaire items or unspecified reasons, resulting in incomplete datasets. To avoid substantial data loss and potential bias, missing data were addressed using multiple imputation by chained equations (“MICE”), implemented via the mice package in R (version 4.4.2). To account for potential differences in missing data patterns between groups, the imputation process was performed separately for the disease and donor groups. A total of 15 imputed datasets were generated for each group and used in the subsequent statistical analyses.
Missing values in continuous variables were imputed using predictive mean matching (PMM) as implemented in the mice package in R. All statistical analyses were conducted using R. The quality of the imputation was evaluated using strip plots, and the results are provided in Supplementary Figure 1.
BKMR analysis
BKMR models were fitted separately to each of the 15 imputed datasets for both the disease and donor groups. The results from the 15 models within each group were then combined using the BKMR-MI (multiple imputation) approach, implemented via an R package developed by Devick[33], which is specifically designed to handle multiply imputed data in BKMR studies. The pooled results for each group were subsequently used to explore the associations between urinary metal(loid) concentrations and eGFR.
The main idea behind BKMR is to model the particular outcome - in our case, eGFR - as a flexible function h of multiple exposure variables, namely urinary As, Cd, Hg, and Pb. This function h allows for nonlinearities and non-trivial interactions among the variables. Let Yi denote the eGFR of individual i (or, more precisely, a transformation of eGFR, as described later in this section). Yi is modeled as in Equation (2)[11].
where Asi, Cdi, Hgi, and Pbi represent the log-transformed urinary concentrations of As, Cd, Hg, and Pb for individual i, respectively. The function h() defines the exposure-response relationship, describing how the health outcome (eGFR) changes with varying urinary concentrations of the heavy metal(loid)s. The function h() is estimated based on a Gaussian kernel function and can be interpreted as a smooth approximation of the underlying pattern in the data points Yi as a function of (Asi, Cdi, Hgi, Pbi). The flexibility of h() is governed by the variance (or bandwidth) of the Gaussian kernel. In practice, the BKMR package uses a parameter defined as half the inverse variance of the Gaussian kernel; hereafter, this parameter is referred to as the inverse bandwidth parameter r. A smaller value of r corresponds to a less flexible function h, whereas a larger value corresponds to greater flexibility. Xi is a vector of covariates (age, sex, education, race, BMI, albumin, diabetes, hyperlipidemia, hypertension, and smoking status for individual i), where categorical covariates with more than two levels are represented using indicator (dummy) variables. β is the corresponding vector of coefficients. Covariates are thus included linearly, which is considered appropriate for this model, as scatterplots of Y vs. individual (continuous) covariates did not indicate nonlinear relationships. The error term εi captures unexplained variability in Yi. BKMR assumes that εi is independently and identically distributed (i.i.d.) and follows a normal distribution. For further methodological details, see Bobb et al.[11].
The BKMR model was fitted using a Markov Chain Monte Carlo (MCMC) sampler with 10,000 iterations, of which the last 5,000 were used for posterior inference. The bkmr package, along with supporting R packages (e.g., bkmrhat, bayesplot, doParallel), was used to conduct the BKMR analysis. Details of the model parameter settings are provided in the Supplemental Materials (“BKMR model settings” section).
In all BKMR fittings, urinary metal(loid) concentrations were log-transformed to account for right-skewed distributions. In the disease group, eGFR exhibited a non-normal distribution and was therefore transformed using the Box-Cox transformation (optimal parameter λ = 0.14) prior to model fitting. Unlike fixed transformations (e.g., log transformation), the Box-Cox method determines the optimal λ based on the data, which can improve normality and overall model fit. In the donor group, no transformation was necessary because eGFR was approximately normally distributed.
As mentioned above, BKMR-MI was used to investigate the associations between urinary metal(loid) concentrations and eGFR. Specifically, the following analyses were conducted:
• Univariate associations: the association between each individual urinary metal(loid) concentration and eGFR, with the remaining three metal(loid)s fixed at their median (50th percentile) levels.
• Bivariate associations: the association between two urinary metal(loid)s and eGFR, with the remaining two fixed at their median levels. Compared to univariate analyses, visualization of bivariate associations enables the assessment of potential interactions between several heavy metal(loid)s exposures, thereby providing a more comprehensive representation of complex exposure scenarios.
• Overall association: the joint association between all four urinary metal(loid) concentrations and eGFR, modeled by varying all exposures simultaneously across their percentile levels (e.g., all at the 25th, 50th, or 75th percentile). The resulting curves illustrate how concurrent changes in exposure levels are associated with differences in eGFR.
Model diagnostics
Model diagnostics are crucial for ensuring the reliability of the results. We assessed model convergence, compared prior and posterior distributions, performed posterior predictive checks, and conducted sensitivity analyses. These diagnostics were carried out separately for the disease and donor groups.
RESULTS AND DISCUSSION
Demographic, clinical, and biomarker results of the disease and donor groups
Table 1 provides an overview of the demographic, clinical, and biomarker data for the disease group (Parelsnoer, n = 532) and the donor group (Txlines, n = 300). Missing data rates ranged from 2% to 22%, with generally higher proportions of missing values in the disease group.
Demographic, clinical, and biomarker data for the disease group (Parelsnoer, n = 532) and the donor group (Txlines, n = 300)
| Disease group (n = 532) | Donor group (n = 300) | P value | Test | |
| Sex | < 0.001 | Chi-square test | ||
| Males | 361 (67.9%) | 134 (44.7%) | ||
| Females | 171 (32.1%) | 166 (55.3%) | ||
| Age | 0.444 | Rank-sum test | ||
| Mean (SD) | 56.6 (15.7) | 56.7 (11.5) | ||
| Median [min, max] | 58.3 [19.5, 88.2] | 57.0 [19.4, 78.0] | ||
| Missing | 23 (4.3%) | 0 (0%) | ||
| Education | < 0.001 | Chi-square test | ||
| High school or beyond | 139 (26.1%) | 165 (55.0%) | ||
| Middle school | 205 (38.5%) | 88 (29.3%) | ||
| Primary school or below | 158 (29.7%) | 5 (1.7%) | ||
| Missing | 30 (5.6%) | 42 (14.0%) | ||
| Race | < 0.001 | Chi-square test | ||
| African | 4 (0.8%) | 2 (0.7%) | ||
| Caucasian | 453 (85.2%) | 211 (70.3%) | ||
| Other | 23 (4.3%) | 41 (13.7%) | ||
| Missing | 52 (9.8%) | 46 (15.3%) | ||
| BMI | 0.118 | Rank-sum test | ||
| Mean (SD) | 27.3 (5.55) | 26.3 (3.78) | ||
| Median [min, max] | 26.4 [15.5, 60.9] | 26.2 [18.5, 50.2] | ||
| Missing | 117 (22.0%) | 0 (0%) | ||
| Diabetes | 0.135 | Chi-square test | ||
| No | 462 (86.8%) | 296 (98.7%) | ||
| Yes | 16 (3.0%) | 4 (1.3%) | ||
| Missing | 54 (10.2%) | 0 (0%) | ||
| Hyperlipidemia | 0.577 | Chi-square test | ||
| No | 466 (87.6%) | 286 (95.3%) | ||
| Yes | 29 (5.5%) | 14 (4.7%) | ||
| Missing | 37 (7.0%) | 0 (0%) | ||
| Hypertension | < 0.001 | Chi-square test | ||
| No | 246 (46.2%) | 231 (77.0%) | ||
| Yes | 225 (42.3%) | 63 (21.0%) | ||
| Missing | 61 (11.5%) | 6 (2.0%) | ||
| Smoking status | ||||
| No | 390 (73.3%) | 218 (72.7%) | 0.105 | Chi-square test |
| Yes | 106 (19.9%) | 42 (14.0%) | ||
| Missing | 36 (6.8%) | 40 (13.3%) | ||
| Serum albumin (µmol/L) | < 0.001 | Rank-sum test | ||
| Mean (SD) | 43.0 (3.68) | 44.3 (2.25) | ||
| Median [min, max] | 43.0 [21.0, 51.0] | 44.0 [38.0, 51.0] | ||
| Missing | 15 (2.8%) | 0 (0%) | ||
| Serum creatinine (µmol/L) | < 0.001 | Rank-sum test | ||
| Mean (SD) | 190.7 (121.5) | 76.6 (14.8) | ||
| Median [min, max] | 158 [43, 750] | 75 [22, 132] | ||
| Missing | 15 (2.8%) | 0 (0%) | ||
| eGFR (mL/min/1.73 m2) | < 0.001 | Rank-sum test | ||
| Mean (SD) | 46.6 (30.7) | 85.9 (14.9) | ||
| Median [min, max] | 38.3 [5.94, 137] | 86.1 [47.9, 138] | ||
| Missing | 85 (16.0%) | 46 (15.3%) | ||
| Urinary arsenic (µg/L) | < 0.05 | Rank-sum test | ||
| Mean (SD) | 16.5 (41.1) | 16.7 (36.4) | ||
| Median [min, max] | 5.81 [0.296, 595] | 5.08 [0.613, 327] | ||
| Missing | 46 (8.6%) | 0 (0%) | ||
| Urinary cadmium (µg/L) | < 0.001 | Rank-sum test | ||
| Mean (SD) | 0.230 (0.291) | 0.146 (0.126) | ||
| Median [min, max] | 0.137 [0.00500, 3.21] | 0.109 [0, 0.945] | ||
| Missing | 46 (8.6%) | 0 (0%) | ||
| Urinary mercury (µg/L) | < 0.001 | Rank-sum test | ||
| Mean (SD) | 0.262 (0.529) | 0.162 (0.502) | ||
| Median [min, max] | 0.088 [0, 7.27] | 0.022 [0, 6.15] | ||
| Missing | 46 (8.6%) | 0 (0%) | ||
| Urinary lead (µg/L) | 0.054 | Rank-sum test | ||
| Mean (SD) | 0.453 (0.454) | 0.555 (0.978) | ||
| Median [min, max] | 0.328 [0, 3.93] | 0.369 [0, 13.2] | ||
| Missing | 46 (8.6%) | 0 (0%) |
The disease group included a higher proportion of male participants (67.9%) compared to the donor group (44.7%) (P < 0.001). The mean ages were similar between the two groups (disease: 56.6 years; donor: 56.7 years; P = 0.444). This near-identical age distribution was not due to intentional matching or selection criteria, but rather occurred coincidentally within the sampled populations. A higher proportion of participants in the donor group had a high school education or beyond (55.0%) compared to the disease group (26.1%) (P < 0.001). The disease group had more Caucasians (85.2%) than the donor group (70.3%) (P < 0.001).
Participants in the disease group had a median BMI of 26.4 kg/m2, which was comparable to that of the donor group (26.2 kg/m2; P = 0.118). There were no significant differences between the disease and donor groups in the prevalence of diabetes (based on HbA1c; P = 0.135) or hyperlipidemia (based on LDL-C; P = 0.577). The prevalence of hypertension was significantly higher in the disease group (42.3%) than in the donor group (21.0%) (P < 0.001). In addition, the disease group had a higher median plasma creatinine level (158 µmol/L) compared to the donor group (75 µmol/L) (P < 0.001), and a substantially lower median eGFR (38.3 vs. 86.1 mL/min/1.73 m2; P < 0.001). These eGFR results are consistent with the cohort definitions, as the disease group consists of individuals with diagnosed kidney disease, while the donor group comprises medically approved healthy kidney donor candidates.
Median total urinary As levels were significantly lower in the donor group compared to the disease group (P < 0.05). Similarly, median urinary Cd and Hg levels were significantly lower in the donor group (both P < 0.001). A non-significant trend toward higher median urinary Pb levels was observed in the donor group (P = 0.054). It should be noted that the measured As values represent total urinary As, encompassing both inorganic and organic species.
BKMR for the disease group
The model diagnostics [Supplementary Materials (“Model diagnostics” section)] confirmed that the MCMC algorithm converged adequately and that the distributional assumptions of the BKMR model seemed to be reasonable approximations. The sensitivity analysis showed that the use of different (non-informative) priors had minimal impact on the resulting plots. The BKMR analysis results for the disease group are presented in the following sections.
Univariate exposure-response association between individual heavy metal(loid)s and eGFR
To explore how individual urinary heavy metal(loid) concentrations are associated with the outcome (Box-Cox-transformed eGFR), we examined univariate exposure-response relationships. In this approach, the log-transformed urinary concentration of one heavy metal(loid) is varied across its range while all other heavy metal(loid)s are held constant at their 50th percentile. This enables clear visualization of the estimated association between a single heavy metal(loid) and the outcome.
Figure 1 shows the univariate exposure–response functions. Each panel represents one metal(loid), with the horizontal axis (z) showing its log-transformed urinary concentration and the vertical axis representing the outcome function h(z), interpreted as the Box-Cox-transformed eGFR adjusted for other covariates. While the log transformation of urinary concentrations and the Box-Cox transformation of eGFR limit direct interpretation of values, a monotonic relationship between z and h corresponds to a monotonic relationship between urinary concentration and eGFR on the original scale.
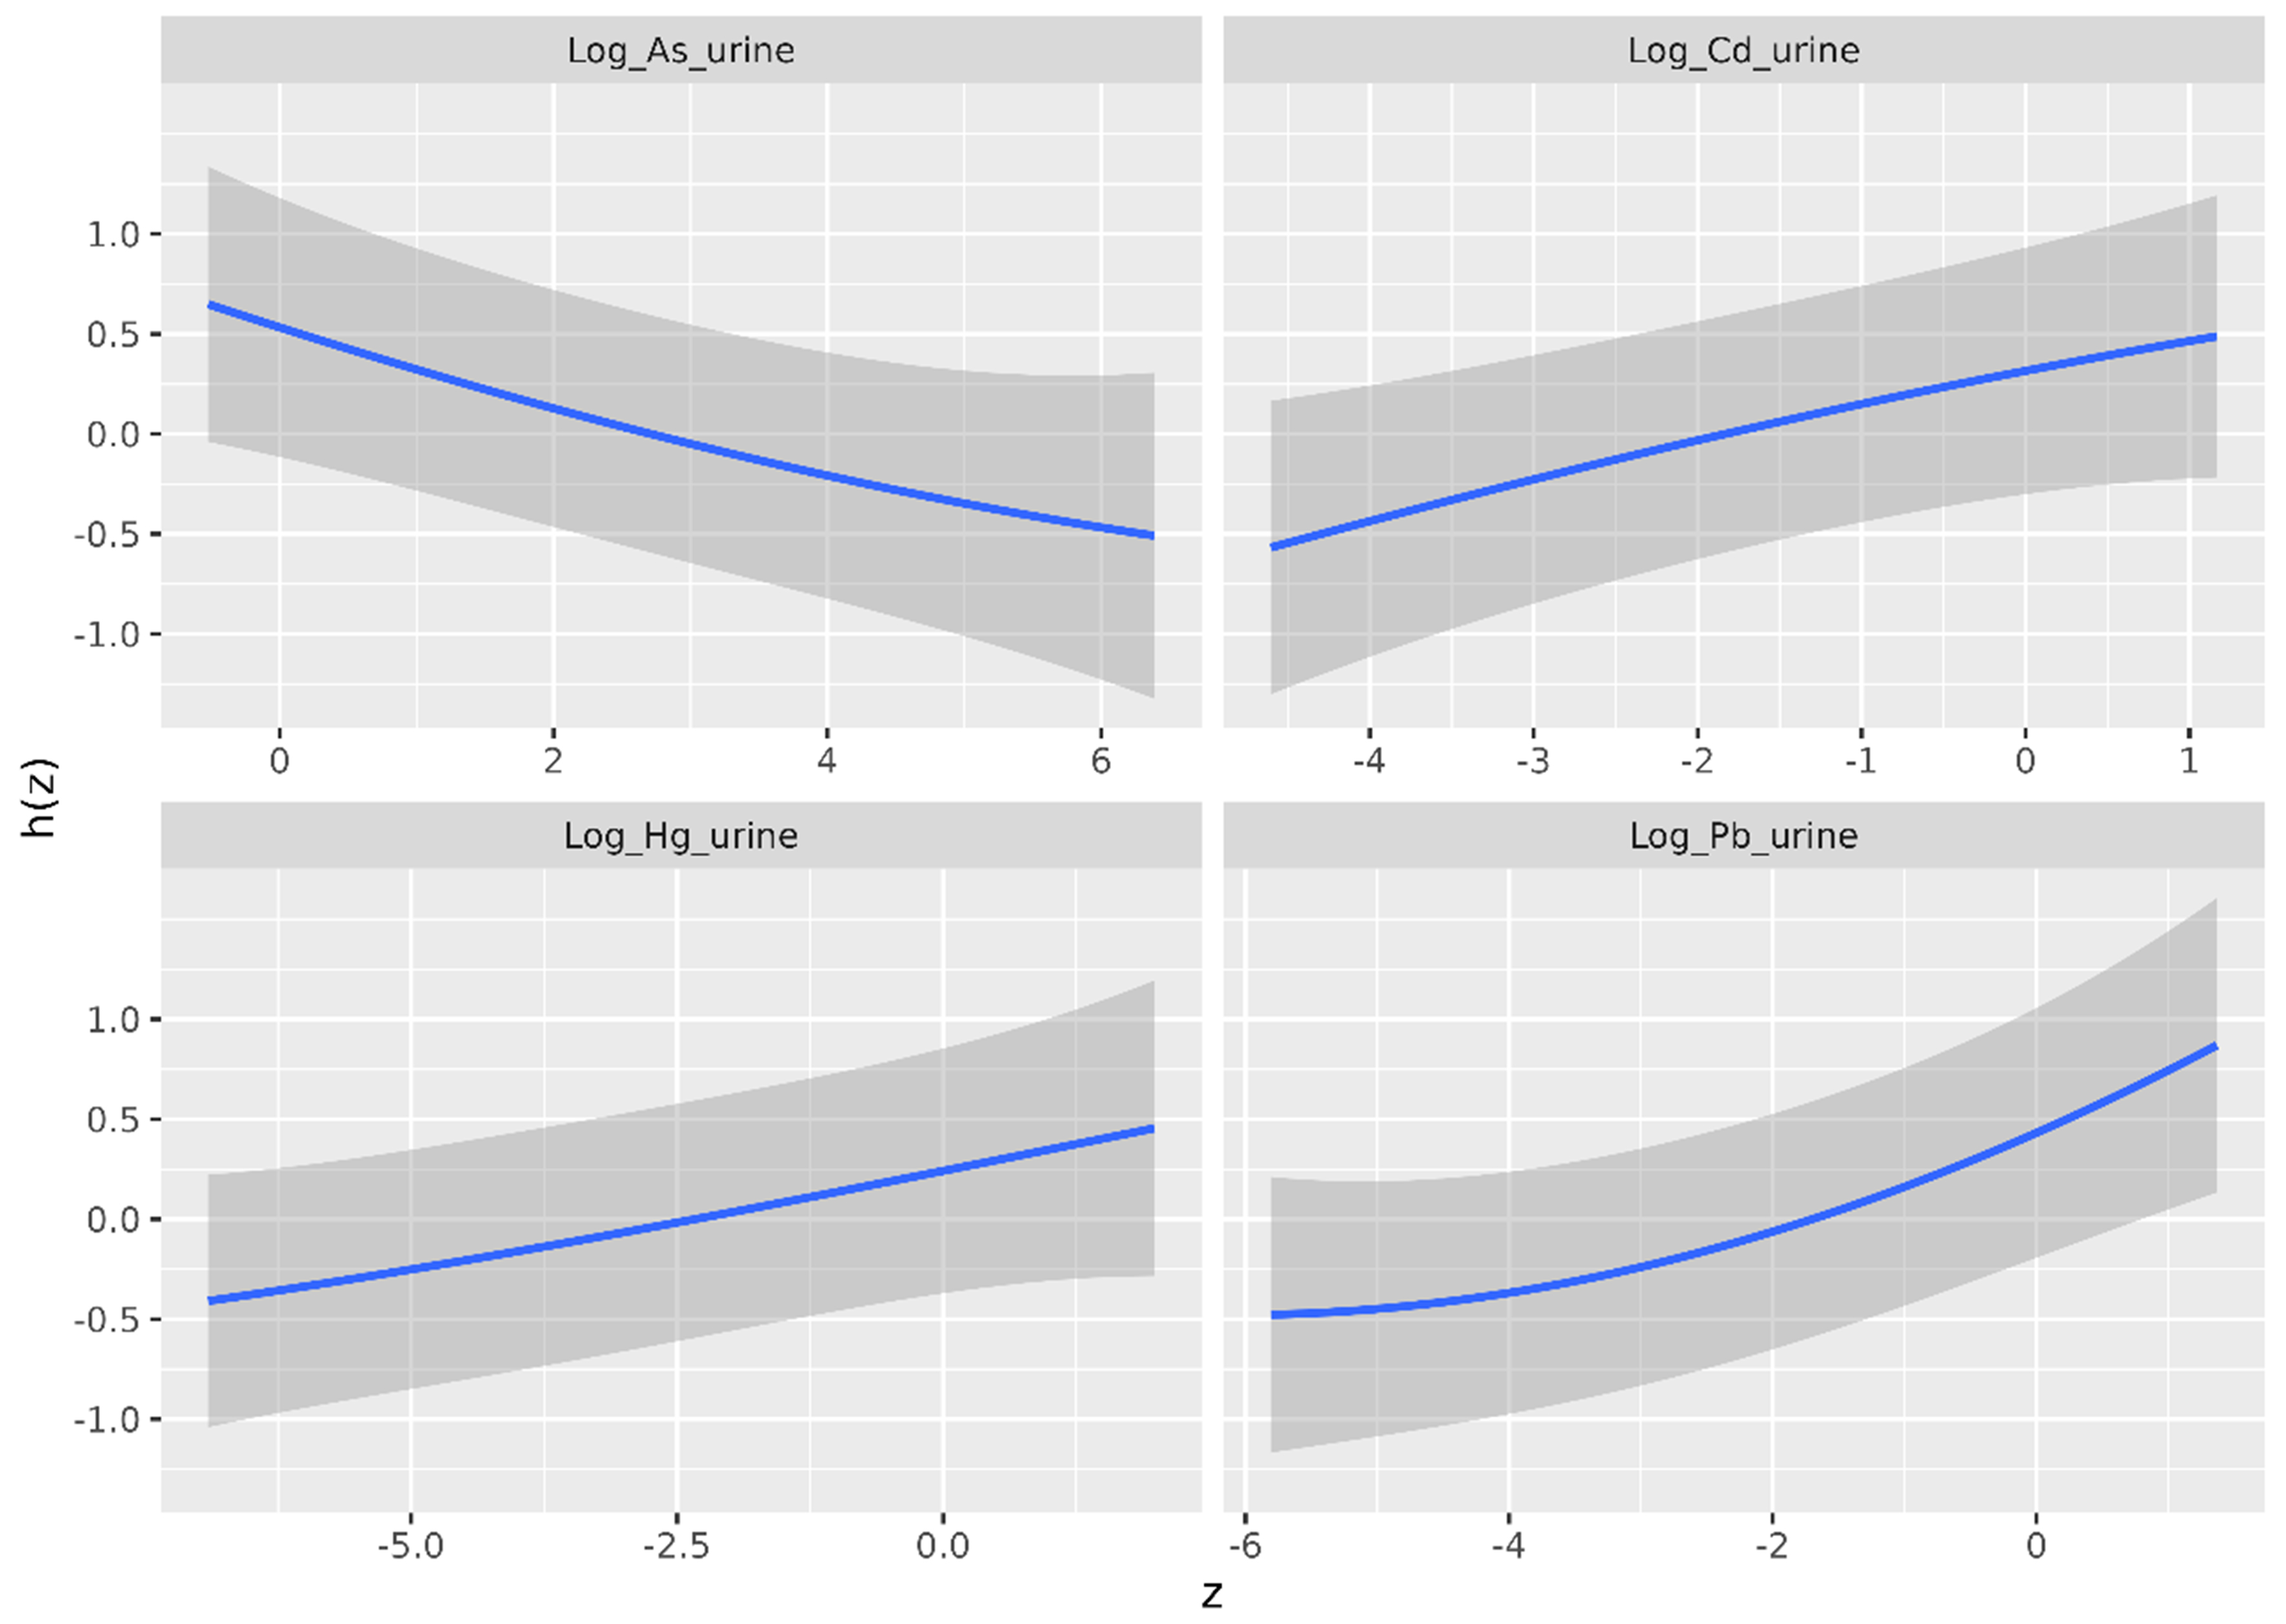
Figure 1. Univariate exposure-response association - estimate (blue line) and 95% credible intervals (gray shaded area) - between urinary heavy metal(loid) concentrations and the outcome (Box-Cox-transformed eGFR), as estimated by the BKMR model for the disease group. The horizontal axis shows the log-transformed urinary heavy metal(loid) concentration (z), and the vertical axis shows the contribution of z to the outcome [h(z)]. eGFR: Estimated glomerular filtration rate; BKMR: Bayesian Kernel Machine Regression.
The figure shows the estimated exposure-response functions (blue lines) along with the pointwise 95% credible intervals (gray bands). The central estimates suggest a negative association between urinary As concentration and Box-Cox-transformed eGFR, and positive associations between urinary Cd, Hg, and Pb concentrations and Box-Cox-transformed eGFR. Yet, the relatively wide credible bands preclude firm conclusions based on Figure 1 alone. To assess the statistical significance of these relationships, Figure 2 should be consulted, as it directly evaluates differences in h(z) across varying urinary concentrations z.
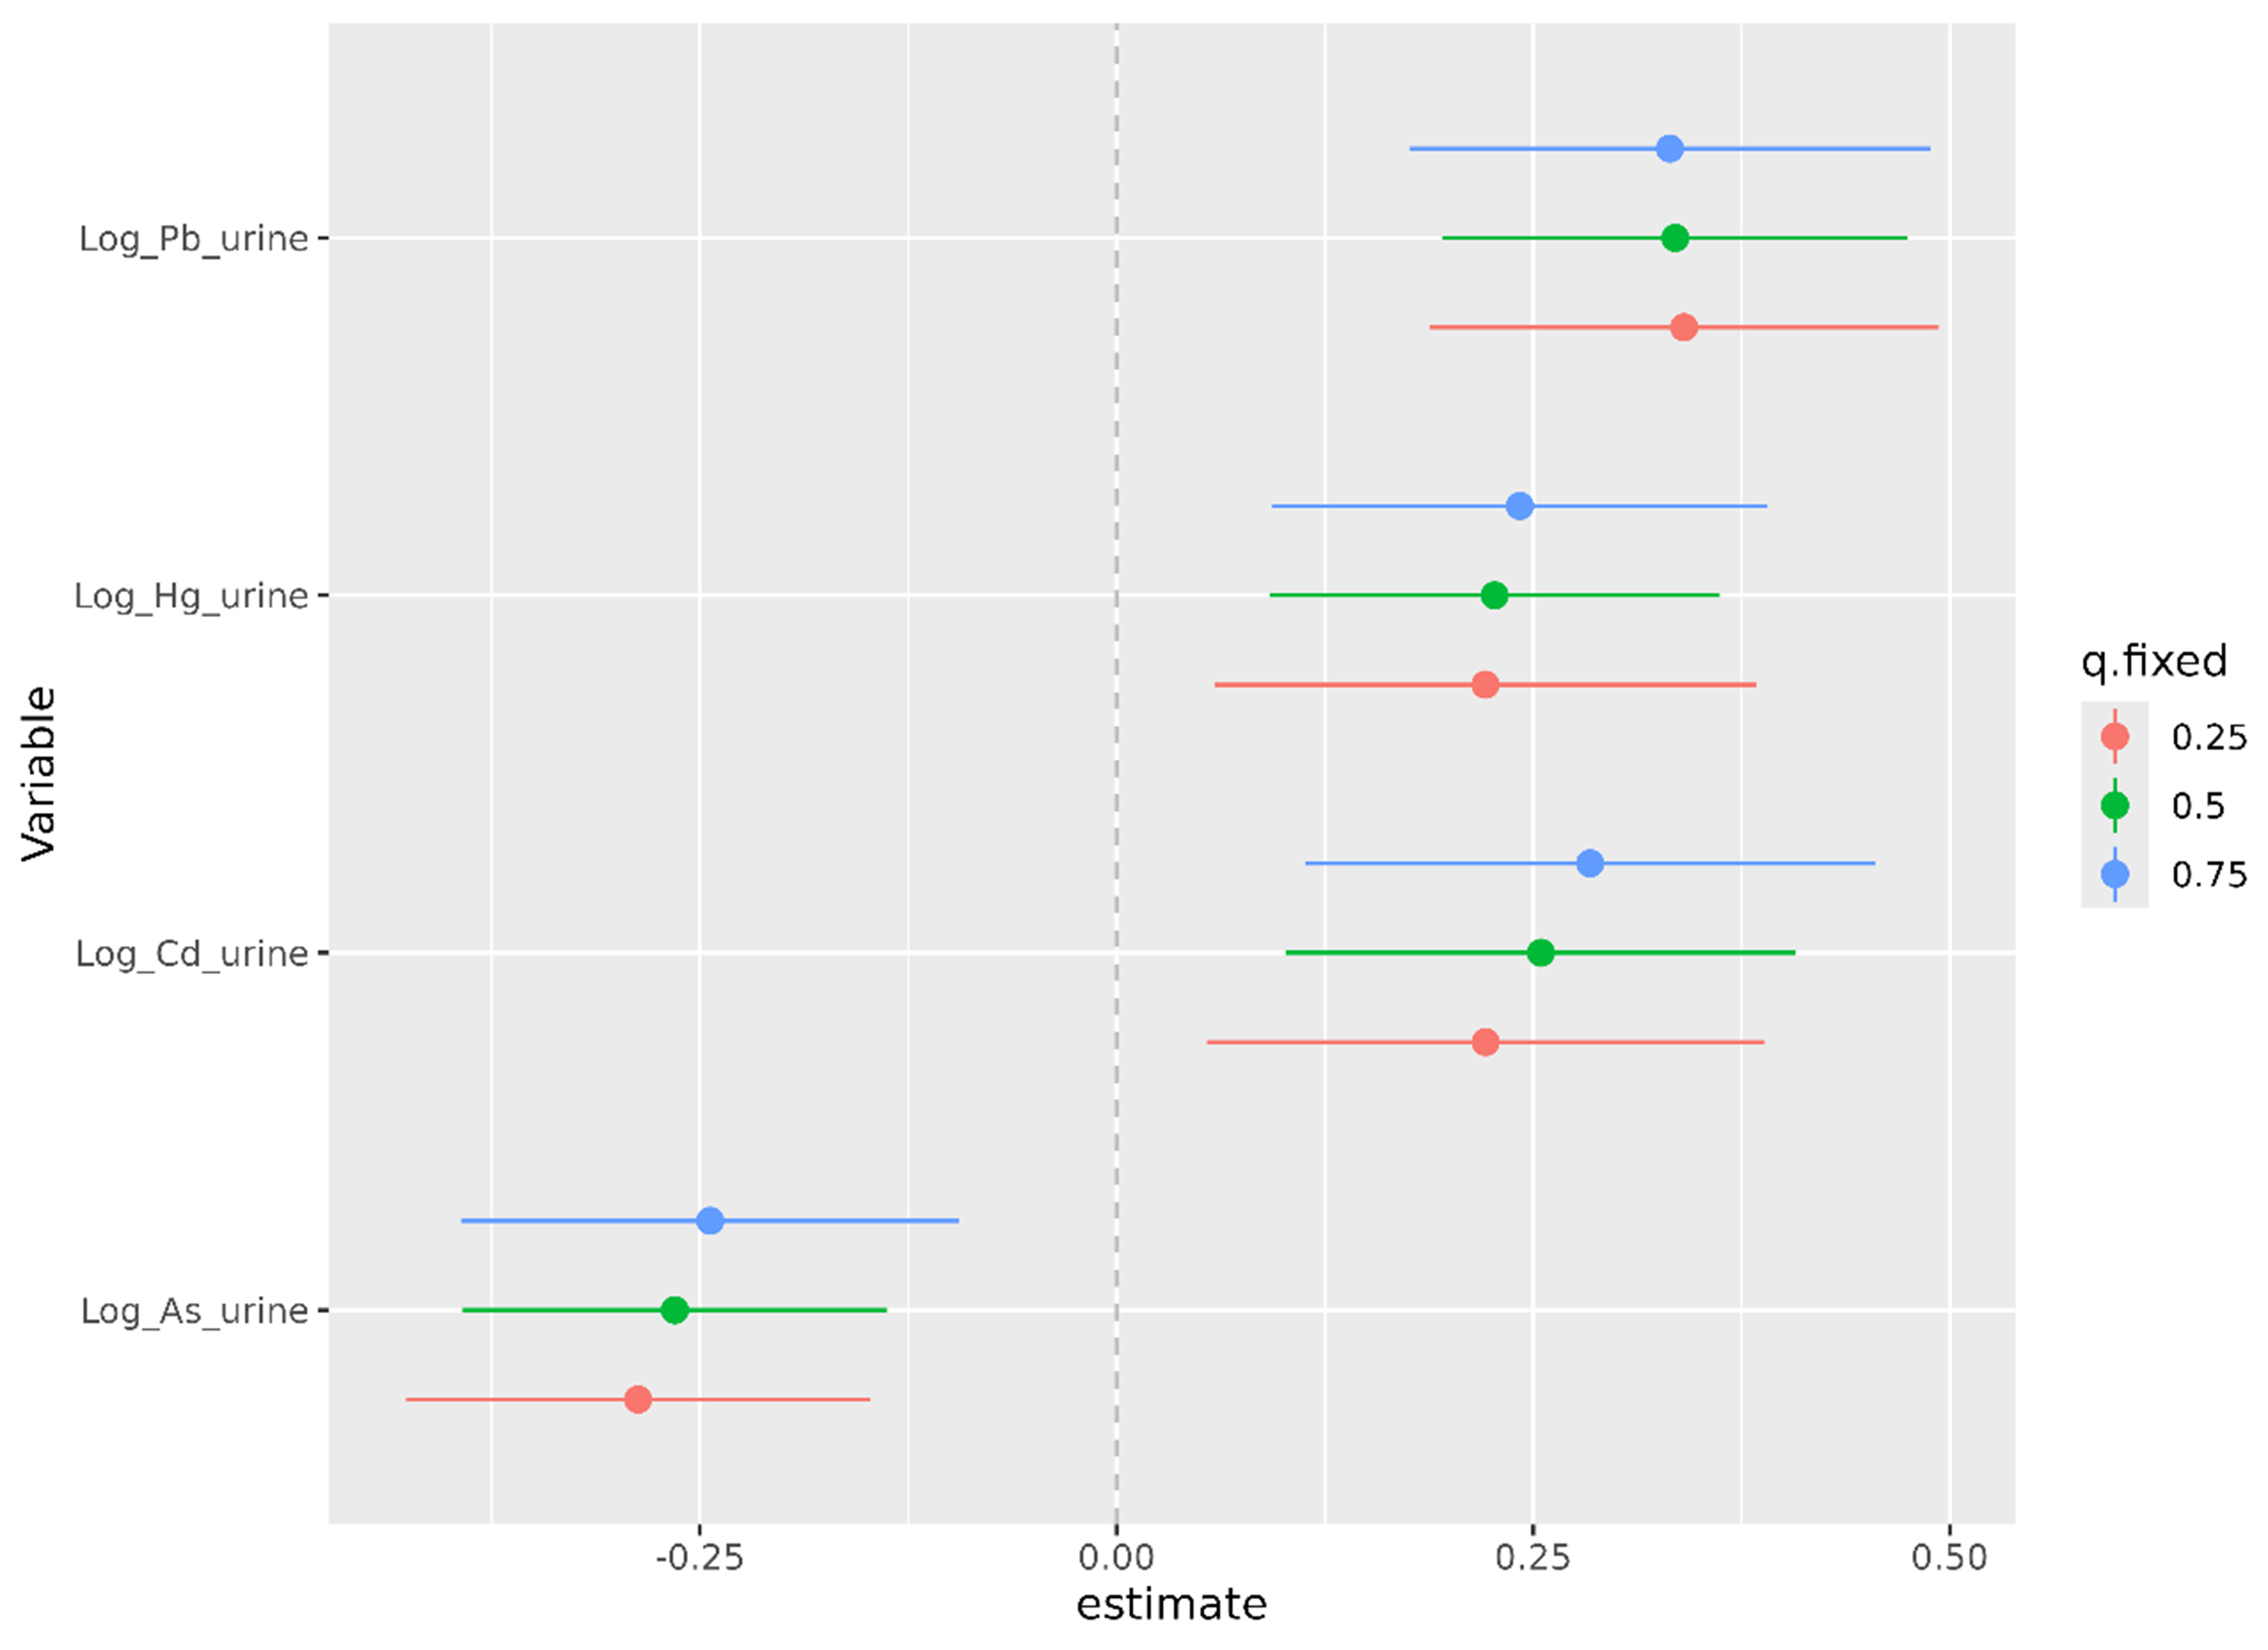
Figure 2. Estimated change in Box-Cox-transformed eGFR (outcome) associated with changes in urinary metal(loid) concentrations, based on BKMR. Points represent the mean estimated difference in predicted outcome when the log-transformed concentration of one metal(loid) increases from the 25th to the 75th percentile, while the other three are held constant at the 25th (red), 50th (green), or 75th (blue) percentile. Horizontal lines indicate 95% credible intervals. The x-axis shows the estimated change in the outcome; the vertical dashed line at 0.00 indicates no change. Values < 0.00 suggest a negative association; values > 0.00 suggest a positive association. eGFR: Estimated glomerular filtration rate; BKMR: Bayesian Kernel Machine Regression.
Figure 2 shows the change in Box-Cox-transformed eGFR when the concentration of each heavy metal(loid) increases from the 25th to the 75th percentile. This is evaluated for each metal(loid)under three scenarios where the remaining metal(loid) concentrations are held fixed at their 25th (red), 50th (green), and 75th (blue) percentiles. Consistent with Figure 1, the estimates (points) indicate that As is negatively associated with the outcome (Box-Cox-transformed eGFR), while Cd, Pb, and Hg are estimated to show positive associations. Notably, the 95% credible intervals for all metal(loid)s do not include zero, indicating that these associations are statistically significant at the 95% level.
These findings hold irrespective of the concentrations of the other three metal(loid)s. In fact, the concentrations of the other metal(loid)s do not appear to have a substantial impact. This suggests that strong interaction effects among the heavy metal(loid)s are not present.
Bivariate exposure-response association between two heavy metal(loid)s and eGFR
Figure 3 shows the bivariate exposure-response associations, illustrating how the Box-Cox-transformed eGFR varies with the concentration of one heavy metal(loid) (A) at different concentrations of another heavy metal(loid) (B), for all combinations of A and B. The remaining two metal(loid)s are held constant at their median values.
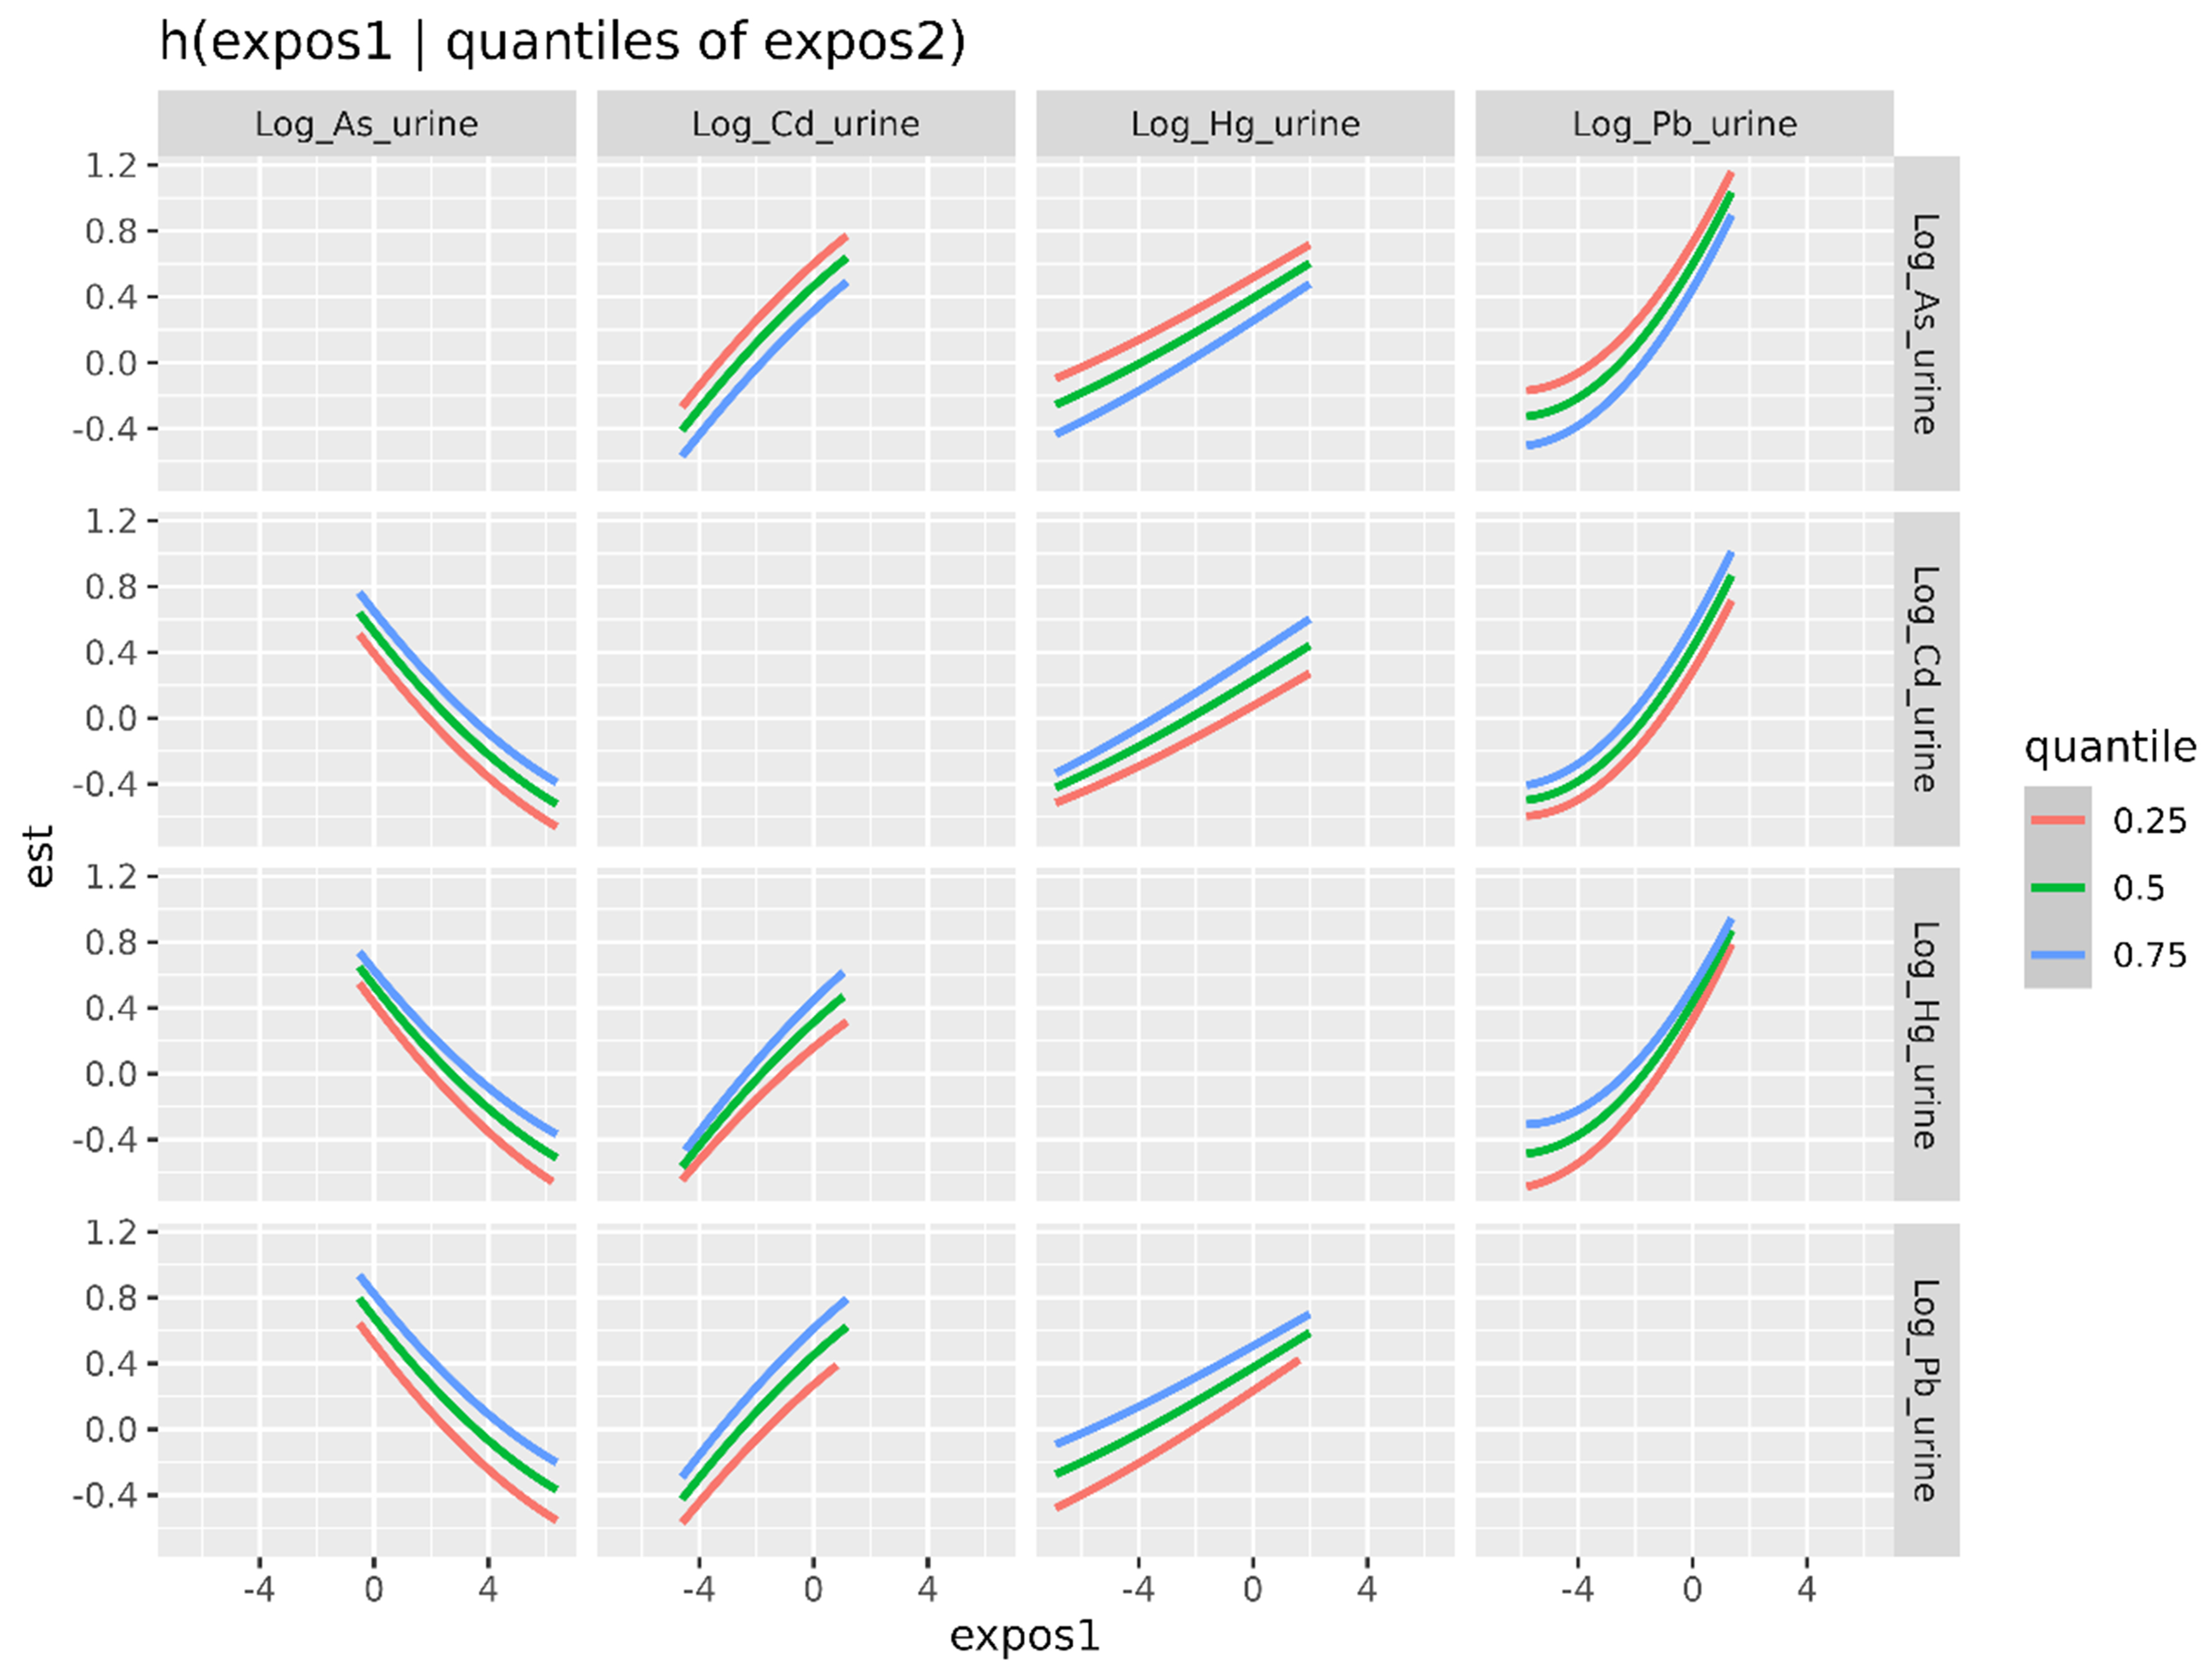
Figure 3. Bivariate exposure–response functions for urinary metal(loid) concentrations based on BKMR. Each panel illustrates the estimated effect of one log-transformed urinary metal(loid) concentration (horizontal axis, expos1) on the outcome (Box-Cox-transformed eGFR) (vertical axis, est), while fixing the log-transformed urinary concentration of a second metal(loid) (expos2, shown in each row) at the 25th (red), 50th (green), or 75th (blue) percentile. The other two log-transformed urinary metal(loid) concentrations are held fixed at their 50th percentile. BKMR: Bayesian Kernel Machine Regression; eGFR: estimated glomerular filtration rate.
Figure 3 shows that, across all combinations, the shapes of the curves are consistent with the single-variable results. As shows a negative association with eGFR across all quantile levels of the co-exposed metals, while Cd, Hg, and Pb consistently show positive associations. The curves are generally parallel and closely aligned across quantities, suggesting that the associations between individual heavy metal(loid)s and eGFR are largely independent of the exposure levels of the other metal(loid)s. These results suggest that the effects of the studied heavy metal(loid)s on eGFR are largely additive, with no strong evidence of interaction effects.
Combined association between the heavy metal(loid) mixture and eGFR
The BKMR approach enables quantile-based assessment of the overall association between a mixture of exposures and the outcome.
Figure 4 displays the estimated change in Box-Cox-transformed eGFR (vertical axis, “estimate”) across simultaneously increasing percentile levels of the four heavy metal(loid) concentrations (e.g., all set at the 25th, 50th, or 75th percentile, as indicated on the horizontal axis, “quantile”). This summarizes the overall association between the mixture of four log-transformed urinary metal(loid)s (As, Cd, Hg, Pb) and the outcome. The estimates indicate an overall positive association between the heavy metal(loid) mixture and eGFR. Moreover, this association is clearly statistically significant, as the 95% credible intervals do not include zero.
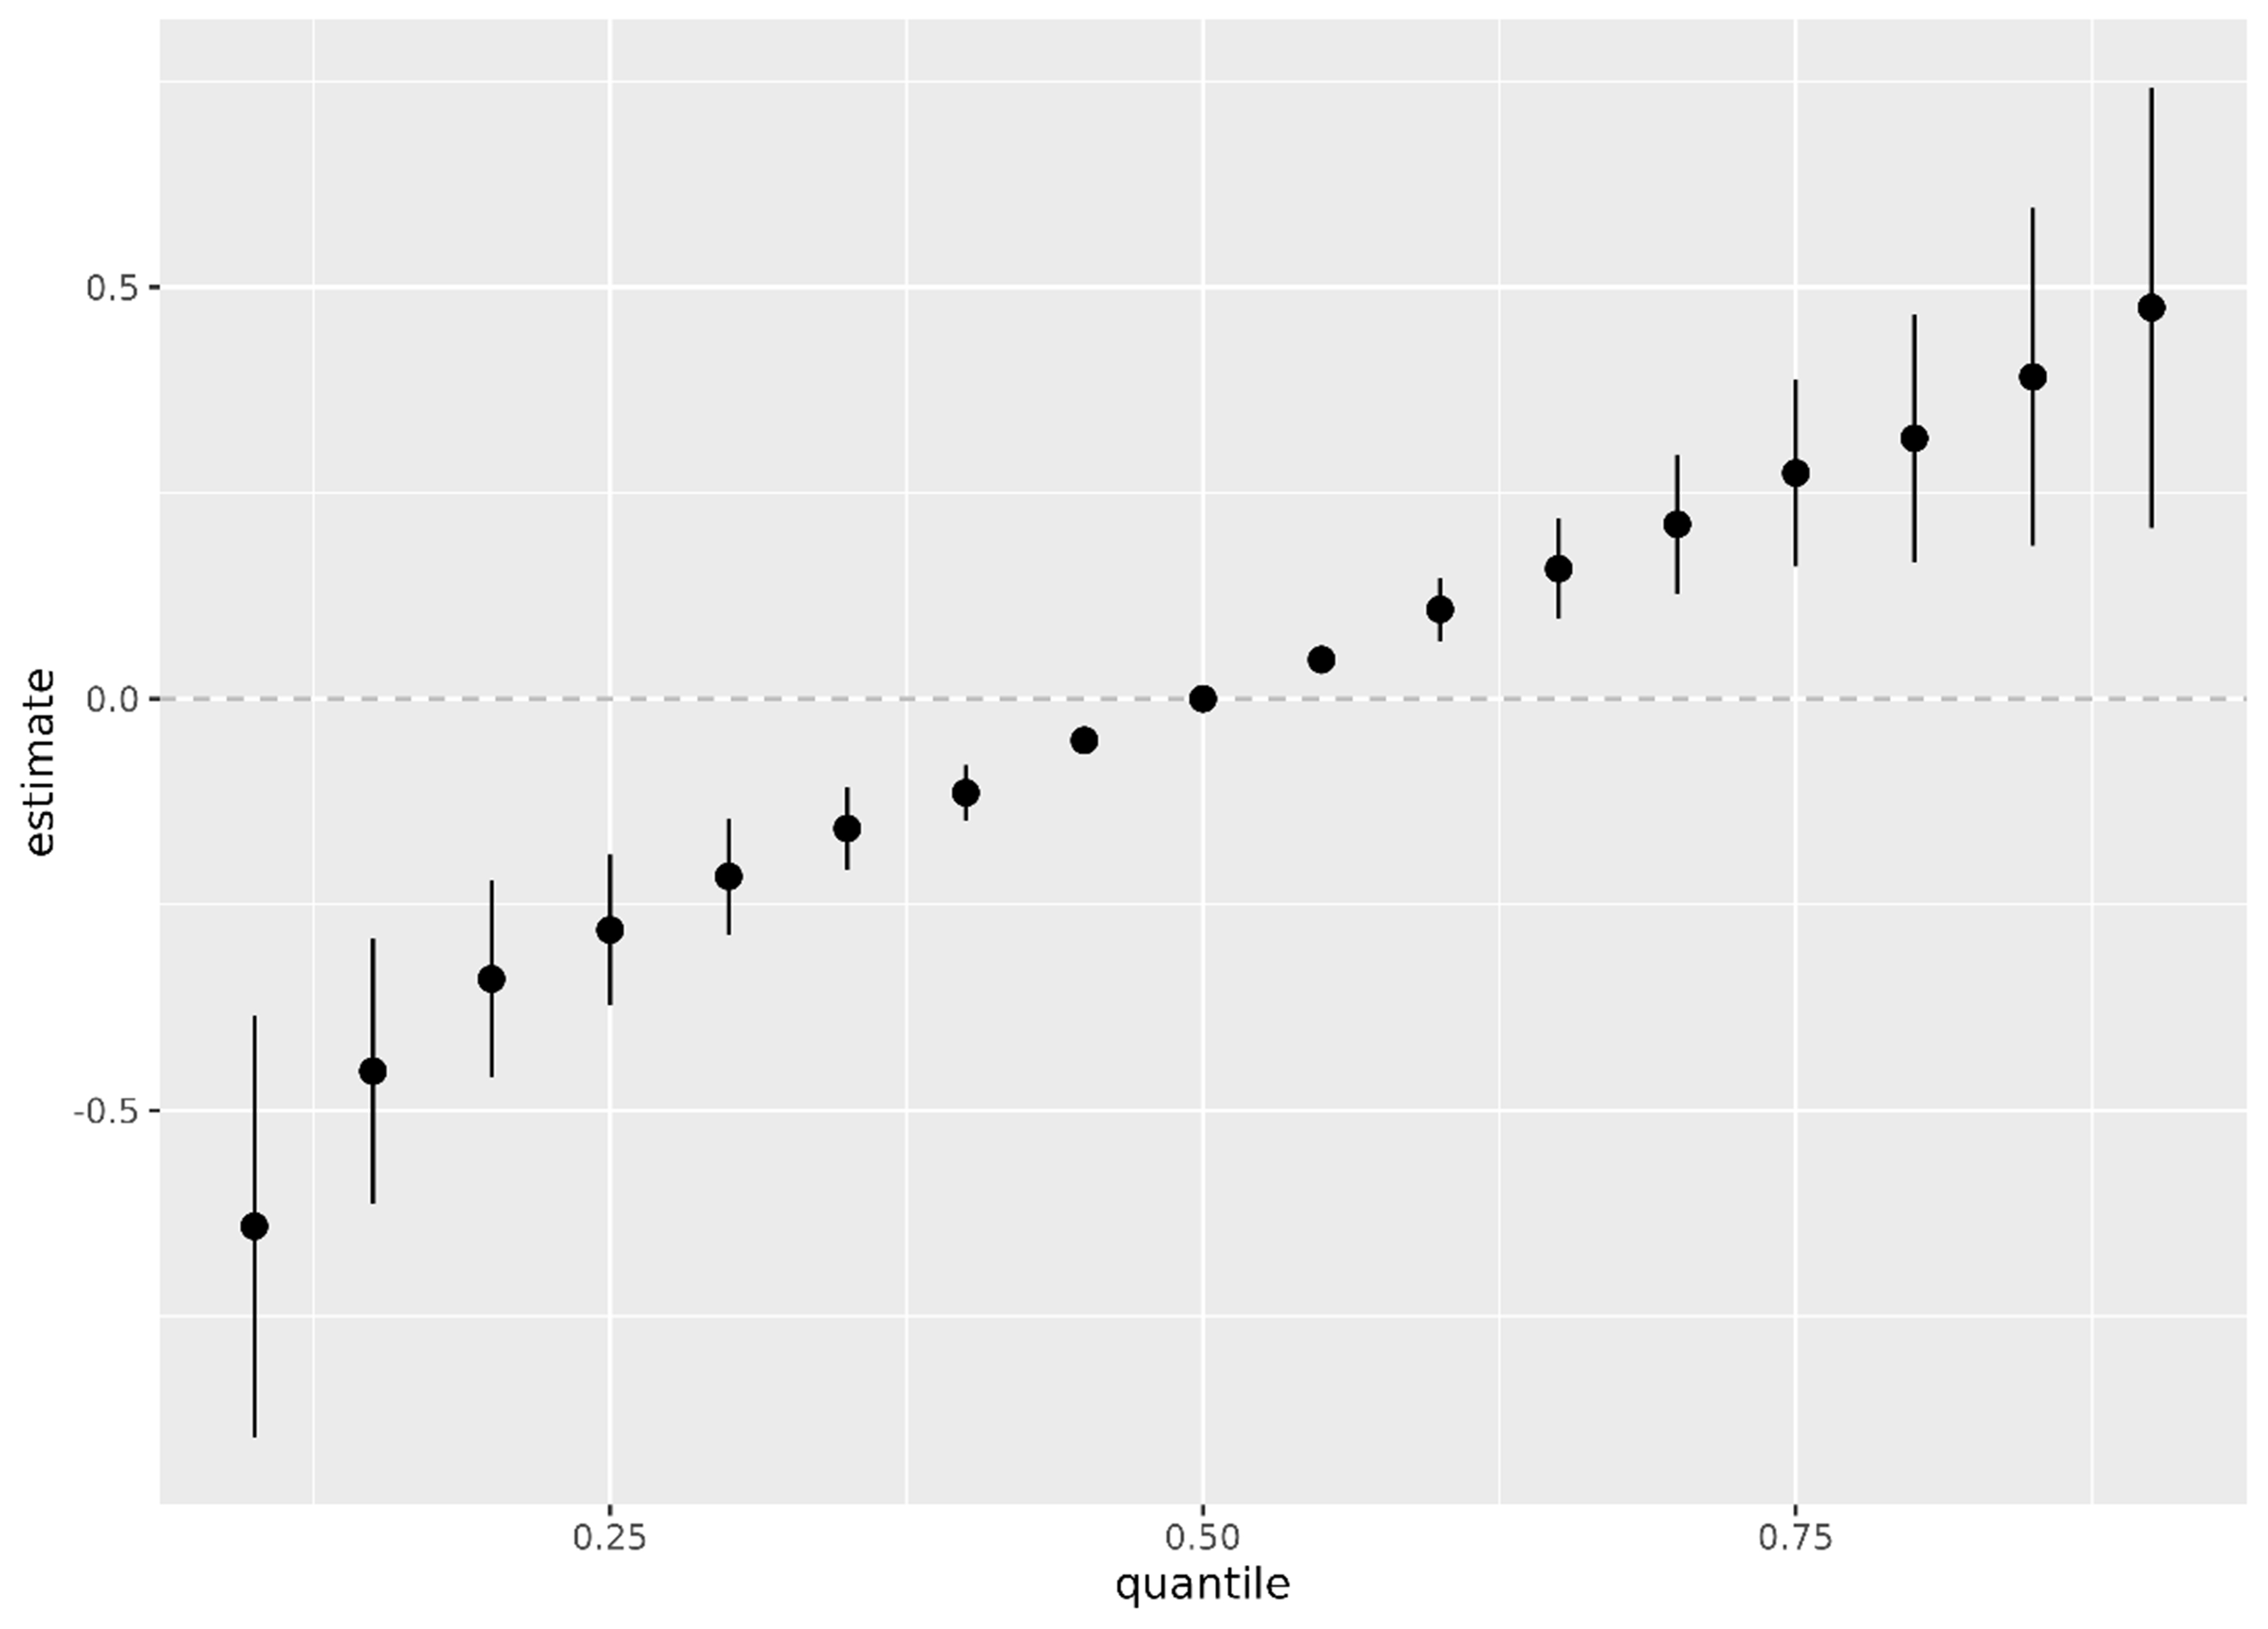
Figure 4. Estimated overall association between the mixture of the four heavy metal(loid)s and the outcome (Box-Cox-transformed eGFR) across quantiles of the mixture distribution, based on the BKMR model. The 50th percentile (median) of the exposure mixture is used as the reference point (estimate = 0.0; horizontal dashed line). Points represent posterior mean estimates, and vertical lines indicate 95% credible intervals. eGFR: Estimated glomerular filtration rate; BKMR: Bayesian Kernel Machine Regression.
The wider credible intervals at the extremes reflect the smaller number of observations at extreme urinary concentrations.
BKMR for the donor group
In the donor group, the exposure–response relationships estimated by the BKMR model exhibit great uncertainty, and no statistically significant association was observed between urinary metal(loid) levels and eGFR. As shown in Figure 5, the estimated functions are relatively flat, and the wide 95% credible intervals reflect substantial uncertainty in the association estimates.
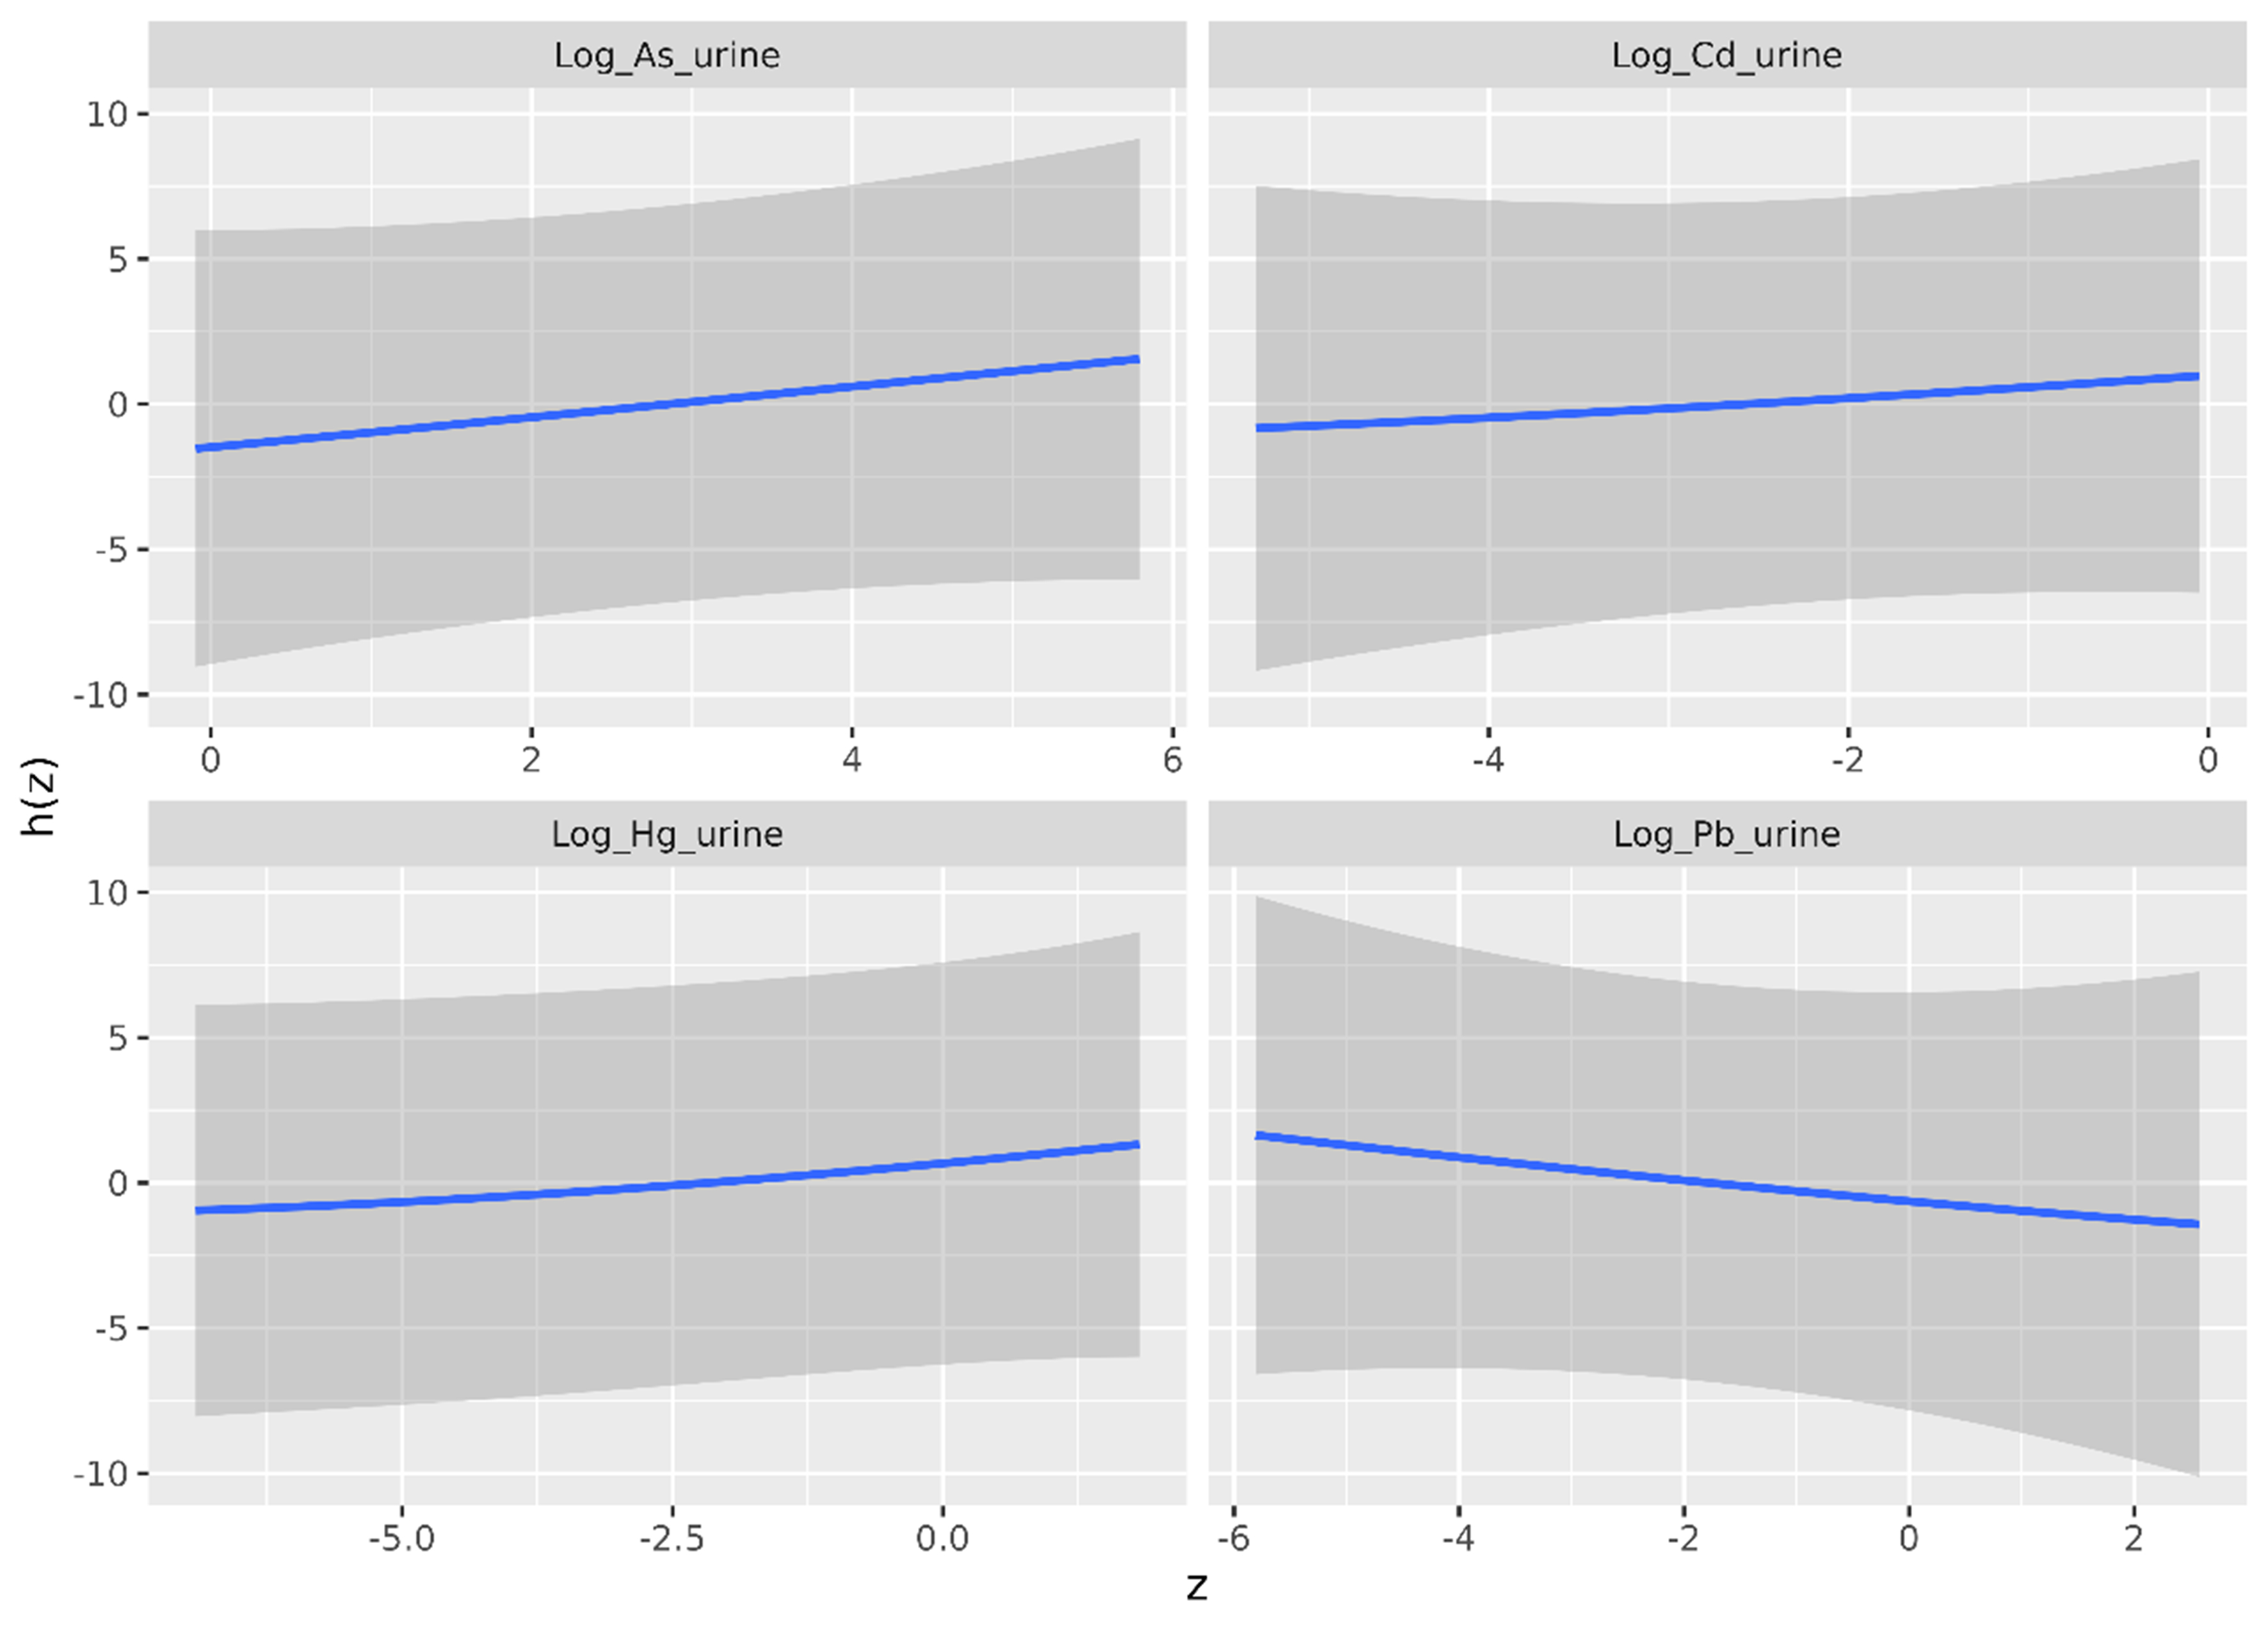
Figure 5. Univariate exposure-response association - estimate (blue line) and 95% credible interval (gray shaded area) - between each heavy metal(loid) and eGFR, as estimated by the BKMR model in the donor group. The horizontal axis shows the log-transformed urinary heavy metal(loid) concentration (z), whereas the vertical axis shows the contribution of z to eGFR [h(z)]. eGFR: Estimated glomerular filtration rate; BKMR: Bayesian Kernel Machine Regression.
It should be noted that the vertical axis in this figure directly represents eGFR (adjusted for covariates). Therefore, the values cannot be directly compared to those in the corresponding figure for the disease group [Figure 1], where the vertical axis indicates the Box-Cox-transformed eGFR.
The same analyses shown in Figures 2-4 - examining differences in h(z) across different urinary concentrations z, and joint exposure-response relationships between pairs of metal(loid)s and h(z) - were also conducted for the donor group. The results show little to no evidence of an association between urinary metal(loid) concentrations and eGFR (results not shown).
Model diagnostics
We conducted a comprehensive set of model diagnostics to evaluate the robustness of our findings. Detailed results are provided in the Supplementary Materials (“Model diagnostics” section). Convergence diagnostics confirmed model stability [Supplementary Figure 2 and Supplementary Table 3]. Inspection of prior and posterior distributions indicated appropriate parameter estimation [Supplementary Figure 3]. Posterior predictive checks suggested that the model provided an adequate fit to the data [Supplementary Figures 4 and 5]. Sensitivity analyses confirmed that the observed associations were consistent across different model specifications. Collectively, these diagnostics support the reliability and internal validity of the modeling results.
Urinary metal(loid)s-eGFR associations in the disease group
At first thought, the positive associations between Cd, Hg, and Pb and eGFR observed in the disease group may seem counterintuitive, given that heavy metal(loid)s are established nephrotoxicants known to impair renal function[3,31,34,35]. Yet, positive associations have also been reported in earlier research, indicating that such findings are not unprecedented and may reflect the complex nature of renal physiology and exposure-response relationships. For instance, similar results were reported in an NHANES-based study of healthy adolescents aged 12-19 years[34]. In that study, positive associations were observed between eGFR and urinary metal(loid)s (As, Cd, Hg, and Pb), both as a combined exposure index and when assessed separately. The authors hypothesized that joint metal(loid)s exposure may lead to glomerular hyperfiltration, as there is some evidence linking trace metal exposure (e.g., As, Cd, and Pb) with hyperfiltration[36,37]. However, such associations were not observed for blood metal(loid)s mixture concentrations. In another study by Buser et al.[38], statistically significant positive associations between eGFR and both urinary Cd and urinary Pb were also reported. The authors noted that glomerular hyperfiltration could not be ruled out as a potential explanation.
There is no universally accepted definition of hyperfiltration, but it is commonly defined as a GFR exceeding 120 mL/min/1.73 m2 - typically more than two SDs above the mean GFR in healthy individuals[39]. In the present study, only 12 participants (2%) in the disease group had an eGFR above this threshold. Although eGFR does not perfectly reflect true GFR, these data suggest that only a small subset of participants exhibited values consistent with hyperfiltration, indicating that hyperfiltration is unlikely to solely explain the observed positive associations between urinary metal(loid) concentrations and eGFR.
The observed positive associations could also align with the reverse causality hypothesis proposed by Chaumont et al.[40], Akerstrom et al.[41], and others. This hypothesis suggests that higher urinary metal(loid) levels may reflect preserved renal excretory function - indicating effective elimination of these substances rather than a beneficial effect of exposure on kidney function. Weaver
Collectively, these findings and their possible explanations highlight the complex interplay among exposure, excretion, and disease status, including potential contributions from hyperfiltration, altered tubular handling, and reverse causality. Accordingly, causal interpretations cannot be drawn from this cross-sectional study, and the results should be interpreted with caution within the broader context of biological plausibility and existing evidence.
By contrast, As showed a consistent negative association with the eGFR in the disease group. This divergence between As and the other metals may be attributed to key differences in their toxicokinetics, metabolism, and excretion pathways, as well as the chemical speciation of As measured.
As is primarily excreted via the kidneys after hepatic methylation into mono- and dimethylated As species [monomethylarsonic acid (MMA) and dimethylarsinic acid (DMA)][43,44]. Unlike Cd and Pb, As does not accumulate to the same extent in renal tissue and is cleared through glomerular filtration and active tubular secretion[45]. As targets proximal tubular epithelial cells, which also play a key role in the active secretion of creatinine. Tubular dysfunction may therefore reduce creatinine secretion, leading to increased serum creatinine independent of true changes in glomerular filtration. This could artificially lower estimated eGFR and contribute to the observed negative association. Thus, As-induced changes in tubular creatinine handling cannot be excluded as a contributing mechanism[46]. In addition, As excretion is affected by individual methylation capacity, which may further influence observed associations between other heavy metals and renal function, especially when creatinine-based biomarkers such as eGFR are used.
Furthermore, in this study, total urinary As was measured, which includes both toxic inorganic species and non-toxic organic forms (e.g., arsenobetaine from seafood). The inclusion of non-toxic species may obscure or dilute associations specific to inorganic As (iAs), which is the nephrotoxic form. Although Hg also exists in multiple chemical forms, urinary total Hg in this study primarily reflects inorganic Hg (Hg2+), which is the form most strongly associated with nephrotoxicity[47]. Therefore, our measurements largely capture the exposure fraction most relevant to kidney damage.
Taken together, these considerations suggest that the negative association observed for As is more likely to reflect a robust exposure-response relationship, whereas the positive associations observed for Cd, Hg, and Pb may be at least partially influenced by reverse causality related to impaired renal excretion. Further mechanistic studies are needed to clarify these differential patterns, particularly for As, which may act through distinct biological pathways compared to other metals. However, detailed mechanistic exploration is beyond the scope of the current study.
Moreover, our findings indicate that the associations between individual heavy metal(loid)s and eGFR are largely independent of co-exposure to other metal(loid)s. This pattern suggests that the effects of these exposures on renal function are primarily additive, with no strong evidence of interactions.
Urinary metal(loid)-eGFR associations in the donor group
In the donor group, no statistically significant association was observed between urinary heavy metal(loid) concentrations and eGFR. This finding was anticipated, as these individuals had not yet undergone nephrectomy and were generally healthy, with normal renal function and preserved renal reserve capacity. In such populations, the kidneys are typically able to effectively compensate for low-level toxic exposures, which may attenuate or mask any detectable associations between urinary metal(loid) levels and renal function[6,48].
These findings emphasize the importance of establishing exposure-response relationships between heavy metal(loid)s and renal function specifically in vulnerable populations, where the impact of exposure is more likely to be detectable. This also highlights the possible limitations of relying solely on low-risk populations to assess environmental nephrotoxicity.
Comparison of the associations in the disease and donor groups
In the disease group, clear associations between metal(loid) exposure and renal function were observed. In contrast, no significant associations were detected in the donor group, suggesting that metal(loid) exposure may have a limited measurable impact on renal function in otherwise healthy individuals. Alternatively, it is possible that eGFR is not sufficiently sensitive to detect early renal damage in healthy populations due to compensatory renal mechanisms. In such cases, more sensitive biomarkers of kidney injury may be required to capture subclinical effects or early renal functional impairment, e.g., kidney injury molecule-1
Strengths of the current study
A major strength of the current study is the inclusion of both a clinically well-defined kidney patient group and a healthy donor group, which enables robust comparisons and enhances the relevance of our findings to public health and clinical research. The focus on kidney patients, a biologically sensitive subgroup, increases the likelihood of detecting subtle associations between metal(loid) exposure and renal function that may be less apparent in a healthy population. This is in line with prior research suggesting that individuals with impaired renal function may exhibit increased susceptibility to even low levels of environmental toxicants[54], as well as with our finding that the donor group did not show significant associations between urinary heavy metal(loid) concentrations and eGFR. Another strength of this study is the use of 24-hour urine collections for biomarker assessment, which are considered the gold standard for exposure measurement. This approach eliminates the need for potentially biased creatinine adjustments required in spot urine samples, thereby enhancing the accuracy and reliability of the exposure data.
In addition to the strengths of the dataset, we used BKMR, a flexible and advanced modeling approach that allows for the simultaneous evaluation of multiple exposures while accounting for potential nonlinear and non-additive effects. This is particularly important when assessing environmental mixtures, such as heavy metal(loid)s, where complex interactions could be expected but are often overlooked in traditional linear models. Although our results did not indicate interactions among the different heavy metal(loid)s, we argue that it is important to not exclude such interactions a priori, and therefore to use a model that accommodates them.
Furthermore, we performed a comprehensive set of model diagnostics - including convergence checks, prior and posterior distribution checks, posterior predictive checks, and sensitivity analyses - to rigorously assess model performance and ensure the robustness and reliability of our findings. To our knowledge, such comprehensive modeling and validation procedures have rarely been implemented in previous epidemiological studies of heavy metal(loid) exposure and renal function, making our approach both methodologically rigorous and innovative.
Limitations and implications for future research
While this study offers several methodological strengths, its limitations or challenges should be considered when interpreting the results. The findings also highlight key areas for future research, particularly the need for longitudinal designs to clarify causal pathways and the role of early renal responses such as hyperfiltration.
Biomarkers of exposure
In this study, urine was selected as the biological matrix for assessing metal(loid) exposure. It is a well-established and appropriate matrix for evaluating exposure to certain metals, such as Cd, Hg, and iAs. In contrast, urine may not be the most appropriate biomarker for assessing Pb exposure, as Pb primarily accumulates in bone and is more reliably measured in blood. Furthermore, the use of total urinary As in the current study, rather than speciated forms, limits the accuracy of exposure assessment. These limitations are discussed in more detail below.
Over the past five decades, whole blood has been the primary biological fluid used to assess Pb exposure, for screening and diagnostic purposes and for long-term biomonitoring. Most Pb in blood is bound to erythrocytes, making whole blood the most accurate matrix for assessing Pb exposure. Blood Pb (B-Pb) is preferred for assessing low-level environmental Pb exposure due to its linear relationship with Pb intake and its ability to reflect chronic exposure, given the continuous equilibrium between blood/soft tissue Pb (half-life: 20-40 days) and skeletal Pb (half-life: 10-30 years). Most human exposure and health effect data are based on B-Pb[55]. Urinary Pb primarily reflects recent exposure and lacks a direct correlation with health effects. Furthermore, plasma Pb has been suggested to reflect the fraction of circulating Pb that is freely available for exchange with tissues and is filtered by the kidneys to form the ultrafiltrate, to which renal tubular epithelial cells are directly exposed. Therefore, plasma Pb may more closely represent the renal burden of Pb and serve as a biomarker for assessing renal function risk[56]. Taken together, plasma Pb may be considered a valuable alternative biomarker for Pb exposure in future studies, particularly those focusing on renal function.
In the present study, B-Pb concentrations were available only for the donor group, whereas no blood measurements were collected for the disease group. As a result, urinary Pb was used as the biomarker of exposure. Future research should aim to include B-Pb measurements in both groups to enable a more comprehensive and reliable assessment of Pb exposure. While urine is a commonly used biological matrix for assessing metal(loid) exposure, its use in studies of renal function presents specific challenges. Urinary concentrations may not solely reflect external exposure but can also be influenced by renal excretory and reabsorptive capacity. This raises concerns about potential reverse causality, whereby renal function affects heavy metal(loid) levels rather than heavy metal(loid) exposure influencing renal function.
iAs is a genotoxic carcinogen; however, there is currently no universally accepted biomarker for chronic iAs exposure. Measurements of total As in blood or urine are of limited value, as they reflect not only iAs but also less toxic organic As species. In contrast, quantification of iAs and its methylated metabolites - MMA and DMA - or their sum (referred to as urinary total inorganic arsenic, u-tiAs) provides a more accurate estimate of iAs exposure. Urine is generally considered the preferred matrix for assessing As exposure in human biomonitoring[55]. As a limitation, the present study measured only total urinary As, which does not distinguish between inorganic and organic species. Future studies should consider measuring u-tiAs for a more accurate evaluation of iAs exposure.
Given this complexity, urine alone may not be sufficient to reliably capture the association between heavy metal(loid) exposure and renal function. To strengthen future research in this area, it would be beneficial to incorporate additional human biomonitoring matrices, such as blood and plasma, which may provide complementary information and help distinguish exposure from excretion-related effects. A multi-matrix approach could improve the accuracy of exposure assessment and enhance understanding of the relationship between metal(loid) exposure and renal function.
Cross-sectional study design
While the associations observed in this study are clear, the cross-sectional design limits the ability to infer causality. Because exposure and outcome were measured at a single time point, it is not possible to determine whether heavy metal(loid) exposure preceded changes in renal function or vice versa.
Although the cross-sectional design limits causal inference and precludes the assessment of temporal relationships, the findings provide useful population-specific exposure-outcome estimates. These data help identify potentially susceptible subgroups and generate hypotheses for future research. Moreover, the results can inform the design of longitudinal and mechanistic studies and contribute to refining future risk assessment efforts by providing empirical evidence on associations between heavy metal(loid) exposure and renal function.
To establish temporal relationships and better understand potential causal pathways, future longitudinal studies would be valuable. Such studies could assess how changes in exposure over time relate to renal function decline and help clarify whether the observed associations reflect true nephrotoxic effects (e.g., in the case of As) or are influenced by reverse causation (e.g., for the other three metals).
Future longitudinal epidemiological studies should explore potential interactions among different metal(loid)s, as well as effect modification by individual characteristics (e.g., age, comorbidities, or genetic susceptibility), to improve the understanding of how mixed exposures influence renal function over time.
Challenges in capturing all relevant confounders
An additional limitation is that the disease and donor groups were derived from two distinct cohorts, which may differ in recruitment strategies, population characteristics, and unmeasured lifestyle or socioeconomic factors. Although we adjusted for key measured covariates, potential residual confounding due to unmeasured cohort-specific factors cannot be fully excluded.
The absence of these variables may have introduced uncontrolled variability that could influence the observed associations. Fortunately, the chosen BKMR model allows adjustment for a large set of confounders. Future research should aim to incorporate a more comprehensive range of individual and environmental risk factors and further explore the combined effects of multiple metal(loid)s and other environmental toxicants to gain a deeper understanding of their cumulative impact on kidney health.
CONCLUSIONS
This study aimed to evaluate the individual and combined associations between urinary concentrations of selected heavy metal(loid)s and renal function in two distinct Dutch populations with differing kidney status.
In individuals with kidney disease, weak positive associations were observed between urinary Cd, Hg, and Pb and eGFR, whereas urinary total As showed a weak inverse association with eGFR. No statistically significant associations were detected in healthy kidney donors, and no strong interaction effects among metal(loid)s were identified.
These findings highlight the complexity of exposure-renal function relationships and underscore the need for longitudinal and mechanistic studies to clarify the underlying biological pathways.
DECLARATIONS
Acknowledgments
The authors extend appreciation to Jan G. Nijhoff (University Medical Center Groningen) for performing the urinary analyses, and Lianne de Wit-Bos and Jan van de Kassteele (National Institute for Public Health and the Environment) for their critical review of the manuscript.
Authors’ contributions
Methodology, formal analysis, writing - original draft: Chen, W.
Investigation, resources, data curation: Rawee, P.
Formal analysis, validation: Rodenburg, J.
Project administration, writing - review and editing: Jeurissen, S.
Investigation, resources: Nederlof, R.
Formal analysis: Touw, D. J.
Conceptualization: de Borst, M. H.; Bakker, S. J. L.
Conceptualization, supervision: Mengelers, M.
Availability of data and materials
The data supporting the findings of this study are available from the University Medical Center Groningen, but restrictions apply to the availability of these data, which were used under license for the current study, and are therefore not publicly available. The data are available from the corresponding author upon reasonable request and with permission from the University Medical Center Groningen. The raw data supporting the findings of this study are available within this Article and its Supplementary Materials. Further data are available from the corresponding authors upon request.
AI and AI-assisted tools statement
Not applicable.
Financial support and sponsorship
This research was funded by the Netherlands Food and Consumer Product Safety Authority (NVWA) (Project No. 90467).
Conflicts of interest
All authors declared that there are no conflicts of interest.
Ethical approval and consent to participate
This study was approved by the Medical Ethical Committee of the University Medical Center Groningen (M09.074242 for the Parelsnoer cohort and # 2014/077 for the TransplantLines cohort). All participants provided written informed consent prior to inclusion in the study.
Consent for publication
Not applicable.
Copyright
© The Author(s) 2026.
Supplementary Materials
REFERENCES
1. Balali-Mood, M.; Naseri, K.; Tahergorabi, Z.; Khazdair, M. R.; Sadeghi, M. Toxic mechanisms of five heavy metals: mercury, lead, chromium, cadmium, and arsenic. Front. Pharmacol. 2021, 12, 643972.
3. Lentini, P.; Zanoli, L.; Granata, A.; Signorelli, S. S.; Castellino, P.; Dell’Aquila, R. Kidney and heavy metals - the role of environmental exposure (Review). Mol. Med. Rep. 2017, 15, 3413-9.
4. Barbier, O.; Jacquillet, G.; Tauc, M.; Cougnon, M.; Poujeol, P. Effect of heavy metals on, and handling by, the kidney. Nephron. Physiol. 2005, 99, p105-10.
5. Orr, S. E.; Bridges, C. C. Chronic kidney disease and exposure to nephrotoxic metals. Int. J. Mol. Sci. 2017, 18, 1039.
6. Schnellmann, R. G. Toxic responses of the kidney. In Casarett & Doull’s Essentials of Toxicology; McGraw Hill; 2021. https://accesspharmacy.mhmedical.com/content.aspx?bookid=3000§ionid=252314136. (accessed 2026-04-20).
7. Aaseth, J.; Alexander, J.; Alehagen, U.; et al. The aging kidney - as influenced by heavy metal exposure and selenium supplementation. Biomolecules 2021, 11, 1078.
8. de Wit-Bos, L.; Chen, W.; van den Brand, A.; et al. Risk assessment of the mixture of cadmium and lead for people over fifty. 2024. https://rivm.openrepository.com/handle/10029/627888. (accessed 2026-04-20).
9. Wang, R.; Long, T.; He, J.; et al. Associations of multiple plasma metals with chronic kidney disease in patients with diabetes. Ecotoxicol. Environ. Saf. 2022, 244, 114048.
10. Wu, W.; Zhang, K.; Jiang, S.; et al. Association of co-exposure to heavy metals with renal function in a hypertensive population. Environ. Int. 2018, 112, 198-206.
11. Bobb, J. F.; Valeri, L.; Claus Henn, B.; et al. Bayesian kernel machine regression for estimating the health effects of multi-pollutant mixtures. Biostatistics 2015, 16, 493-508.
12. Bobb, J. F.; Claus Henn, B.; Valeri, L.; Coull, B. A. Statistical software for analyzing the health effects of multiple concurrent exposures via Bayesian kernel machine regression. Environ. Health. 2018, 17, 67.
13. Hou, J.; Yin, W.; Li, P.; et al. Joint effect of polycyclic aromatic hydrocarbons and phthalates exposure on telomere length and lung function. J. Hazard. Mater. 2020, 386, 121663.
14. Yu, L.; Yang, M.; Cheng, M.; et al. Associations between urinary phthalate metabolite concentrations and markers of liver injury in the US adult population. Environ. Int. 2021, 155, 106608.
15. Yu, L.; Liu, W.; Wang, X.; et al. A review of practical statistical methods used in epidemiological studies to estimate the health effects of multi-pollutant mixture. Environ. Pollut. 2022, 306, 119356.
16. Zhang, Y.; Dong, T.; Hu, W.; et al. Association between exposure to a mixture of phenols, pesticides, and phthalates and obesity: comparison of three statistical models. Environ. Int. 2019, 123, 325-36.
17. Manniën, J.; Ledderhof, T.; Verspaget, H. W.; et al. The Parelsnoer Institute: A national network of standardized clinical biobanks in the Netherlands. Open. J. Bioresour. 2017, 4, 3.
18. Navis, G. J.; Blankestijn, P. J.; Deegens, J.; et al.; BIND-NL investigators. The Biobank of Nephrological Diseases in the Netherlands cohort: the String of Pearls Initiative collaboration on chronic kidney disease in the university medical centers in the Netherlands. Nephrol. Dial. Transplant. 2014, 29, 1145-50.
19. Stevens, P. E.; Levin, A.; Kidney Disease: Improving Global Outcomes Chronic Kidney Disease Guideline Development Work Group Members. Evaluation and management of chronic kidney disease: synopsis of the kidney disease: improving global outcomes 2012 clinical practice guideline. Ann. Intern. Med. 2013, 158, 825-30.
20. Levey, A. S.; Stevens, L. A.; Schmid, C. H.; et al.; CKD-EPI (Chronic Kidney Disease Epidemiology Collaboration). A new equation to estimate glomerular filtration rate. Ann. Intern. Med. 2009, 150, 604-12.
21. WHO. Regional Office for the Western Pacific. Noncommunicable disease education manual for primary health care professionals and patients. 2017. https://iris.who.int/handle/10665/254746. (accessed 2026-04-20).
22. American Diabetes Association Professional Practice Committee. 2. Diagnosis and classification of diabetes: Standards of Care in Diabetes-2025. Diabetes. Care. 2025, 48, S27-49.
23. Grundy, S. M.; Stone, N. J.; Bailey, A. L.; et al. 2018 AHA/ACC/AACVPR/AAPA/ABC/ACPM/ADA/AGS/APhA/ASPC/NLA/PCNA Guideline on the management of blood cholesterol: A report of the American College of Cardiology/American Heart Association Task Force on Clinical Practice Guidelines. J. Am. Coll. Cardiol. 2019, 73, e285-350.
24. CDC. National Center for Environmental Health (U.S.), Division of Laboratory Sciences, National Health and Nutrition Examination Survey (U.S.). Fourth National Report on human exposure to environmental chemicals. 2009. https://stacks.cdc.gov/view/cdc/21813. (accessed 2026-04-20).
25. Gil, F.; Hernández, A. F. Toxicological importance of human biomonitoring of metallic and metalloid elements in different biological samples. Food. Chem. Toxicol. 2015, 80, 287-97.
26. Health Canada. Third report on human biomonitoring of environmental chemicals in Canada. 2015. https://www.canada.ca/content/dam/hc-sc/migration/hc-sc/ewh-semt/alt_formats/pdf/pubs/contaminants/chms-ecms-cycle3/chms-ecms-cycle3-eng.pdf. (accessed 2026-04-20).
27. Jalili, C.; Kazemi, M.; Cheng, H.; et al. Associations between exposure to heavy metals and the risk of chronic kidney disease: a systematic review and meta-analysis. Crit. Rev. Toxicol. 2021, 51, 165-82.
28. Nguyen, H. D. Interactions between heavy metal mixtures and kidney function: gender-stratified analyses. Expo. Health. 2024, 16, 821-36.
29. Kim, N. H.; Hyun, Y. Y.; Lee, K. B.; et al. Environmental heavy metal exposure and chronic kidney disease in the general population. J. Korean. Med. Sci. 2015, 30, 272-7.
30. Bourgonje, A. R.; Abdulle, A. E.; Bourgonje, M. F.; et al. Serum free sulfhydryl status associates with new-onset chronic kidney disease in the general population. Redox. Biol. 2021, 48, 102211.
31. Nan, Y.; Yang, J.; Yang, J.; Wei, L.; Bai, Y. Associations between individual and combined metal exposures in whole blood and kidney function in U.S. adults aged 40 years and older. Biol. Trace. Elem. Res. 2024, 202, 850-65.
32. Hernán, M. A.; Hernández-Díaz, S.; Werler, M. M.; Mitchell, A. A. Causal knowledge as a prerequisite for confounding evaluation: an application to birth defects epidemiology. Am. J. Epidemiol. 2002, 155, 176-84.
33. Devick, K. BKMR plot functions for multiply imputed data. 2019. https://github.com/kdevick/bkmr_MI. (accessed 2026-04-20).
34. Sanders, A. P.; Mazzella, M. J.; Malin, A. J.; et al. Combined exposure to lead, cadmium, mercury, and arsenic and kidney health in adolescents age 12-19 in NHANES 2009-2014. Environ. Int. 2019, 131, 104993.
35. Zhou, T. T.; Hu, B.; Meng, X. L.; et al. The associations between urinary metals and metal mixtures and kidney function in Chinese community-dwelling older adults with diabetes mellitus. Ecotoxicol. Environ. Saf. 2021, 226, 112829.
36. Jin, R.; Zhu, X.; Shrubsole, M. J.; Yu, C.; Xia, Z.; Dai, Q. Associations of renal function with urinary excretion of metals: evidence from NHANES 2003-2012. Environ. Int. 2018, 121, 1355-62.
37. Weaver, V. M.; Kim, N. S.; Jaar, B. G.; et al. Associations of low-level urine cadmium with kidney function in lead workers. Occup. Environ. Med. 2011, 68, 250-6.
38. Buser, M. C.; Ingber, S. Z.; Raines, N.; Fowler, D. A.; Scinicariello, F. Urinary and blood cadmium and lead and kidney function: NHANES 2007-2012. Int. J. Hyg. Environ. Health. 2016, 219, 261-7.
39. Cortinovis, M.; Perico, N.; Ruggenenti, P.; Remuzzi, A.; Remuzzi, G. Glomerular hyperfiltration. Nat. Rev. Nephrol. 2022, 18, 435-51.
40. Chaumont, A.; Nickmilder, M.; Dumont, X.; Lundh, T.; Skerfving, S.; Bernard, A. Associations between proteins and heavy metals in urine at low environmental exposures: evidence of reverse causality. Toxicol. Lett. 2012, 210, 345-52.
41. Akerstrom, M.; Barregard, L.; Lundh, T.; Sallsten, G. The relationship between cadmium in kidney and cadmium in urine and blood in an environmentally exposed population. Toxicol. Appl. Pharmacol. 2013, 268, 286-93.
42. Weaver, V. M.; Kotchmar, D. J.; Fadrowski, J. J.; Silbergeld, E. K. Challenges for environmental epidemiology research: are biomarker concentrations altered by kidney function or urine concentration adjustment? J. Expo. Sci. Environ. Epidemiol. 2016, 26, 1-8.
43. Suzuki, K. T.; Mandal, B. K.; Ogra, Y. Speciation of arsenic in body fluids. Talanta 2002, 58, 111-9.
45. Carmine, T. C. Non-linear creatinine dilution adjustment of exemplary urine arsenic - Part I: curving the lines. SSRN 2023.
46. Weidemann, D.; Kuo, C. C.; Navas-Acien, A.; Abraham, A. G.; Weaver, V.; Fadrowski, J. Association of arsenic with kidney function in adolescents and young adults: results from the National Health and Nutrition Examination Survey 2009-2012. Environ. Res. 2015, 140, 317-24.
47. Bridges, C. C.; Zalups, R. K. The aging kidney and the nephrotoxic effects of mercury. J. Toxicol. Environ. Health. B. Crit. Rev. 2017, 20, 55-80.
48. de Burbure, C.; Buchet, J. P.; Bernard, A.; et al. Biomarkers of renal effects in children and adults with low environmental exposure to heavy metals. J. Toxicol. Environ. Health. A. 2003, 66, 783-98.
49. Schmidt, I, M.; Srivastava, A.; Sabbisetti, V.; et al.; Chronic Kidney Disease Biomarkers Consortium and the CRIC Study Investigators. Plasma kidney injury molecule 1 in CKD: findings from the Boston Kidney Biopsy cohort and CRIC studies. Am. J. Kidney. Dis. 2022, 79, 231-43.e1.
50. Prozialeck, W. C.; Vaidya, V. S.; Liu, J.; et al. Kidney injury molecule-1 is an early biomarker of cadmium nephrotoxicity. Kidney. Int. 2007, 72, 985-93.
51. Inker, L. A.; Tighiouart, H.; Coresh, J.; et al. GFR estimation using β-trace protein and β2-microglobulin in CKD. Am. J. Kidney. Dis. 2016, 67, 40-8.
52. Novak, R.; Salai, G.; Hrkac, S.; Vojtusek, I. K.; Grgurevic, L. Revisiting the role of NAG across the continuum of kidney disease. Bioengineering 2023, 10, 444.
53. Randers, E.; Erlandsen, E. J. Serum cystatin C as an endogenous marker of the renal function - a review. Clin. Chem. Lab. Med. 1999, 37, 389-95.
54. Danziger, J.; Dodge, L. E.; Hu, H.; Mukamal, K. J. Susceptibility to environmental heavy metal toxicity among Americans with kidney disease. Kidney360 2022, 3, 1191-6.
55. Schrenk, D.; Bignami, M.; Bodin, L.; et al.; EFSA Panel on Contaminants in the Food Chain (CONTAM). Update of the risk assessment of inorganic arsenic in food. EFSA. J. 2024, 22, e8488.
Cite This Article
How to Cite
Download Citation
Export Citation File:
Type of Import
Tips on Downloading Citation
Citation Manager File Format
Type of Import
Direct Import: When the Direct Import option is selected (the default state), a dialogue box will give you the option to Save or Open the downloaded citation data. Choosing Open will either launch your citation manager or give you a choice of applications with which to use the metadata. The Save option saves the file locally for later use.
Indirect Import: When the Indirect Import option is selected, the metadata is displayed and may be copied and pasted as needed.
About This Article
Special Topic
Copyright

Data & Comments
Data
0


Comments
Comments must be written in English. Spam, offensive content, impersonation, and private information will not be permitted. If any comment is reported and identified as inappropriate content by OAE staff, the comment will be removed without notice. If you have any queries or need any help, please contact us at [email protected].