

fig3
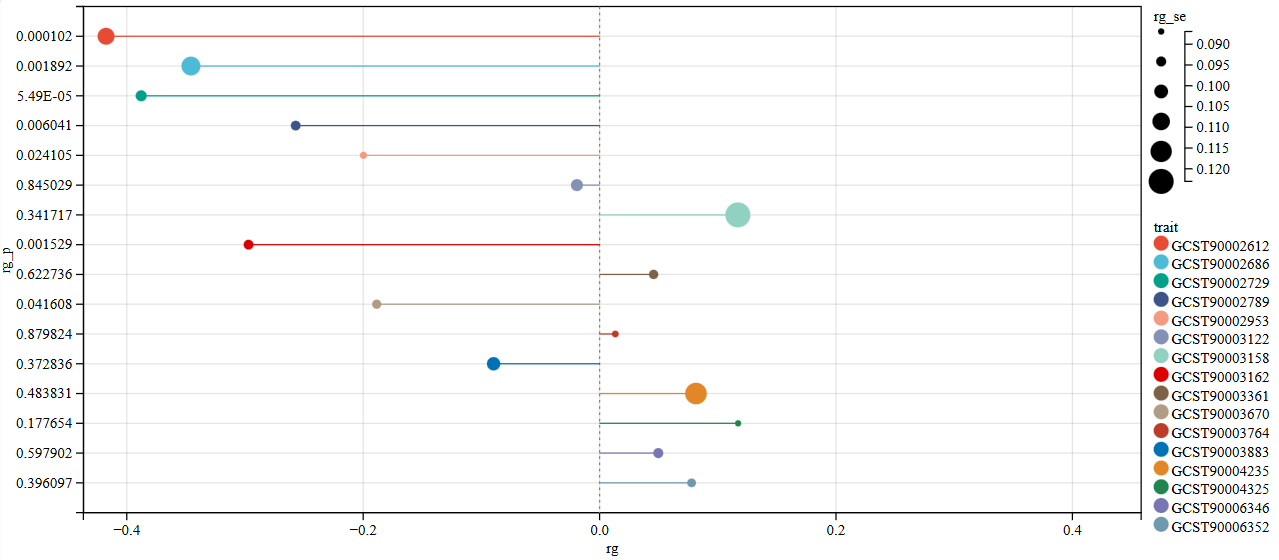
Figure 3. LDSC genetic correlation results between brain structure and OP. rg represents the degree of correlation, and rg_p < 0.05 indicates a genetic correlation. LDSC: linkage disequilibrium score regression; OP: osteoporosis.
Figure 3. LDSC genetic correlation results between brain structure and OP. rg represents the degree of correlation, and rg_p < 0.05 indicates a genetic correlation. LDSC: linkage disequilibrium score regression; OP: osteoporosis.

