fig2

Differential expression and prognostic significance of ANKRD6 in colon adenocarcinoma: a pan-cancer analysis and pathway-specific investigation

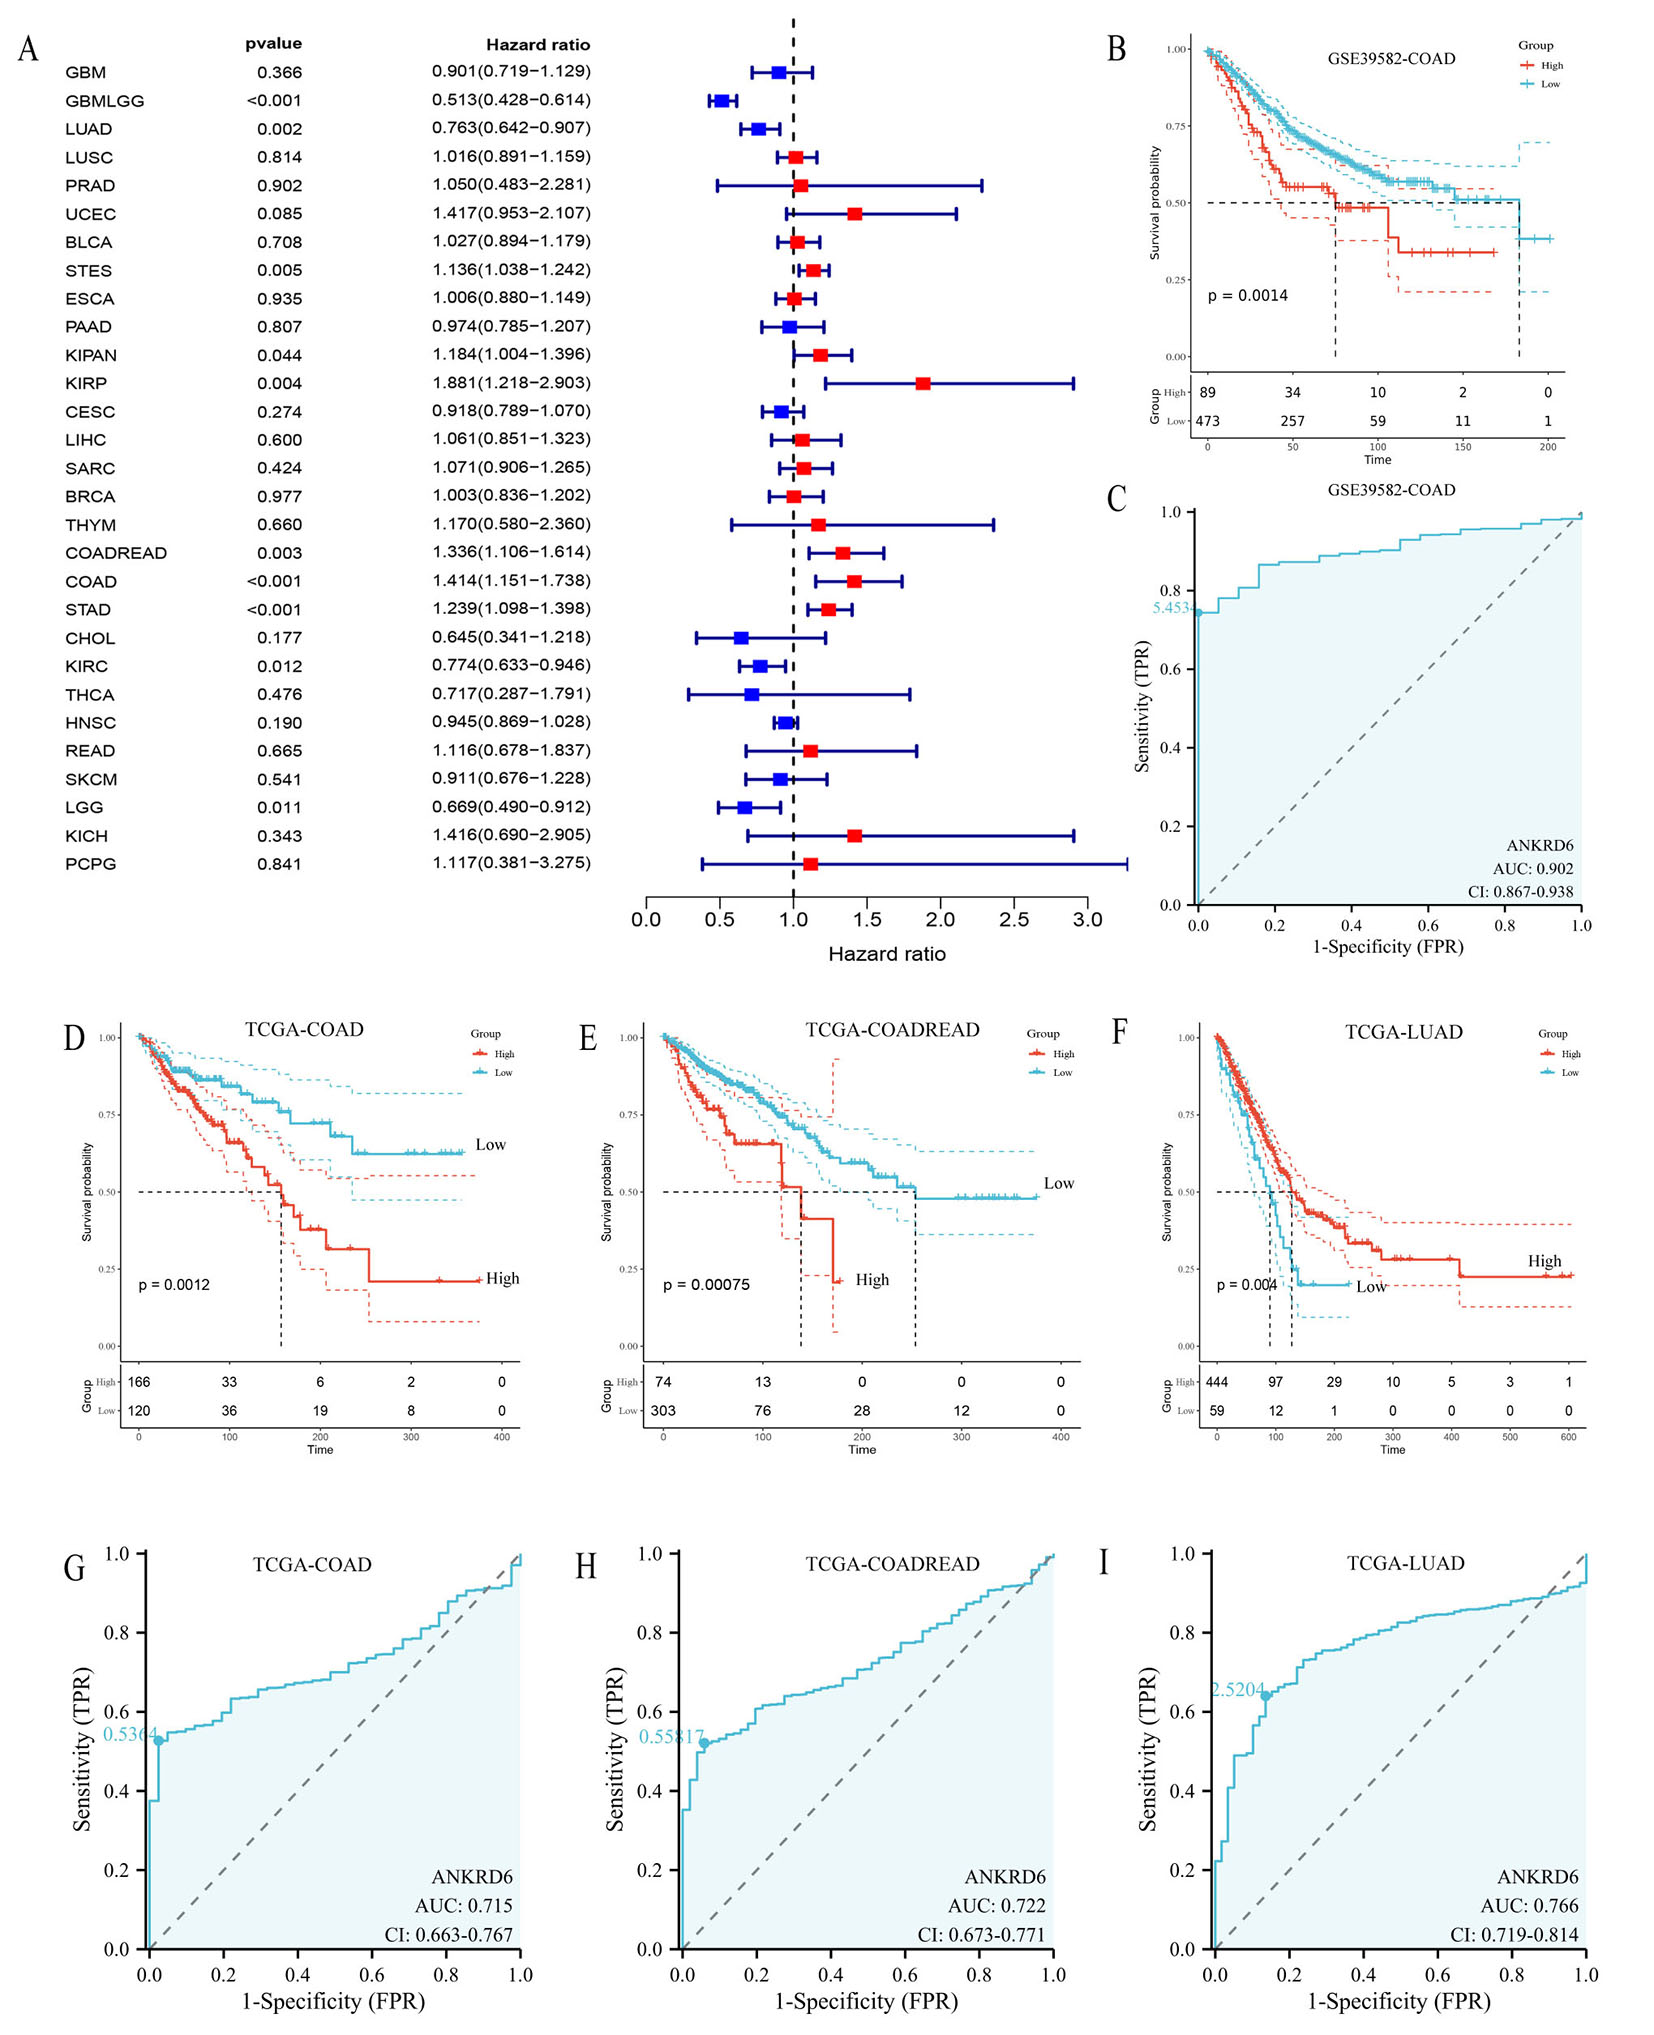
Figure 2. Association between ANKRD6 expression and cancer prognosis and diagnostic efficacy. (A) Forest plot illustrating the association between ANKRD6 expression and overall survival across multiple cancer types (TCGA), with statistical significance (P < 0.05). (B) Kaplan-Meier survival curve of ANKRD6 expression in the GSE39582 cohort, showing significantly lower survival in the high-expression group (P = 0.0014). (C) ROC curve for ANKRD6 in the GSE39582 cohort, indicating excellent diagnostic performance (AUC = 0.902, 95%CI: 0.867-0.938). (D-F) Kaplan-Meier survival curves for COAD, COADREAD, and LUAD with explicit labels for high- and low-expression groups in the legend. Tumor types are indicated at the top of each panel to facilitate interpretation. Patients with high ANKRD6 expression show significantly lower survival in COAD and COADREAD (P = 0.0012) but better survival in LUAD (P < 0.01). (G-I) ROC curve analysis evaluating the diagnostic efficacy of ANKRD6, with tumor type labels shown at the top of each panel. AUC values exceed 0.7, indicating moderate diagnostic performance.

Journal of Cancer Metastasis and Treatment
ISSN 2454-2857 (Online) 2394-4722 (Print)

Portico

All published articles are preserved here permanently:

https://www.portico.org/publishers/oae/

Portico

All published articles are preserved here permanently:

https://www.portico.org/publishers/oae/