


fig7
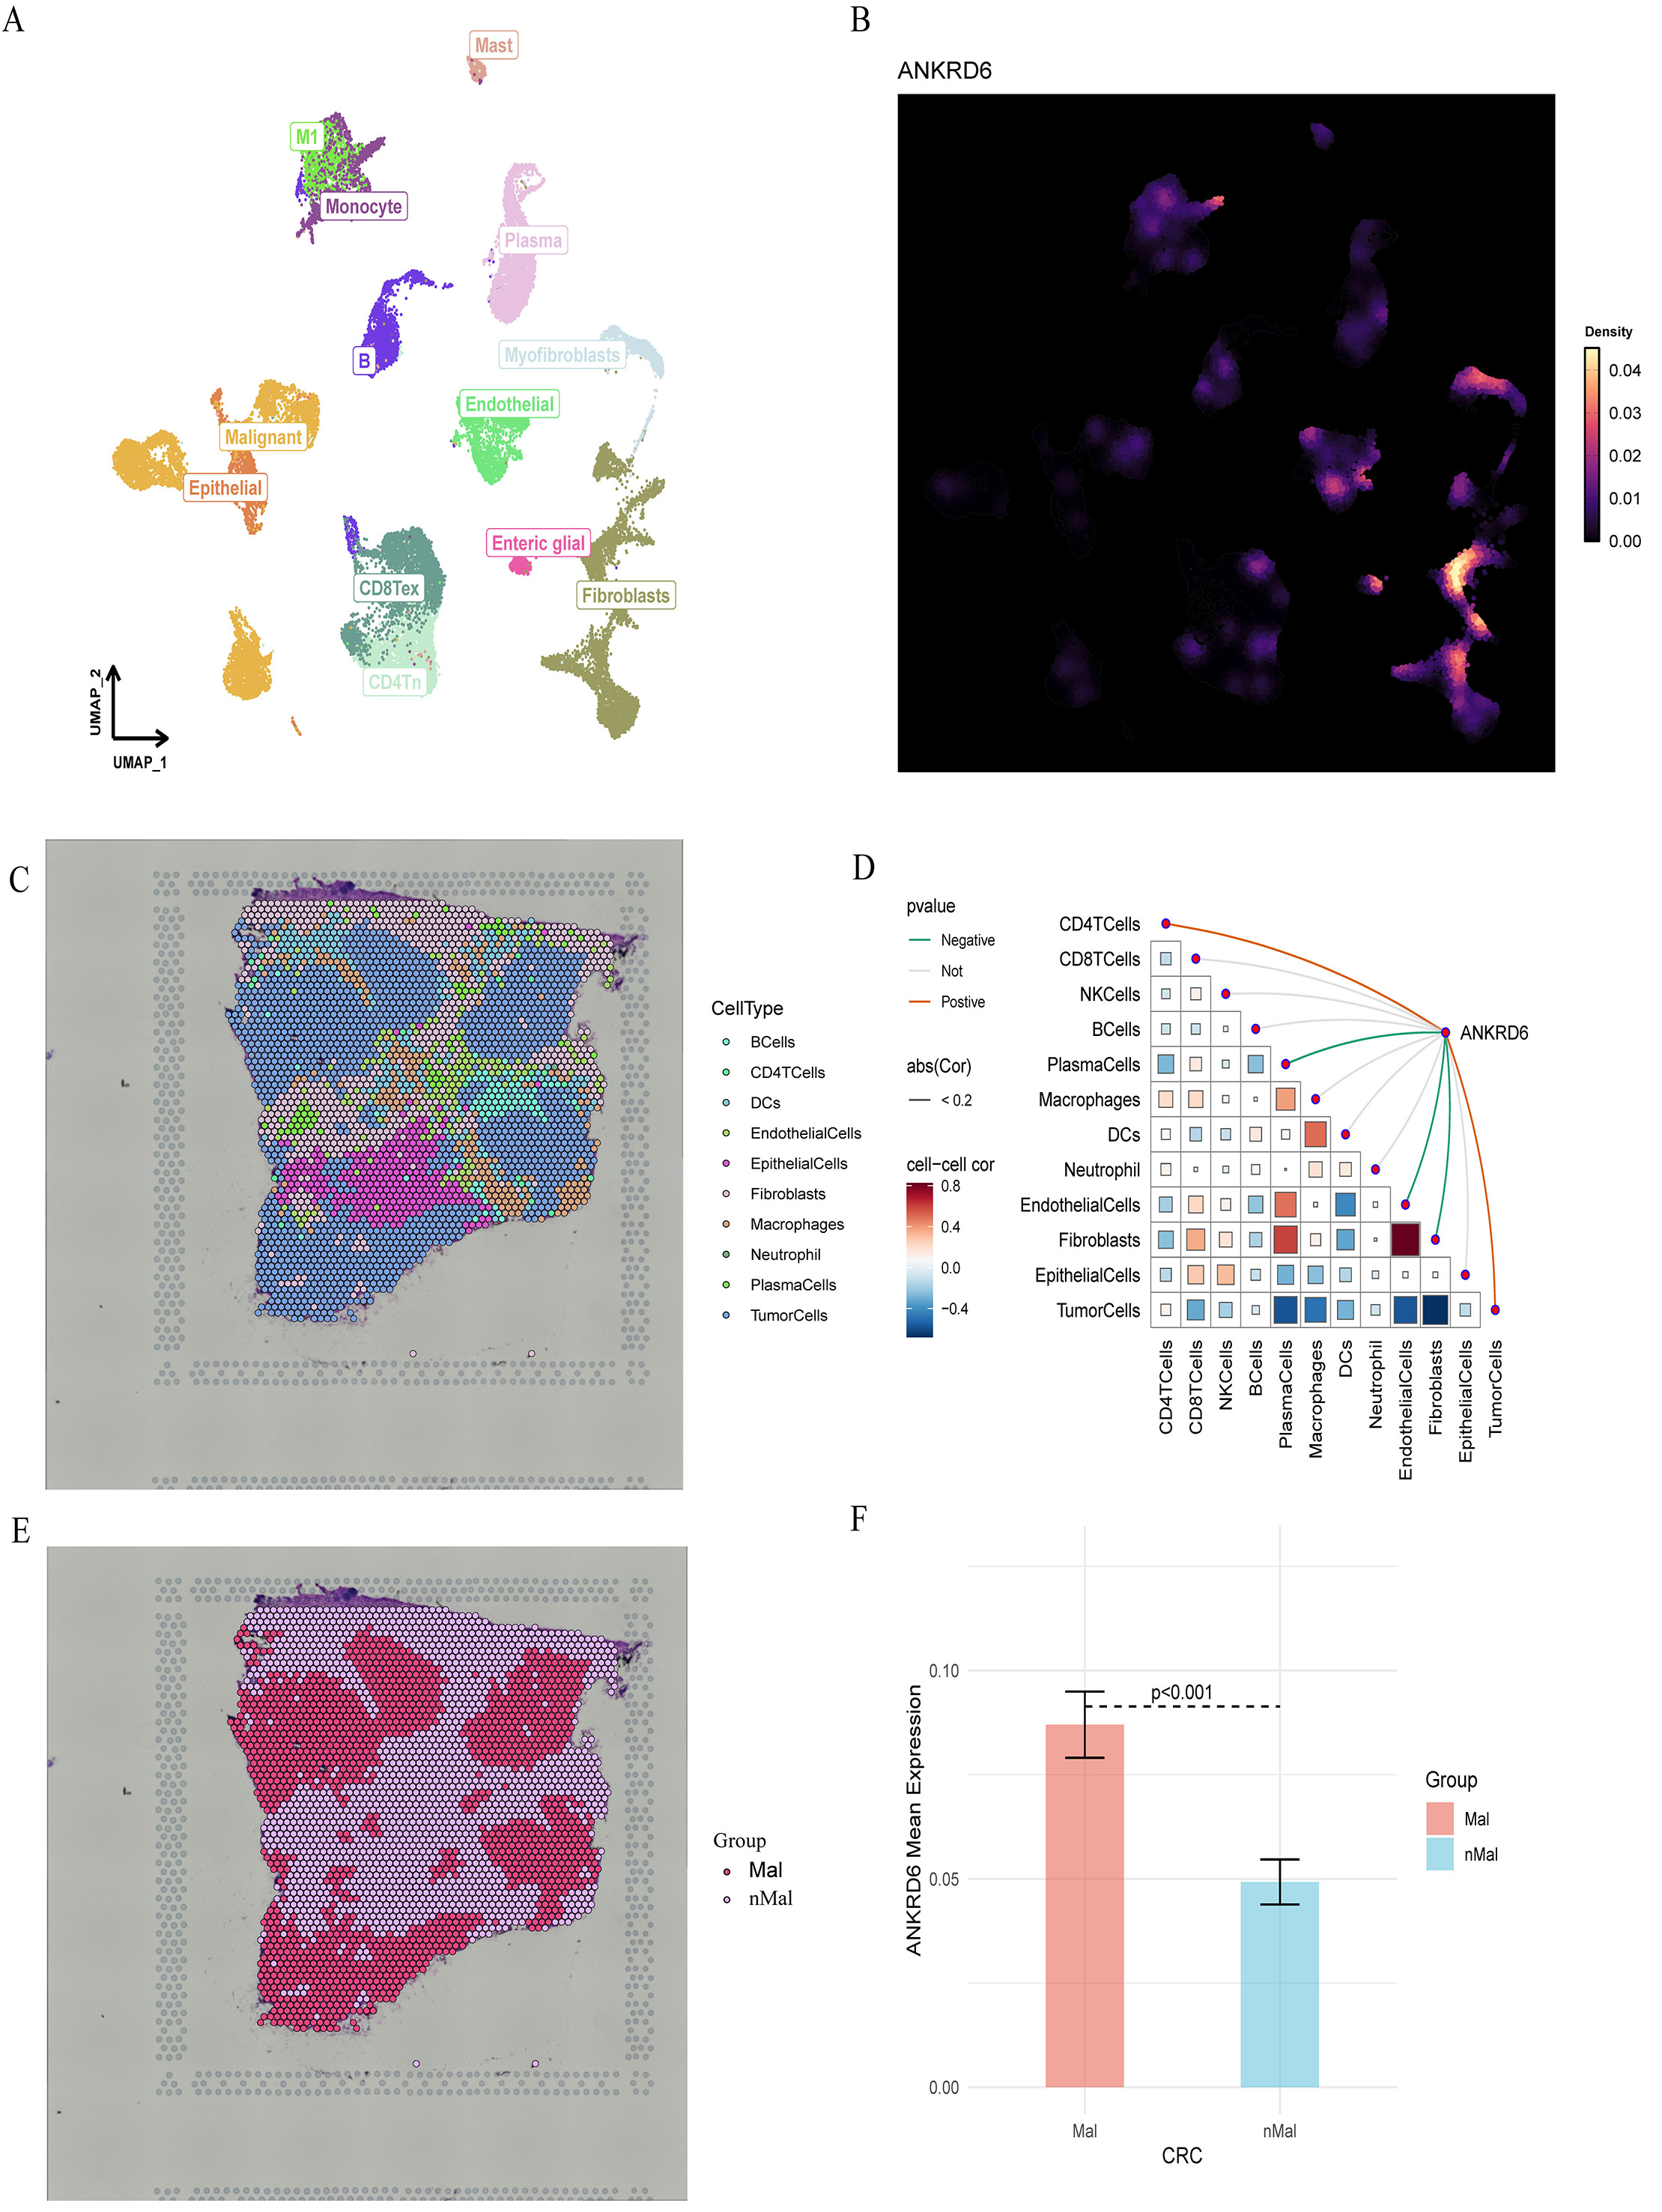
Figure 7. Single-cell and spatial transcriptomic analysis of ANKRD6 in colorectal cancer (COAD). (A) UMAP clustering of major cellular populations. (B) Single-cell expression distribution of ANKRD6. (C) Spatial transcriptomic cell-type mapping showing the distribution of ten major cellular lineages across colorectal tumor sections. (D) Correlation matrix and interaction network of ANKRD6 with major cell types. Red, green, and gray lines denote positive, negative, and non-significant correlations, with line thickness indicating correlation strength. In the triangular heatmap, red and blue squares represent positive and negative correlations; color depth reflects P-value significance, and square size indicates the absolute correlation coefficient. (E) Spatial segmentation of malignant (Mal) and non-malignant (nMal) regions. (F) Quantitative comparison of ANKRD6 expression between malignant and non-malignant regions, showing significantly elevated expression in malignant areas (P < 0.001; independent-sample t test).


