
Figure2
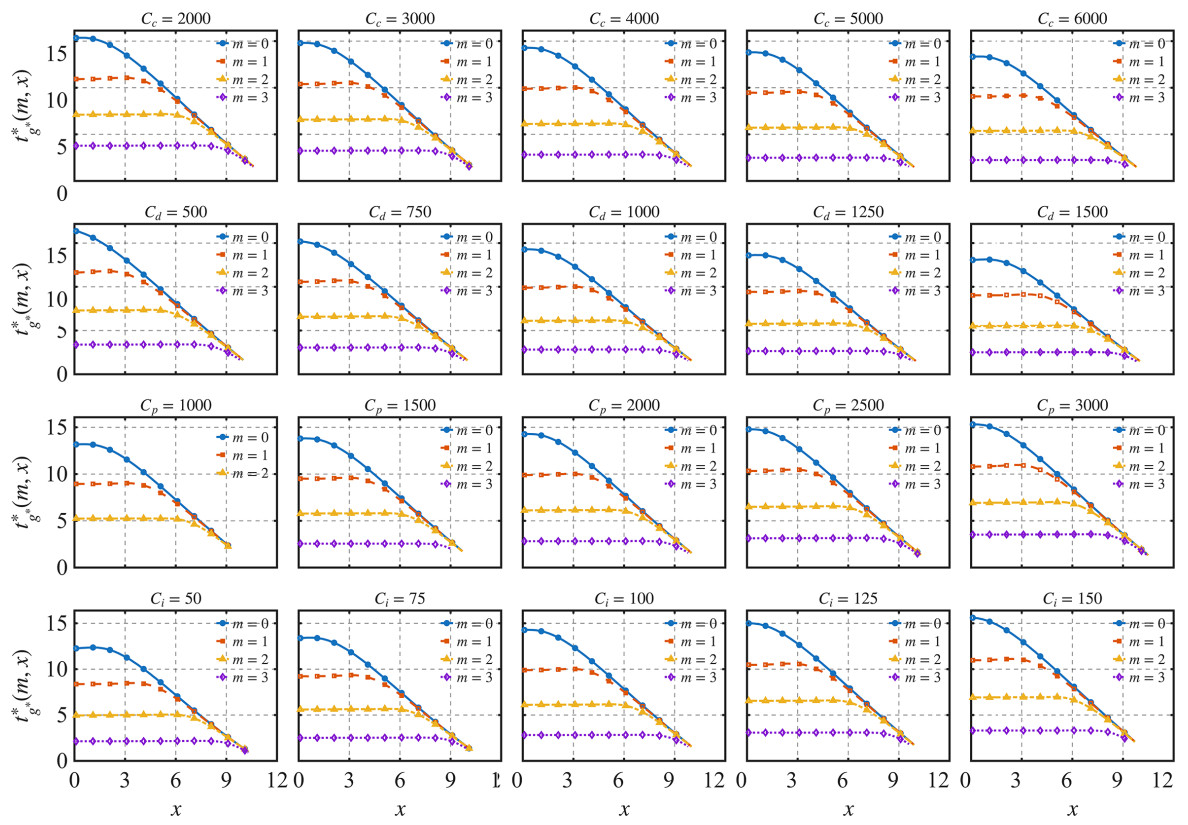
Figure 2. Sensitivity of the optimal inspection interval with respect to cost parameters. Different curves represent different accumulated shock states m and are distinguished by line styles and markers.

Figure 2. Sensitivity of the optimal inspection interval with respect to cost parameters. Different curves represent different accumulated shock states m and are distinguished by line styles and markers.


All published articles are preserved here permanently:
https://www.portico.org/publishers/oae/