


Life-cycle environmental analysis of combined biochar and agrivoltaic systems in Andalusian olive groves
 0
0 Abstract
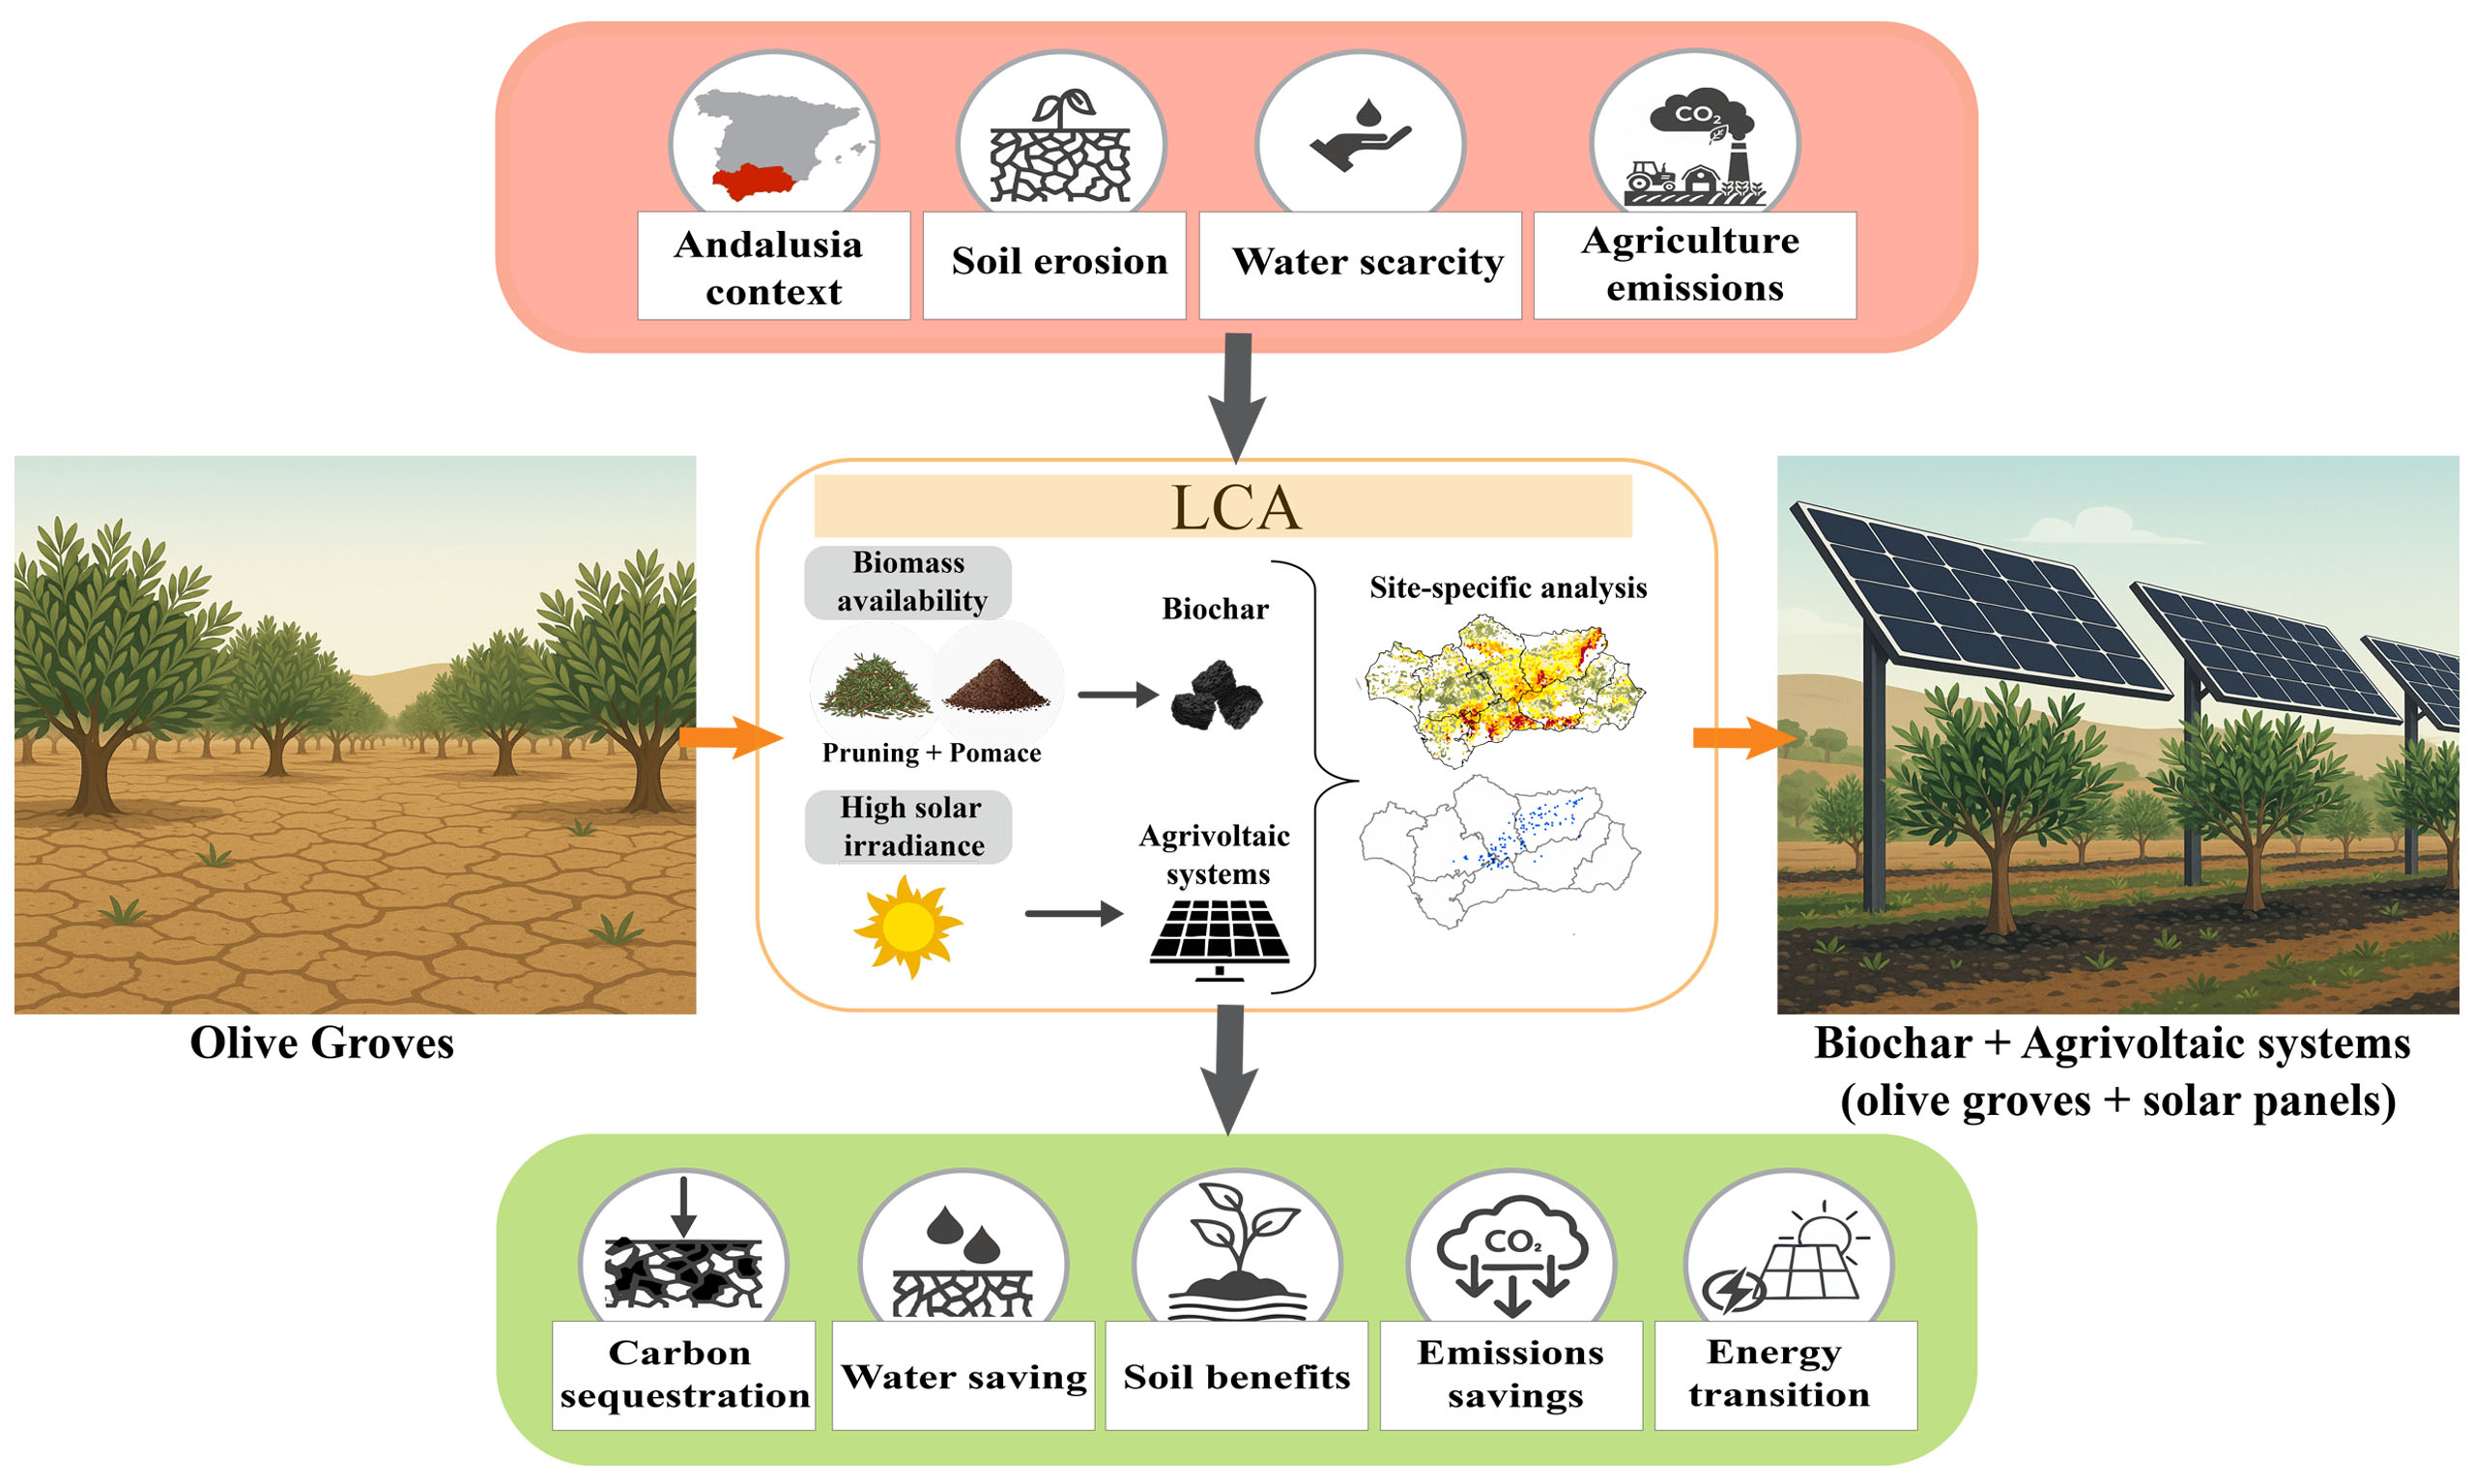
Agricultural activities in Spain are increasingly vulnerable to water scarcity and soil degradation, exacerbated by farming intensification and climate change. Alongside, the need for renewable energy generation expansion and negative emission technologies risk increasing land use conflicts. Sustainable strategies to reconcile measures to improve agricultural resilience with the renewable energy transition should be explored. This study evaluates the life-cycle environmental performance of integrating biochar production from residues from the local olive oil value chain with agrivoltaic systems in Andalusian olive groves. Five scenarios consider various constraints for regional biomass availability and for agrivoltaic deployment. A spatial analysis identifies the olive groves that are most suitable for agrivoltaic installation and prioritizes high-erosion groves for biochar application. Integrating these technologies delivers climate change mitigation, in some cases achieving net negative emissions and reducing global warming potential by up to 173% relative to conventional farming. Biochar-induced soil carbon storage transforms the agroecosystem from a net source of emissions (2.14 t CO2-eq ha-1) to a carbon sink (-7.90 t CO2-eq ha-1), while reducing soil erosion and improving water retention. Agrivoltaic systems further decrease irrigation demand and provide up to 53 TWh of renewable energy. Trade-offs occur with terrestrial ecotoxicity and freshwater eutrophication, but using more advanced and efficient panels can mitigate these burdens. Overall, the combined implementation of biochar and agrivoltaics can co-deliver across multiple environmental challenges, from local valorization of residue streams to enhanced agroecosystem resilience, climate change mitigation, adaptation, and renewable energy generation.
Keywords
INTRODUCTION
The Mediterranean agricultural sector faces increasing vulnerabilities due to climate-driven threats and farming intensification, exacerbating primarily water scarcity and soil erosion, threatening regional food security and international economies[1-4]. Water availability is usually a main constraint for agricultural output, a challenge intensified by severe soil degradation processes[5]. Conventional efforts to maximize crop yields through intensive irrigation and fertilization have created negative feedbacks, paradoxically accelerating soil degradation and deepening the water crisis[1,6,7]. Breaking this cycle and sustaining long-term agricultural productivity requires innovative solutions that deliver multiple co-benefits. Among these, negative emission technologies (NETs) like biochar from agro-industrial waste and the deployment of agrivoltaic systems (AVS) are promising strategies that can simultaneously counteract land degradation processes, contribute to climate change mitigation and adaptation, improve soil water and nutrient retention, reduce crop water stress, and generate renewable energy[1,8-11].
Spain, a leading European agricultural producer[12], is experiencing severe soil degradation in a relatively large share of its agricultural area[13]. The problem is particularly acute in the Andalusia region, where over 20% of agricultural land suffers from soil erosion rates exceeding 11 t ha-1 year-1, a threshold defined by the European Union as “severe”[5,14]. Andalusia dominates global olive oil production, accounting for approximately 37% of the world's supply, and in turn it is the largest producer of residues from olive process industries[15]. To meet rising global demand, the Andalusian olive industry has been shifting from traditional to intensive cultivation, characterized by high-density planting and mechanization[16]. This intensification increases the dependency on irrigation, adding a critical vulnerability in a water-scarce region, and accelerates soil erosion trends[6,7]. Projections of climate change impacts further increase risks of water scarcity and soil degradation processes, creating an urgent need for sustainable management solutions in olive grove systems[17,18].
As the olive oil industry expands and intensifies, it creates new opportunities for higher-value utilization of the organic residues generated at both the agricultural and industrial stages. The Andalusian olive industry generates over 7 million tonnes (Mt) of residual biomass annually, derived from both olive oil processing plants and field pruning[19]. About 80% of olive pruning biomass (OP) is crushed and chipped into the soil allowing for nutrient recycling, although the benefits for soil organic carbon are minimal as residues quickly oxidize and their biogenic carbon content is returned to the atmosphere within a couple of years[15,19]. Another primary residue stream is wet pomace (WP), a residue from the olive oil extraction process consisting of a mix of pulp, stone, and water. WP has a high organic load and requires further treatment, often in pomace oil mills where a second oil extraction is carried out, yielding exhausted olive pomace (EOP) as a by-product. The most common management practice of EOP is combustion for electricity production in biomass power plants[19].
Given the existing local challenges that olive farms are facing and the need to deploy more sustainable farming practices, these residues represent an opportunity to contrast land degradation and increase climate resilience. A key strategy for valorizing these residues is the production of biochar, one of the most promising NETs[20,21]. Biochar is produced from biomass via pyrolysis, a process of thermal decomposition in the absence of oxygen that also yields pyrolytic gas and bio-oil as co-products[22]. While these co-products can be utilized as energy source to make the pyrolysis plant self-sufficient, biochar application to agricultural soils offers the dual benefit of long-term carbon sequestration and agronomic improvements[11]. Some studies have already explored the benefits of applying biochar to olive groves as a strategy for improving soil fertility[17,23], and promoting a circular economy within the olive industry[15,24]. Similarly, extensive research in other agricultural systems confirms biochar’s role in enhancing soil structure, increasing organic matter content, and retaining water and nutrients[8,11,25-27]. This evidence makes a wide-scale implementation of biochar particularly attractive, as it offers a pathway to valorize local residue streams while simultaneously addressing land use challenges and contributing to climate change mitigation and adaptation.
Andalusia’s high solar irradiance (1,240-1,847 kWh m-2 year-1)[28] has driven a rapid expansion of ground-mounted photovoltaic (PV) parks, with regions like Sevilla leading Spanish PV installations
Despite the growing interest in biochar and agrivoltaics as strategies to enhance the long-term sustainability and resilience of olive production in Andalusia, there is a lack of comprehensive, life-cycle-based studies quantifying their integrated potential and environmental performances, as well as analyses that assess pathways for their practical combination. Current research largely treats biochar and AVS as standalone solutions, without considering their combined application within the region’s specific biophysical and resource constraints. Consequently, the potential synergies, trade-offs, and overall environmental performance of jointly deploying these technologies in Mediterranean olive groves remain unknown. This knowledge gap limits our understanding of how such integrated approaches could contribute to climate mitigation, sustainable resource management, and farm resilience, and hinders the development of evidence-based policies and incentives to support their large-scale adoption.
In this work, we address this knowledge gap by conducting a life-cycle assessment (LCA) of integrating biochar and agrivoltaics in the olive groves of Andalusia, Spain, following a regional-level approach. To define the scope and spatial extent of these interventions, we first quantified the regional availability of biomass residues within the olive oil industry, followed by a site-specific analysis to identify areas with high risk of soil erosion to prioritize biochar application, along with areas with high agricultural intensity as most suitable for AVS deployment. Five distinct scenarios are then developed to evaluate the environmental performance of different deployment scales at the regional level. The analysis estimates the potential renewable energy generation, affected land area, and a range of environmental impact indicators to assess potential co-benefits and trade-offs. Renewable energy is generated from both cogeneration of pyrolysis co-products combustion and the deployment of 2-axis tracking AVS technology. The environmental benefits from the generated electricity are quantified only for the additional surplus produced relative to the baseline, and they are assessed against a dynamic Spanish power mix that reflects progressive decarbonization. The robustness of the findings is evaluated through a Monte Carlo uncertainty analysis that quantifies the influence on the results of variability in key parameters.
METHODS
Feedstock availability
To promote solutions and industrial networks within the same sector, thereby limiting issues for resource competition with cross-sectoral interactions, this analysis focuses exclusively on the two most abundant biomass feedstocks identified within the olive oil agro-industry in Andalusia: EOP and OP residues. EOP is a by-product of the pomace oil extraction process, generating about 1.52 Mt annually[19]. Currently, 83% of this EOP is used for thermal and electric purposes, and the rest is self-consumed (9%) or sold (8%). Our analysis assumes the entire amount of EOP (dry basis) is available for biochar production, instead of being used for energy production. In our integrated approach, introduction of AVS can compensate for the potential loss of renewable electricity generation, thereby enabling the simultaneous exploration of carbon sequestration benefits from biochar together with new renewable energy generation from AVS.
OP residues represent a larger potential residue stream of about 2.62 Mt annually. However, the dominant current practice (> 80%) is to shred this biomass and leave it into the soil, a method that aims to provide nutrients to the olive groves[19]. Our scenario analysis explores cases with and without the use of OP for biochar production. When OP are used, a conservative collection rate of 30% (of the 80% fraction, i.e.,
Scenario definition
A reference system (baseline) and five alternative scenarios (S1-S5) are considered [Figure 1]. The baseline represents current system practices, where EOP is used in biomass power plants for energy generation and OP are largely left on the field. The first scenario (S1) introduces an alternative use for EOP, converting the EOP to biochar via a pyrolysis system. Scenario 2 (S2) combines S1 with a low deployment of AVS, i.e., on 50% of the identified suitable areas (see description below). Scenario 3 (S3) increases biochar production by adding pruning residues (EOP + 30% OP), and it is still combined with a low deployment of AVS. Scenario 4 (S4) considers the implementation of AVS as a standalone strategy as an addition to the baseline system, using a high deployment level (100% of suitable area) with no biochar production. Finally, Scenario 5 (S5) combines a large-scale implementation of both biochar (EOP + 30% OP) and AVS (high deployment).
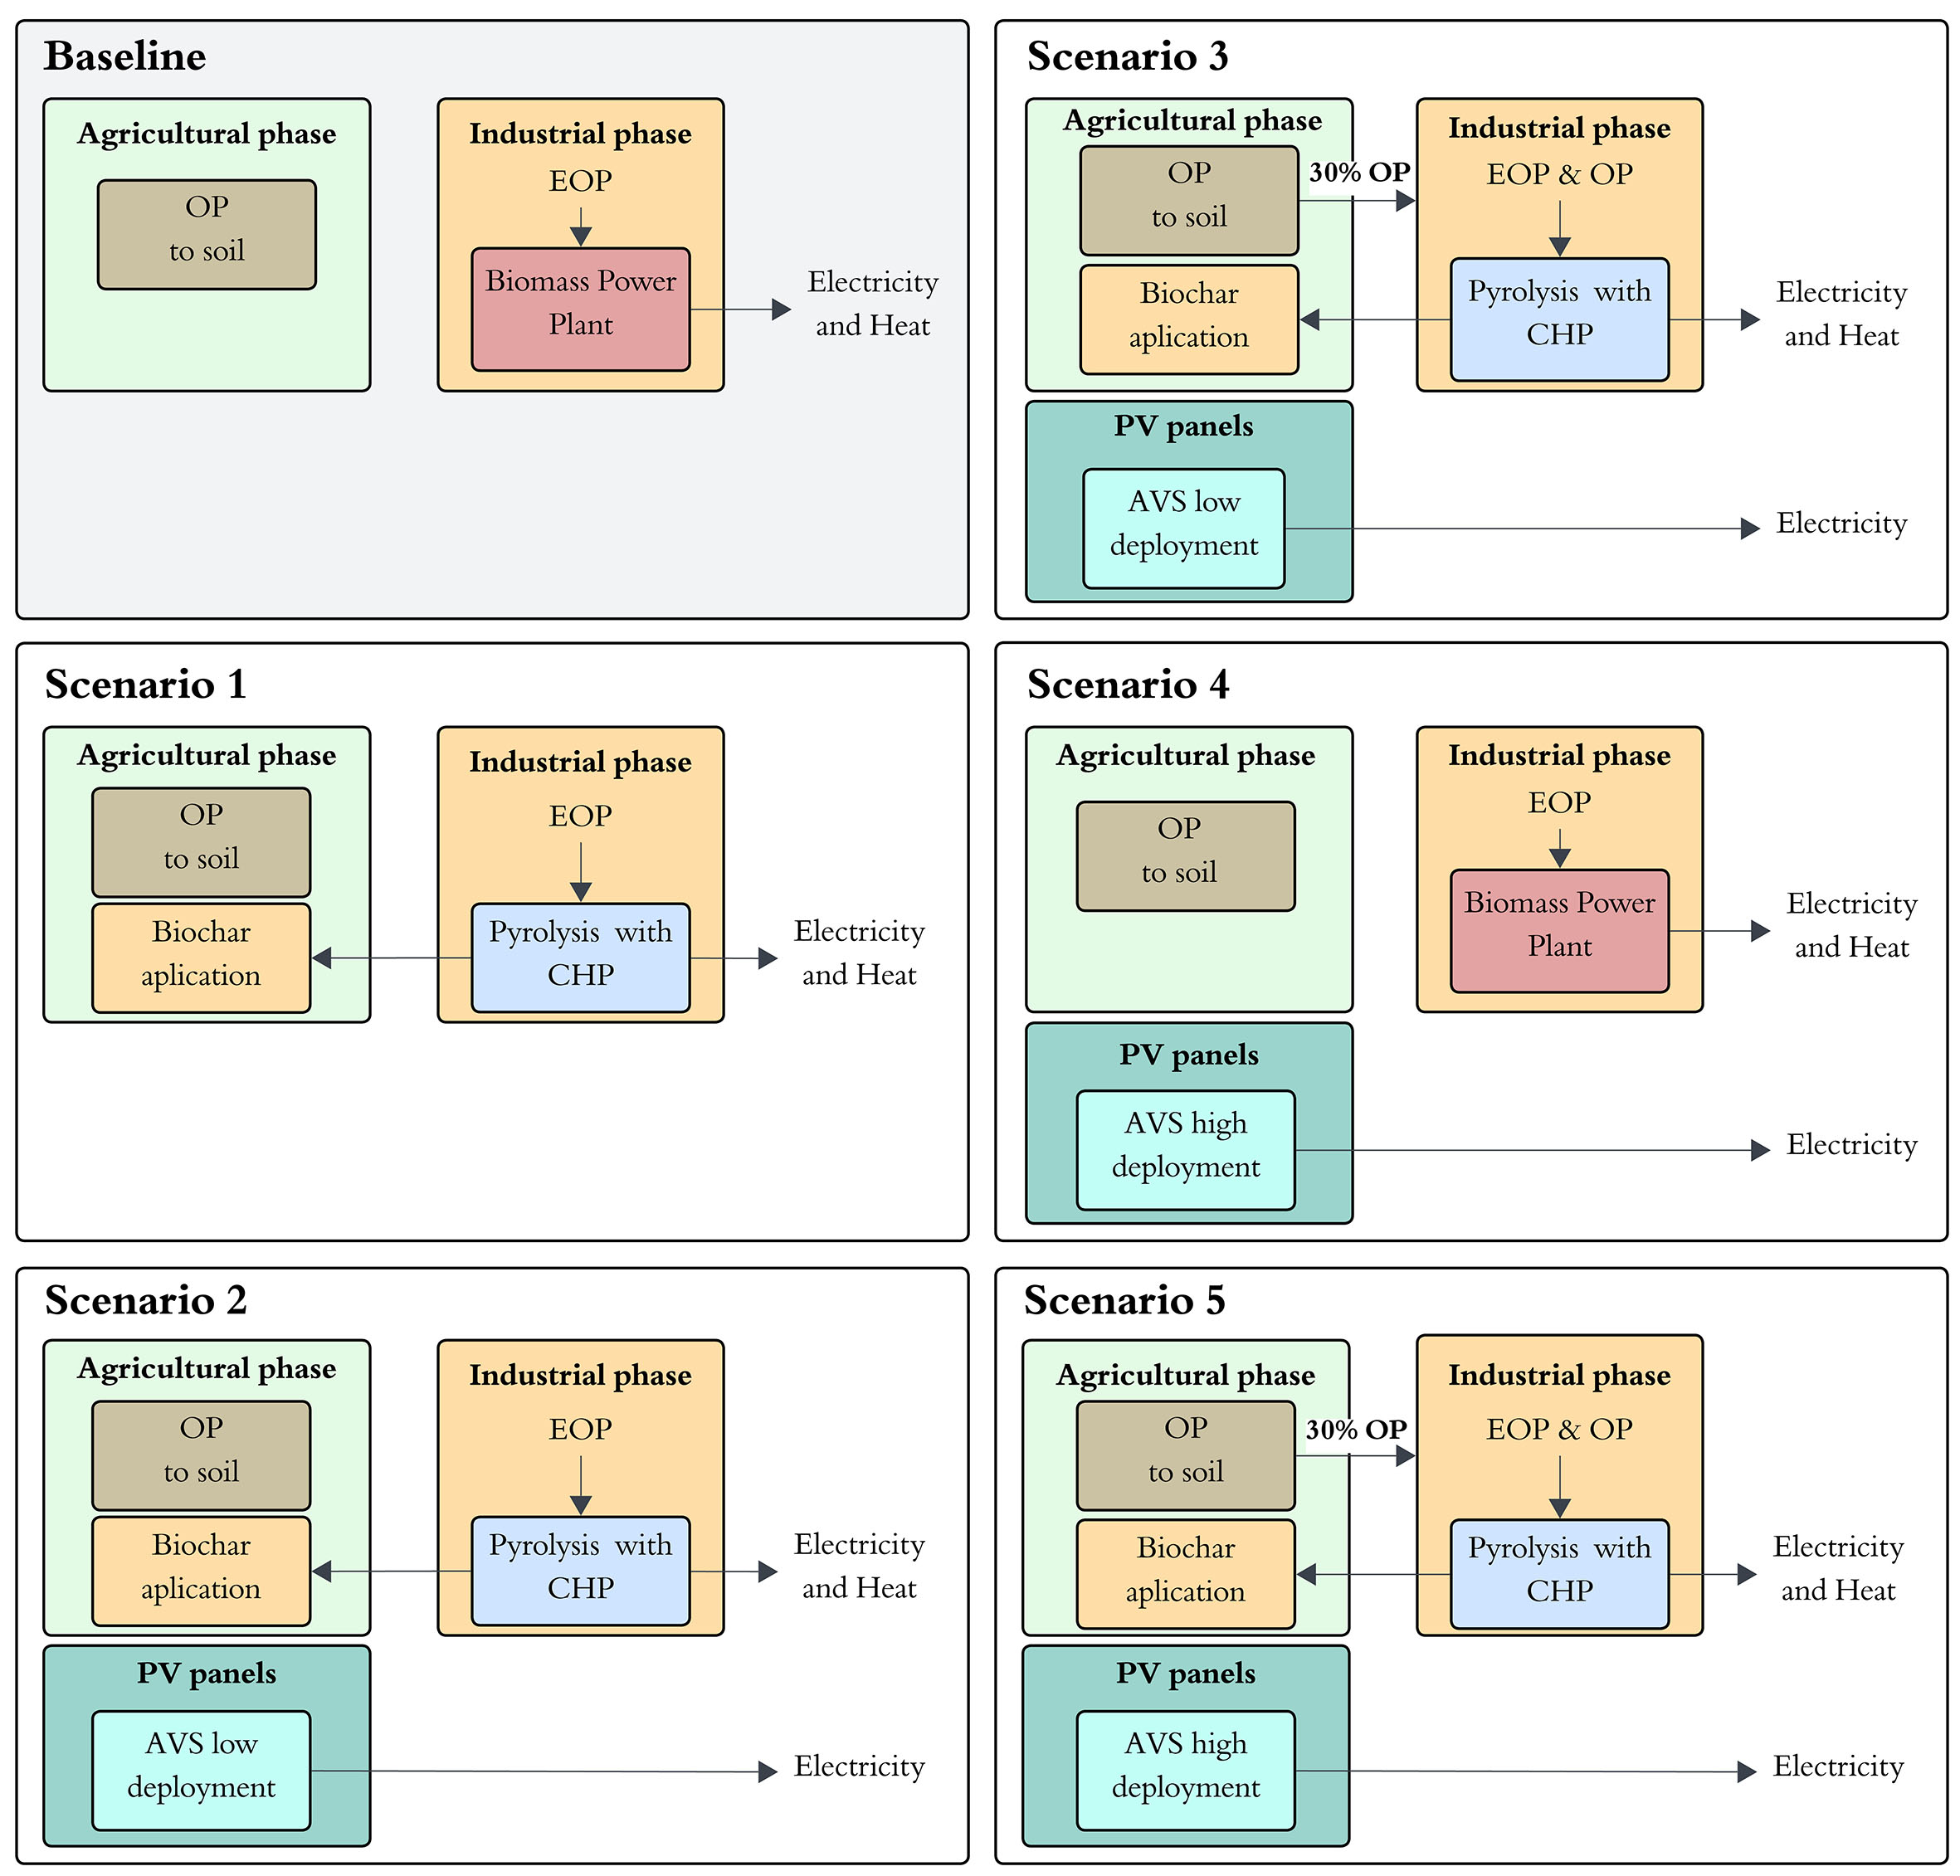
Figure 1. Visualization of the system boundaries for the baseline and five intervention scenarios (S1-S5). AVS: Agrivoltaic system; CHP: combined heat and power; EOP: exhausted olive pomace; OP: olive pruning.
Life cycle assessment (LCA)
The environmental performance of the proposed scenarios was evaluated using an LCA approach. The assessment system boundary covers agricultural operations, grouped into fertilizing, herbicide application, irrigation, and farming activities, where the latter encompasses pruning and harvesting processing, and soil management. It also includes biomass logistics and conversion, including EOP extraction and the pyrolysis plant, alongside the AVS infrastructure covering PV manufacturing and installation.
The analysis investigates several environmental impact categories. Climate change (GWP100) was assessed alongside terrestrial acidification (TAP), freshwater and marine eutrophication (FEP, MEP), particulate matter formation (PMFP), and terrestrial ecotoxicity (TETP) using the ReCiPe 2016 v1.03, midpoint (H) method[40]. Human toxicity was assessed using USEtox v2.13[41]. Given the variety of products and the complexity of the scenarios, the results are shown by year, representing the regional management of the
The background system is modelled with ecoinvent v3.11 database[42], accounting for direct and indirect emissions from upstream processes including energy generation, manufacturing and transportation. The LCI of foreground systems was compiled by integrating data from literature and local farming and industry sources. The agricultural operations for the current reference system are based on[19,43,44], with modifications of individual processes and stressors to represent the effects of each alternative scenario. Upstream impacts for the EOP feedstock include the olive oil and pomace oil extraction processes from reviewed literature[44-46]. Environmental burdens from these multi-output processes were distributed using economic allocation, reflecting the relative market value of the oils and the resulting EOP [Supplementary Table 5]. Upstream impacts for the OP feedstock include collection and transport to the pyrolysis plant. The transport of pruning residues to the pyrolysis plant and biochar to the fields were modeled using a range of minimum and maximum distances reported for the oil industry as well as spatial distances between pyrolysis plants and the olive grove fields [Supplementary Text 1, Supplementary Figure 1 and Supplementary Table 6].
The pyrolysis process is modeled using primary data from a local biochar producer[47]. The system is energetically self-sufficient by combusting the pyrolysis co-products in an on-site Combined Heat and Power (CHP) unit; the generated energy covers plant operations, and the excess power is exported to the market. To ensure a fair comparison with the baseline scenario (where biomass is combusted for energy), environmental credits are only claimed for the net surplus electricity generated beyond the baseline output, where power plants are reported to produce 0.77 kWh per kg of EOP processed[45]. This surplus electricity is credited by displacing the 2024 Spanish grid mix [Supplementary Figure 2], which had a 56% renewable share and an average emission factor of 0.10 kg CO2-eq kWh-1[48,49]. To reflect the future decarbonization of the grid, we performed a sensitivity analysis on the substitution credit for surplus electricity. The impact of using the energy mix forecast for Spain in 2030 (81% renewable energy; 0.029 kg CO2-eq kWh-1[49]) was compared with the results based on the Spanish grid in 2024.
For the AVS technology, LCI data includes all material inputs and the water requirements for panel cleaning[33]. The irrigation activity from the agricultural stage is modified in AVS-equipped scenarios to reflect associated water savings. As with the CHP, electricity produced from AVS is credited as a replacement for the Spanish electricity mix.
Because the credit for displaced electricity is a methodological assumption that does not account for potential changes in electricity demand, market dynamics, or national policies (such as increased export targets), these credits are reported separately in the results. This allows the findings to be interpreted either with or without their contribution.
Biochar production
The pyrolysis system is modeled based on the region feedstock availability [Supplementary Table 7]. We model a biomass throughput of 80 t hr-1 and 7,000 operating hours per year[11,50], which corresponds to 4 plants with a capacity of 510 kt year-1 of dry biomass.
The pyrolysis process requires a biomass moisture content lower than 10%[51]. While EOP already meets this moisture requirement[19], the OP has a higher water content, meaning that the EOP-OP feedstock mix needs to be pre-dried from 26% to 10%[39]. Then, the biomass undergoes slow pyrolysis at 500 °C, modelled using primary data from a local biochar production facility, with a biochar yield of 28%[47]. The remaining co-products, bio-oil and pyrolytic gases, are combusted in an on-site CHP unit to produce electricity and heat at 28.5% and 65% efficiencies, respectively[52]. The heat is used to satisfy the energy demands of the drying process and the pyrolysis unit[47], while the surplus electricity is exported to the Spanish national grid, with displacement credits applied solely to the net generation exceeding the baseline. Emissions to air from the CHP combustion are from operational data, validated with literature[47,52,53]. The resulting flue gas is considered to go through a scrubber with efficiency 90% in order to remove SO2 and NOX, pollutants that surpass the limit set for the national regulation[54]. The complete life cycle inventory of the pyrolysis system is presented in Supplementary Table 2.
The plant locations were modeled to minimize transport distances from feedstock collection points to the pyrolysis unit, and from the unit to the biochar application fields. The methodology for estimating these distances is provided in Supplementary Text 1, with its visualization in Supplementary Figure 1 and the specific distances shown in Supplementary Table 6.
Agrivoltaic systems deployment
The agrivoltaic system is designed for integration into existing olive groves in Andalusia. The feasibility and performance of such a system are highly dependent on its design, with key parameters like panel height, row spacing, and orientation being critical for balancing energy generation with the preservation of agricultural productivity[30-32,55-57]. The literature consistently highlights that intensive olive groves on low-slope terrain are particularly suitable for AVS implementation, as their structured layout provides sufficient inter-row clearance for photovoltaic structures without impeding mechanized harvesting[31,32,58].
Building on this, a suitability analysis was performed using gridded datasets as described in
For estimating the electricity generation potential for AVS, the suitable areas were intersected with a solar resource map from Solargis [Supplementary Figure 5] to determine the specific photovoltaic electricity production potential (kWh kWp-1) for each location[28]. To translate this potential into a total generation capacity (MW), an installed power density (MW ha-1) was established. European AVS reports identify a range from 0.2 to 0.9 MW ha-1[59,60]. To prioritize the agricultural use of the land, a conservative baseline value of 0.4 MW ha-1 (with a range of ±0.2 MW ha-1 considered in the Monte Carlo uncertainty analysis) was adopted to represent differences in PV intensity. This aligns with literature on AVS in olive groves, where installed potentials range from 0.29 to 0.43 MW ha-1, as olive trees exhibit moderate sensitivity to shading[30,31,60,61]. Based on a literature review of different AVS designs [Supplementary Table 8], the technology selected for this study is a 2-axis tracking system [Figure 2], as its dynamic movement on both N-S and E-W axes maximizes solar radiation capture while ensuring the minimum interference with the olive trees[33,55]. The specifications of the system are available on Supplementary Table 9.
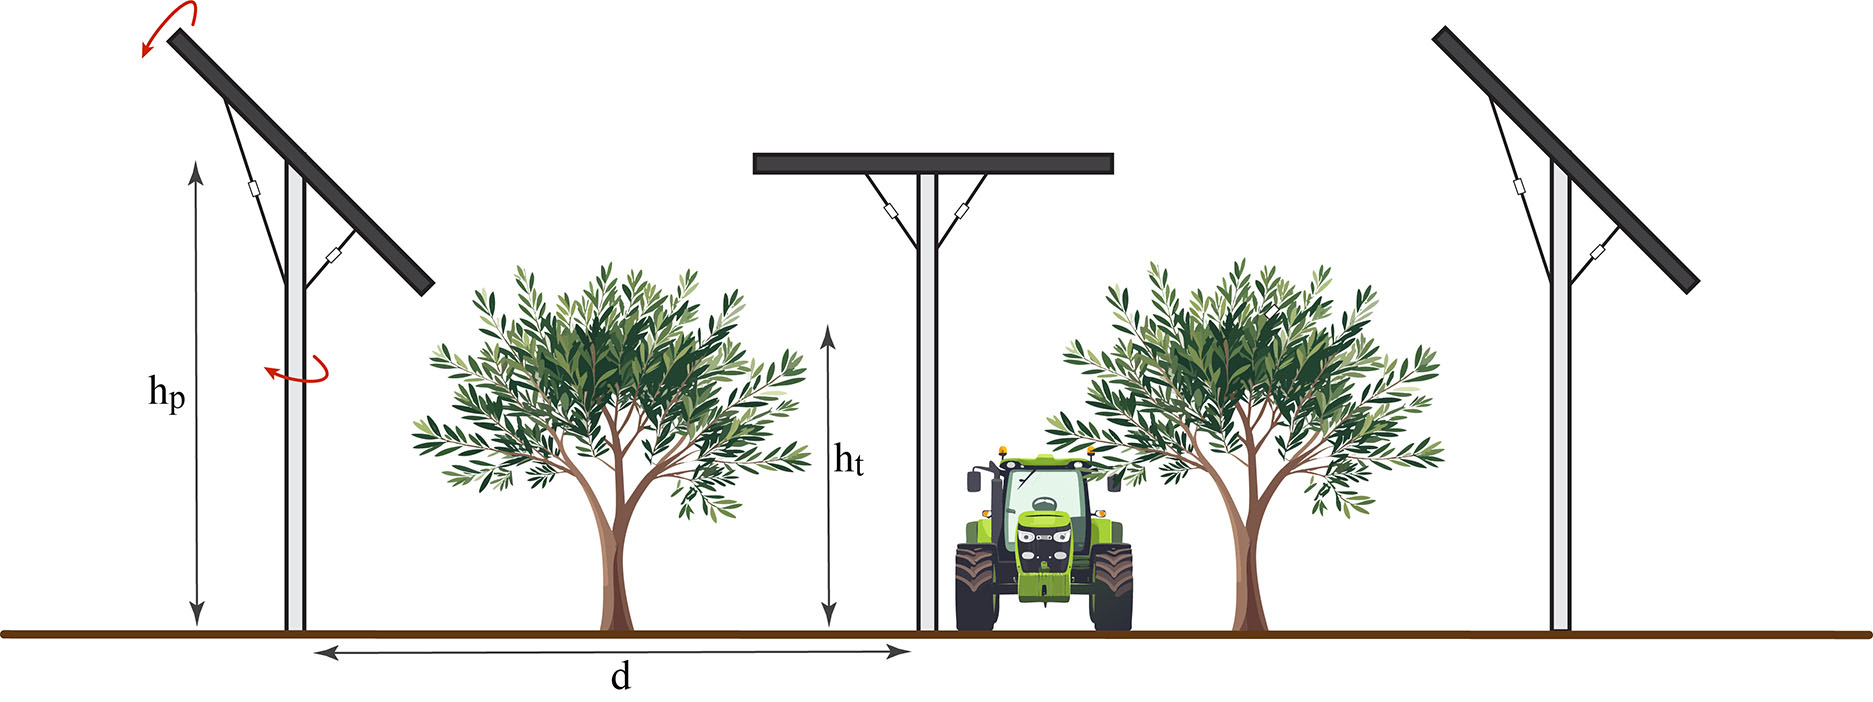
Figure 2. Representation of a 2-axis tracking agrivoltaic system integrated into an olive grove. The system configuration is defined by the distance between panel rows (d), the olive tree height (ht), and the panel installation height (hp). The tracking mechanism allows panel movement on both North-South and East-West axes to optimize solar capture while minimizing shading on the crop.
This suitability analysis established the total hectares available for AVS. From this, we defined two levels of implementation: a low deployment level, representing an application to 50% of the suitable area identified, and a high deployment level, representing an application of 100%.
Soil benefits
This study considers a biochar application rate of 5 t·ha-1 in all scenarios, a dosage that ensures agronomic benefits while remaining economically and logistically feasible by contributing to yield enhancement, soil fertility, and carbon sequestration[11,23,25,62]. Biochar application is prioritized to deliver soil restoration benefits to those soils affected by a high erosion rate, considered as the key indicator of degradation of olive groves. Soil erosion is a primary driver of land degradation, leading to losses in soil structure, organic carbon, and water retention capacity[5,13,63]. Biochar application directly counteracts these degradation processes by enhancing soil carbon storage, improving soil structure[11,17,23], and reducing soil loss and nutrient runoff[62,64], thus alleviating common deficiencies in eroded soils[65].
Based on a global meta-analysis and the local climatic conditions, we adopt an average reduction of 9% in soil erosion when biochar is applied[66]. Given the biochar's established effect on increasing soil water holding capacity (with values reported in the 10%-30% range), we considered an estimate of 10% reduction in irrigation requirements[17,25,62,67]. Yield improvements of about 15% have been reported after biochar application to olive groves with field trials in Andalusia[17,68], which is the value used in this study. A 15% reduction in nitrogen fertilizer, and 7% reduction in phosphorus and potassium fertilizers, is considered according to the reported increases in nutrient use efficiency driven by biochar[23,26,45,67,69]. Direct soil N2O emissions for the baseline scenario were quantified using the IPCC default emission factor of 1% of N applied[70]. Indirect emissions were derived from estimated N losses, including 5% for ammonia volatilization[71] and 71% for nitrate leaching in the irrigated intensive system[72], with subsequent conversion to N2O using factors of 1% and 0.75%[11], respectively. Biochar's influence was quantified based on a European-scale analysis[11], with direct N2O emissions reduced by 13.7% and nitrate leaching losses reduced by 17.5%.
Finally, net carbon removal was calculated using the Verified Carbon Standard (VCS) methodology. Our olive pomace-based biochar had an average carbon content of 66.22% [Supplementary Table 10]. According to VCS guidelines, biochar produced between 450-600 °C has a permanence factor of 80%[73,74]. This yields a net carbon sequestration of 1.94 t CO2 eq per tonne of biochar applied to the soil, resulting in a carbon sink of 9.71 t CO2-eq ha-1 for the 5 t ha-1 application rate, a value consistent with previous findings[11]. Supplementary Table 11 summarizes biochar benefits stated in this section and
In addition to renewable energy, AVS provides co-benefits by creating a more favorable microclimate. The partial shade from solar panels reduces soil temperature and evaporation, which lowers crop evapotranspiration and improves water use efficiency, with literature reporting water savings ranging from 10%-30%[9,34-36]. Based on these findings and to account for regional variability, a 20% reduction in irrigation water requirements for all land where AVS is deployed is considered. We also assume no yield penalty for the olive groves, as the AVS is configured with a 2-axis tracking system to optimize light distribution, consistent with best-practice designs[30,32,59].
Uncertainty analysis
To test the robustness of the LCA results, a Monte Carlo simulation with 10,000 runs was performed. For each run, the simulation randomly selected a value from the defined uncertainty range for each key parameter. We used a triangular distribution, following the approach of other studies in similar cases, where the data sample sizes were insufficient to shape other type of distributions[11,53,75]. The most likely value (mode) was defined as the mean value reported in the literature, while the minimum and maximum bounds were set to reflect the full observed range of variability.
The analysis accounted for uncertainty across numerous parameters, which are detailed in
RESULTS AND DISCUSSION
Scenarios potentials
The scenarios are defined by two distinct levels of feedstock availability, which directly impact the annual production of biochar and the rate at which olive agricultural land can be treated [Table 1]. Scenarios S1 and S2, which utilize only EOP, produce approximately 427 kt of biochar annually, allowing for the treatment of 85,368 ha per year at a 5 t·ha-1 application rate. S3 and S5, which in addition use 30% of available olive pruning residues, produce 572 kt of biochar annually.
Biochar production and application potential in Andalusian olive groves for the five modeled scenarios. Values indicate annual feedstock availability and biochar output in kilotonnes (kt), as well as the treated land area (ha year-1) and its proportion of the total regional olive surface (%). The scenarios are defined by biochar feedstock and AVS deployment levels: S1 (EOP, no AVS), S2 (EOP, 50% AVS), S3 (EOP-OP, 50% AVS), S4 (AVS-only, 100% AVS), and S5 (EOP-OP, 100% AVS)
| Baseline | S1 | S2 | S3 | S4 | S5 | |
| Biochar | ||||||
| Pyrolysis feedstock (kt) | ||||||
| Exhausted olive pomace (EOP) | 1,524 | 1,524 | 1,524 | 1,524 | - | 1,524 |
| Pruning (OP) | 0 | 0 | 0 | 517 | - | 517 |
| Total | 1,524 | 1,524 | 1,524 | 2,042 | - | 2,042 |
| Biochar production (kt) | - | 427 | 427 | 572 | - | 572 |
| Area treated with biochar (ha year-1) | - | 85,368 | 85,368 | 114,346 | - | 114,346 |
| % of total olive hectares | - | 6 % | 6 % | 7 % | - | 7 % |
Figure 3A highlights the severity of erosion in Andalusian olive groves, showing that more than 80% of the area faces critical risk (> 11 t ha-1 year-1), confirming the urgent need for targeted interventions. The biochar produced allows for the annual treatment of 85,368 ha in scenarios S1 and S2, rising to 114,346 ha in S3 and S5, representing 6% and 7% of the total regional olive area, respectively [Table 1]. As shown in Figure 3B, which tracks the cumulative treated area sorted by erosion rates, treating the entire region would take 18 years under S1 and S2, whereas the increased feedstock availability in S3 and S5 shortens this process to 14 years. By prioritizing the most eroded soils first, we observed that areas exceeding the 25 t ha-1 year-1 threshold are fully treated within 10 years for S1 and S2, and 8 years for S3 and S5. For a province like Jaén, which holds the largest olive surface area and the highest extent of groves within erosion categories exceeding 25 t ha-1 year-1 [Supplementary Table 13], under scenarios S3 and S5, all hectares exceeding this threshold can be treated in 4 years.
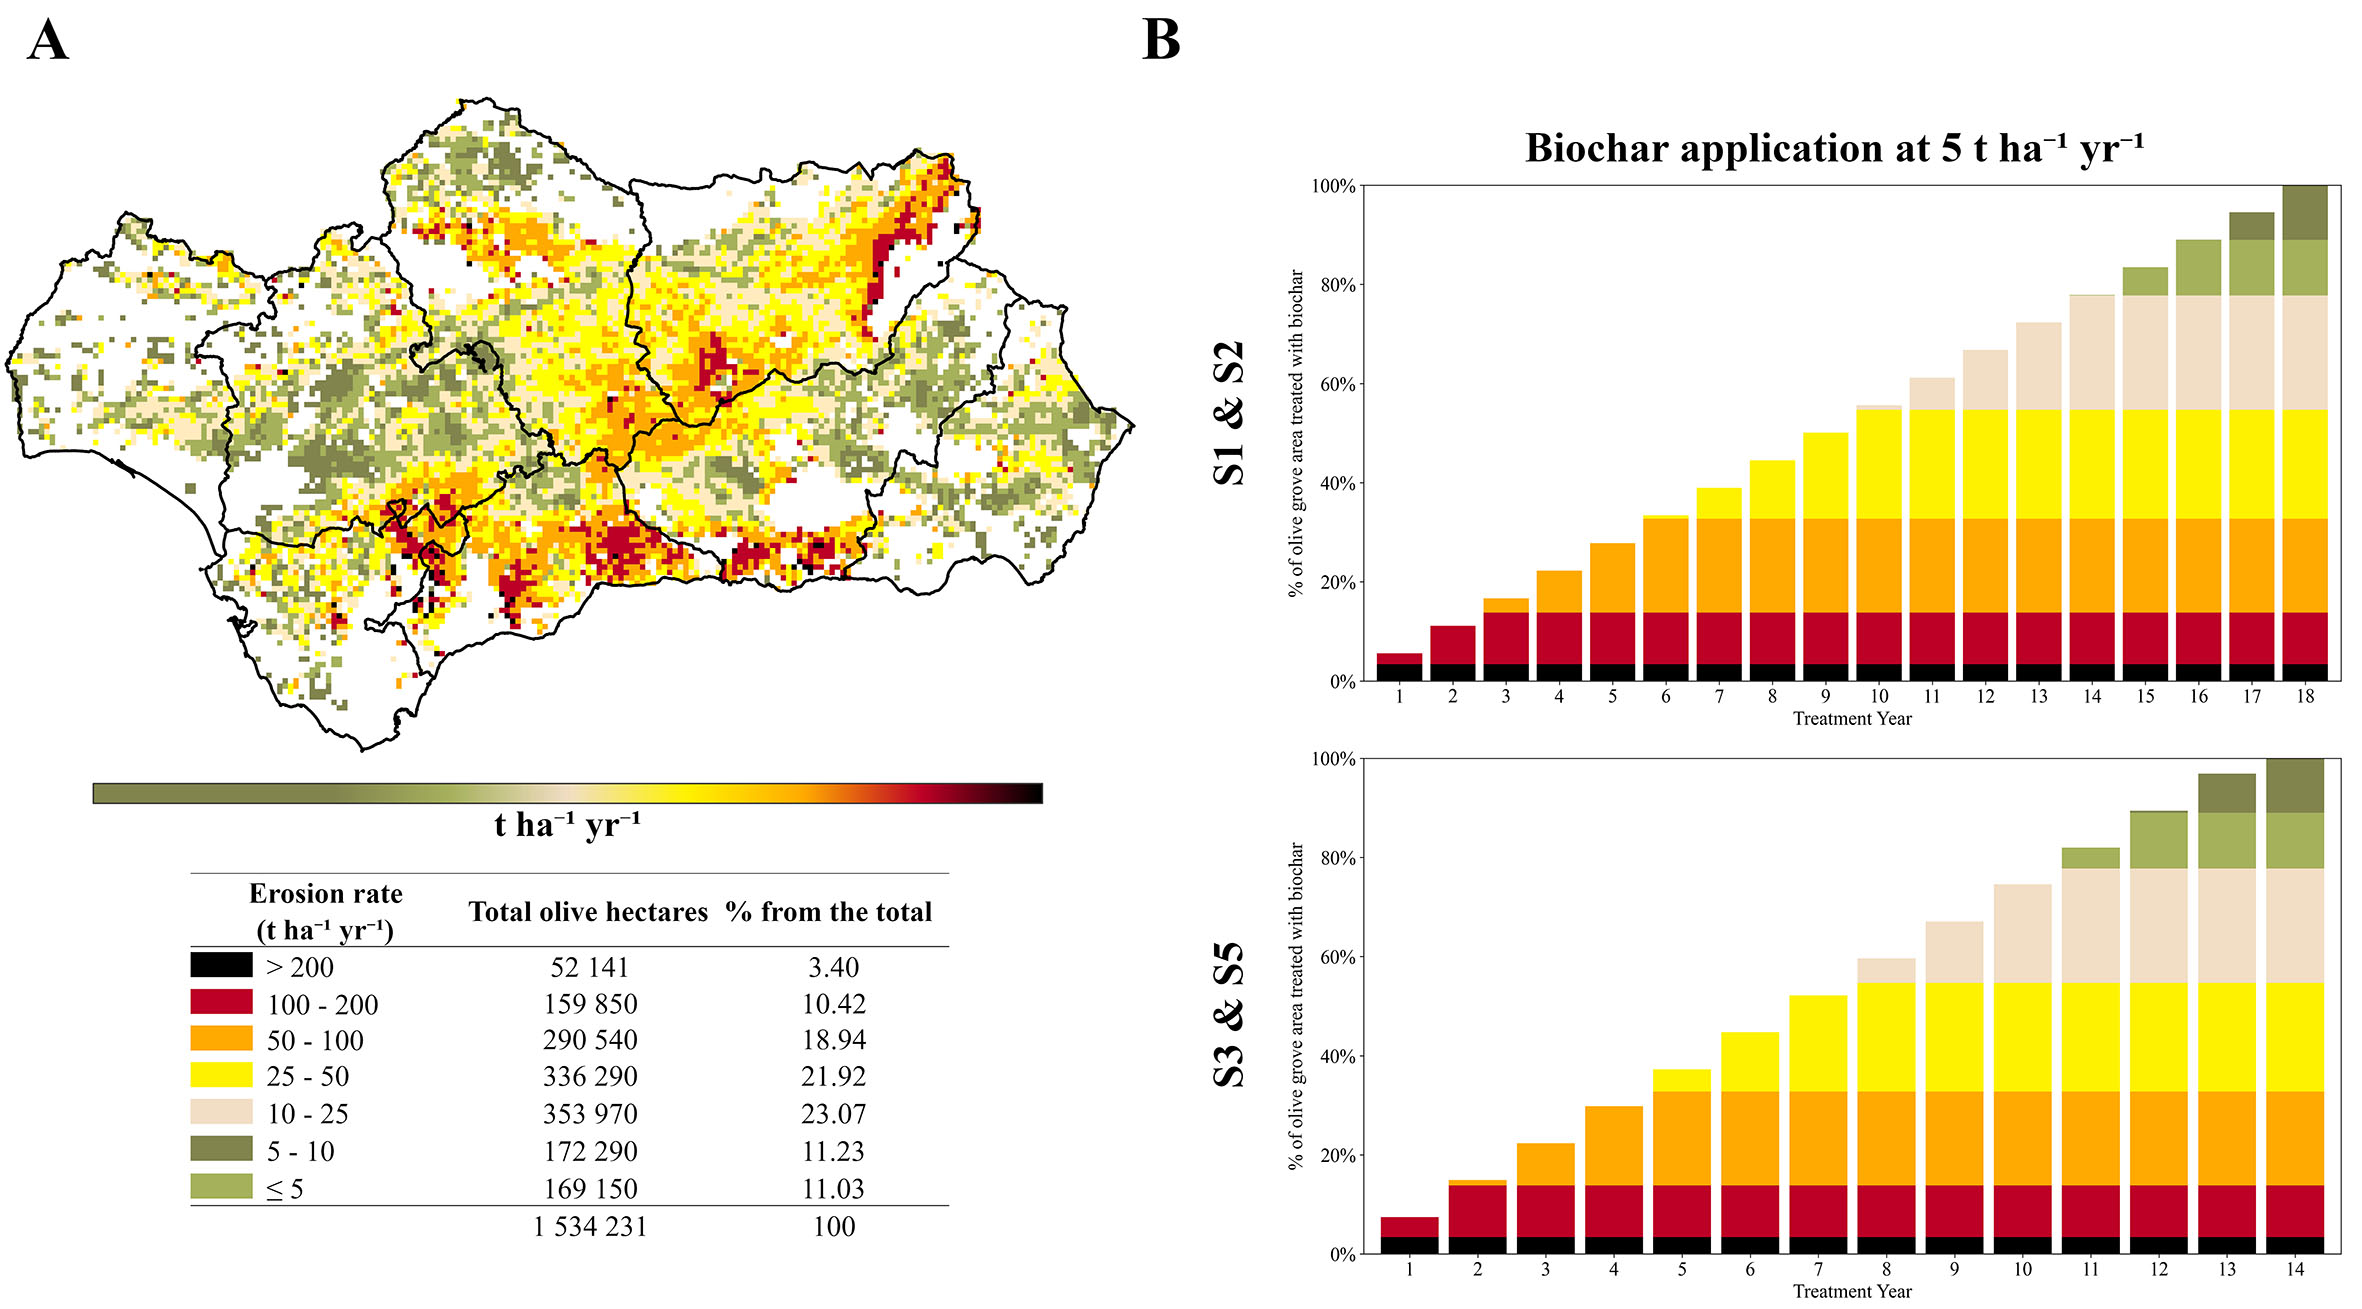
Figure 3. Spatial distribution of soil erosion rates in olive groves in Andalusia and area treated with biochar. (A) shows the spatial distribution of soil erosion rates across Andalusian olive groves, mapped using ArcGIS Pro based on data from[13]. The table indicating the total area for each erosion category in tonne of soil loss per hectare per year (t ha-1 year-1). (B) illustrates the cumulative percentage of olive grove area treated over time for scenarios S1 and S2 on the top (only exhausted olive pomace as feedstock), and scenarios S3 and S5 on the bottom (exhausted olive pomace and olive pruning as feedstock), assuming an application rate of 5 t·ha-1.
In parallel, Table 2 details the AVS deployment and the total power production potential for each scenario. Scenarios S2 and S3 target 38,093 ha, while S4 and S5 utilize the full 76,186 ha identified as suitable within olive groves, representing 2% and 5% of the total olive grove area in Andalusia for S2-S3 and S4-S5, respectively. This installed capacity translates to an annual production of approximately 25,849 GWh for S2 and S3, rising to 51,698 GWh·year-1 for S4 and S5. When considering the total power production, S2 and S3, which add electricity from combusting pyrolysis co-products in the CHP unit, reach a total generation of approximately 27,000 GWh·year-1. S5 (AVS + pyrolysis co-products) achieves 52,899 GWh·year-1, a total comparable to Scenario S4 (AVS + biomass power plants) at 52,831 GWh·year-1. Conversely, in S1, where generation relies solely on pyrolysis co-products (896 GWh·year-1), the total output drops by 21% relative to the baseline (1,133 GWh·year-1). This comparison highlights that although solar power has an intermittent nature, with a capacity factor lower than continuous-generation technologies like biomass power plants[76], it has a large energy potential. Realizing this potential, however, would require additional adaptations to the electricity grid to accommodate and absorb higher shares of renewable energy.
Agrivoltaic System (AVS) deployment and regional electricity generation potential in Andalusian olive groves for the five modeled scenarios. Values indicate the projected AVS area (ha) and its proportion of the total olive cultivation surface (%). Electricity generation estimates (GWh year-1) include solar photovoltaic output alongside energy derived from pyrolysis co-products or olive biomass combustion, depending on the scenario. Scenarios are defined by biochar feedstock and AVS deployment levels: S1 (EOP, no AVS), S2 (EOP, 50% AVS), S3 (EOP-OP, 50% AVS), S4 (AVS-only, 100% AVS), and S5 (EOP-OP, 100% AVS)
| Baseline | S1 | S2 | S3 | S4 | S5 | |
| Agrivoltaic systems (AVS) | ||||||
| Area with AVS (ha) | - | - | 38,093 | 38,093 | 76,186 | 76,186 |
| % of total olive hectares | - | - | 2 % | 2 % | 5 % | 5 % |
| Electricity generation (GWh year-1) | ||||||
| Electricity from pyrolysis co-products | - | 896 | 896 | 1,201 | - | 1,201 |
| Solar power from AVS | - | 0 | 25,849 | 25,849 | 51,698 | 51,698 |
| Biomass power plants | 1,133 | - | - | - | 1 133 | - |
| Total energy production | 1,133 | 896 | 26,745 | 27,050 | 52,831 | 52,899 |
Figure 4A illustrates the spatial distribution of the suitable areas identified for AVS. Jaén accounts for nearly 50% of this total area (37,156 ha), with an average annual photovoltaic energy yield of 1,690 kWh kWp-1. However, in terms of specific energy yield within these identified grids, Málaga exhibits the greatest potential, reaching an average of 1,711 kWh kWp-1. Notably, Supplementary Figure 5 reveals that the absolute maximum solar potential in the region's olive groves (reaching 1,823 kWh kWp-1 in eastern provinces such as Almería and Granada) largely falls outside the currently identified suitable grids, where slope and cultivation intensity are prioritized to ensure optimal compatibility between the olive trees and the PV infrastructure. Consequently, site-specific analysis can unlock the potential of higher radiation zones that were not initially identified as suitable by adapting AVS technology to local conditions.
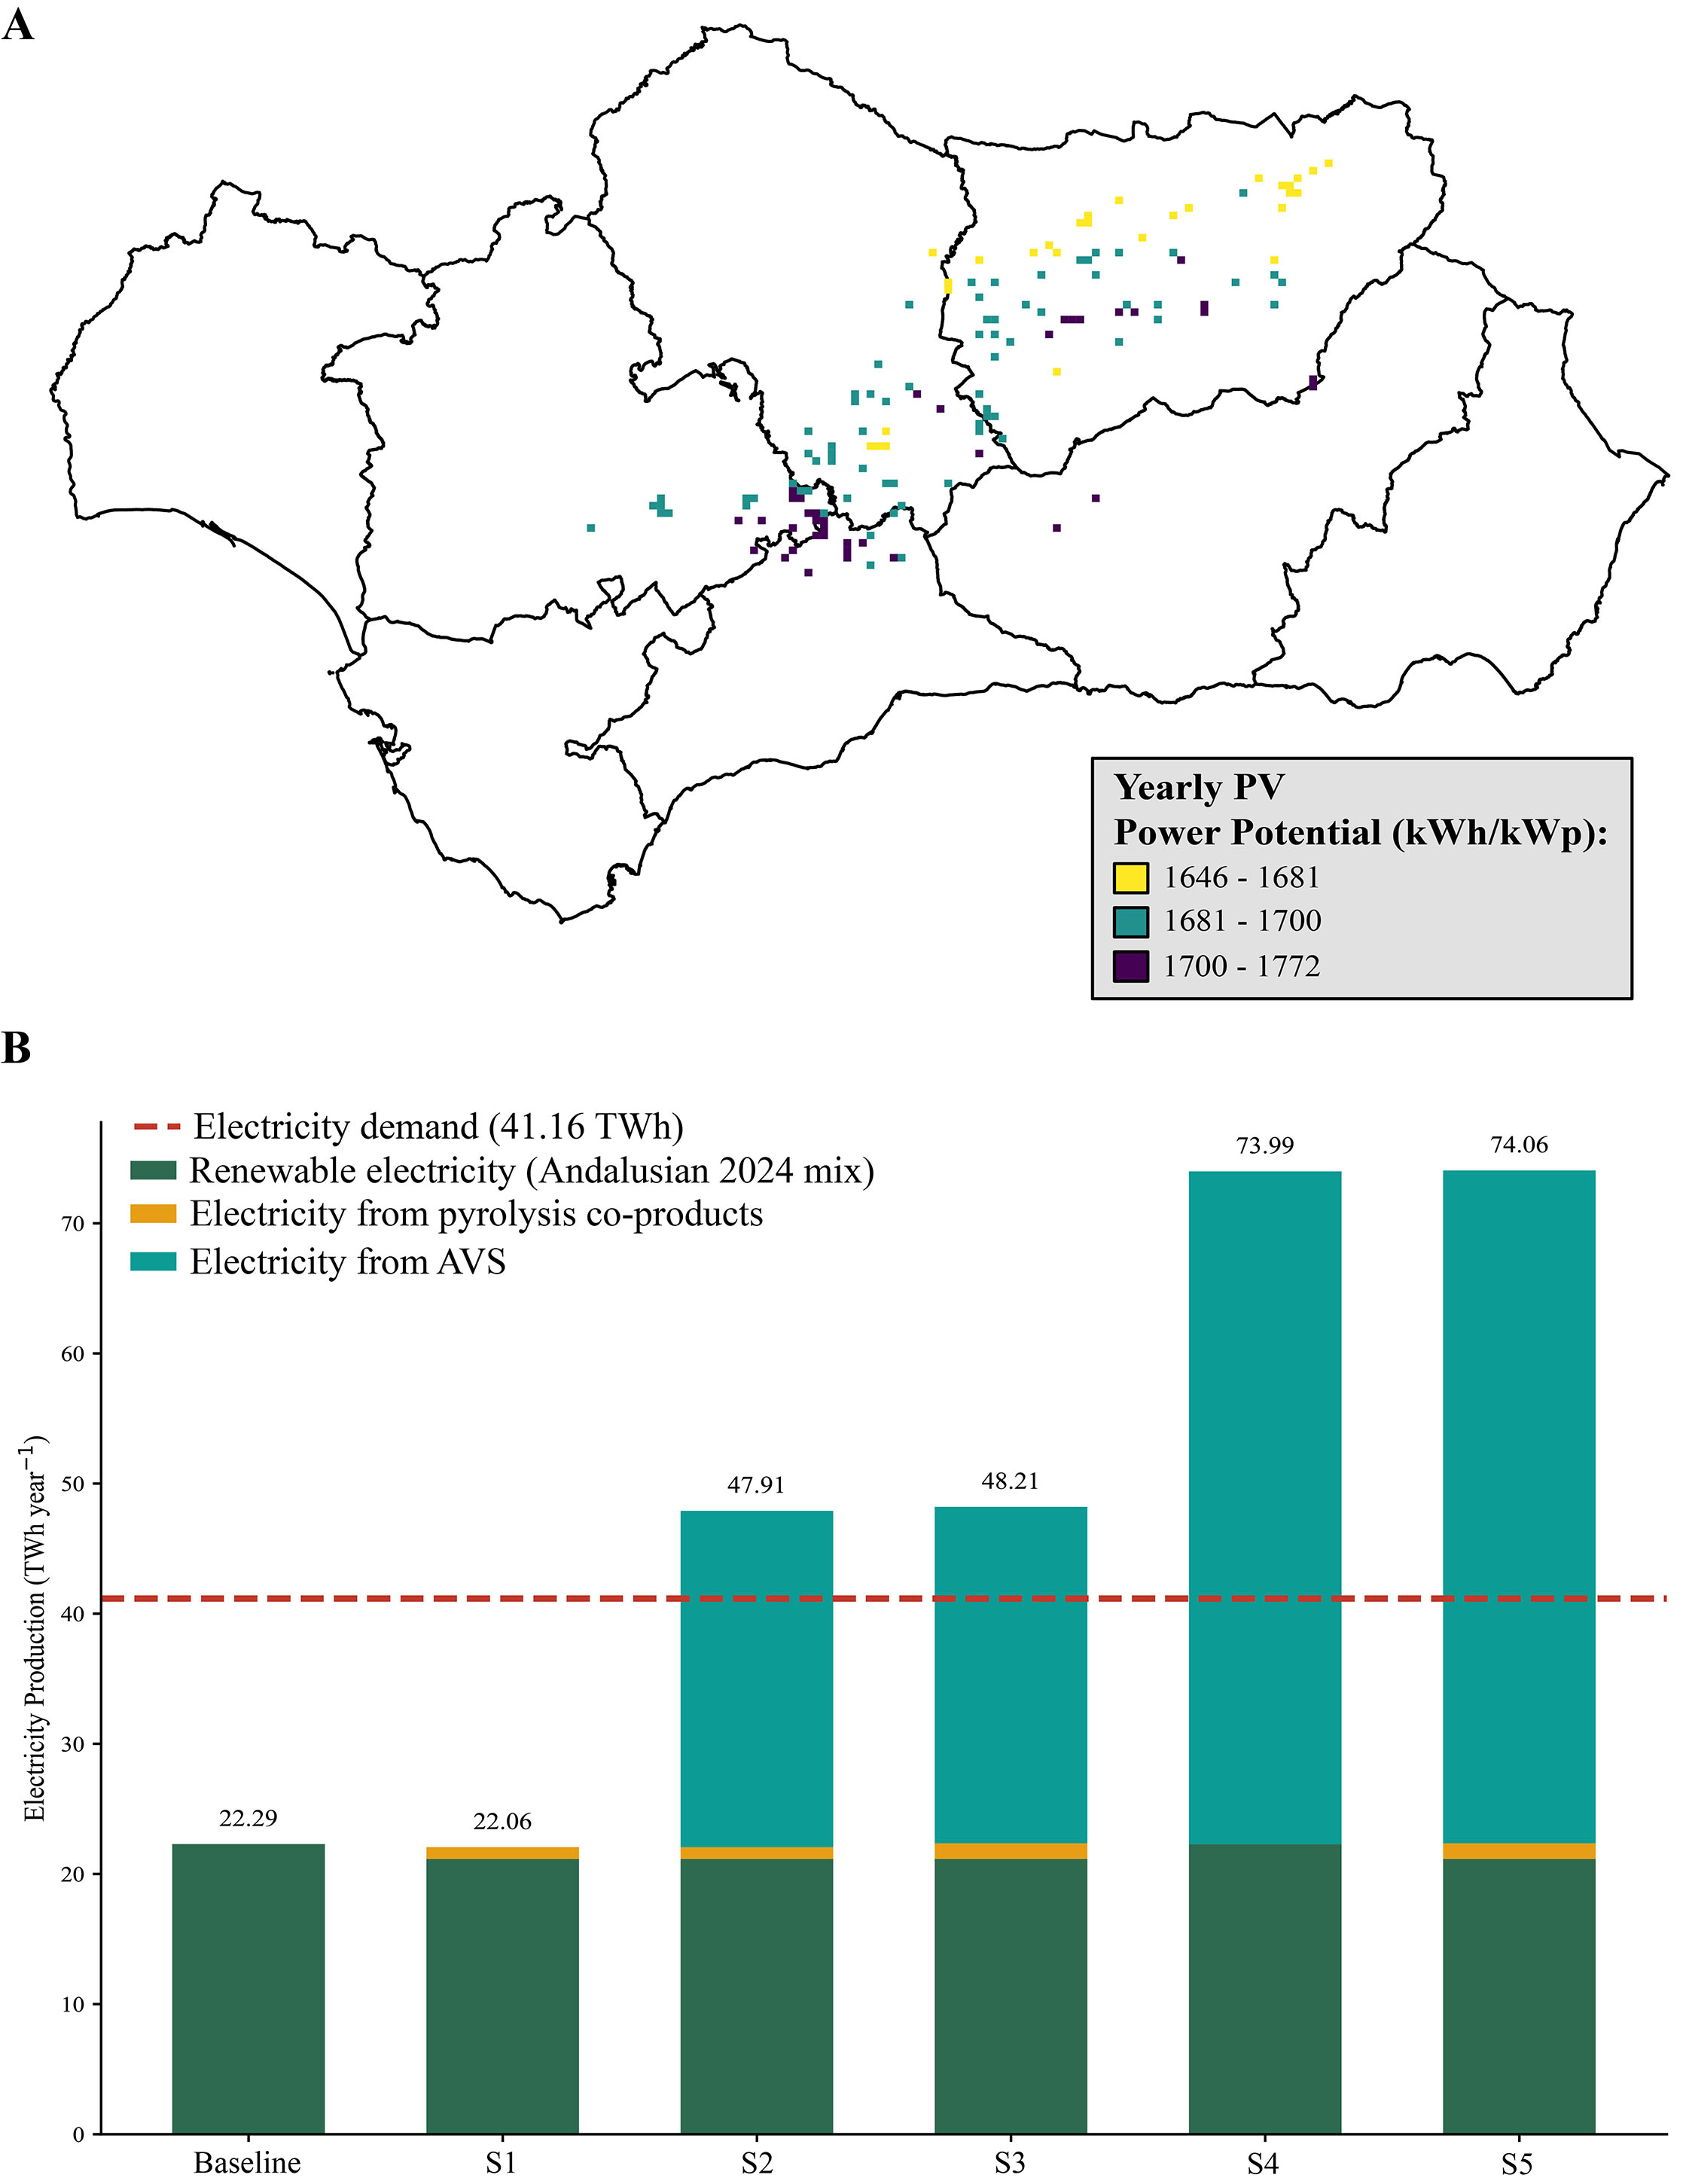
Figure 4. Optimal spatial distribution of AVS and potential electricity generation. (A) shows the spatial distribution of yearly photovoltaic (PV) power potential (kWh kWp-1) within areas suitable for agrivoltaic systems (AVS), mapped using ArcGIS Pro based on data from[28]. (B) illustrates the annual electricity production potential (TWh year-1) compared to the 2024 Andalusian renewable mix. The red dashed line indicates the regional electricity demand (41.1 TWh). Scenarios are defined by biochar feedstock and AVS deployment levels: S1 (EOP, no AVS), S2 (EOP, 50% AVS), S3 (EOP-OP, 50% AVS), S4 (AVS-only, 100% AVS), and S5 (EOP-OP, 100% AVS).
The transformative impact of AVS becomes evident when contextualizing it within the 2024 regional energy profile. Figure 4B compares the renewable electricity generation with the regional demand, represented by the red line at 41.16 TWh year-1. The baseline represents current renewable energy production in Andalusia (22.29 TWh year-1), primarily derived from photovoltaics (51%) and wind (30%) [Supplementary Table 15]. The integration of AVS in our investigated scenarios significantly boosts the renewable energy share. Scenarios S2 and S3 can increase renewable generation by approximately 115%, while S4 and S5 with a higher AVS deployment drive an increase of over 230%, pushing the total renewable supply significantly beyond the regional demand threshold. In contrast, scenario S1 shows a slight dip (-1%) due to the diversion of biomass. This excess capacity generated in scenarios S2 to S5 has the potential to transform the region into a net clean energy exporter, supporting national decarbonization goals[49,77].
Climate change impacts
Figure 5 compares the net greenhouse gas emissions across all scenarios, illustrating the differences between the reference system and the integrated biochar and AVS interventions. Panel A shows the results under the 2024 electricity mix, while panel B shows the sensitivity analysis using the projected 2030 mix. Absolute values are provided in Supplementary Table 16.
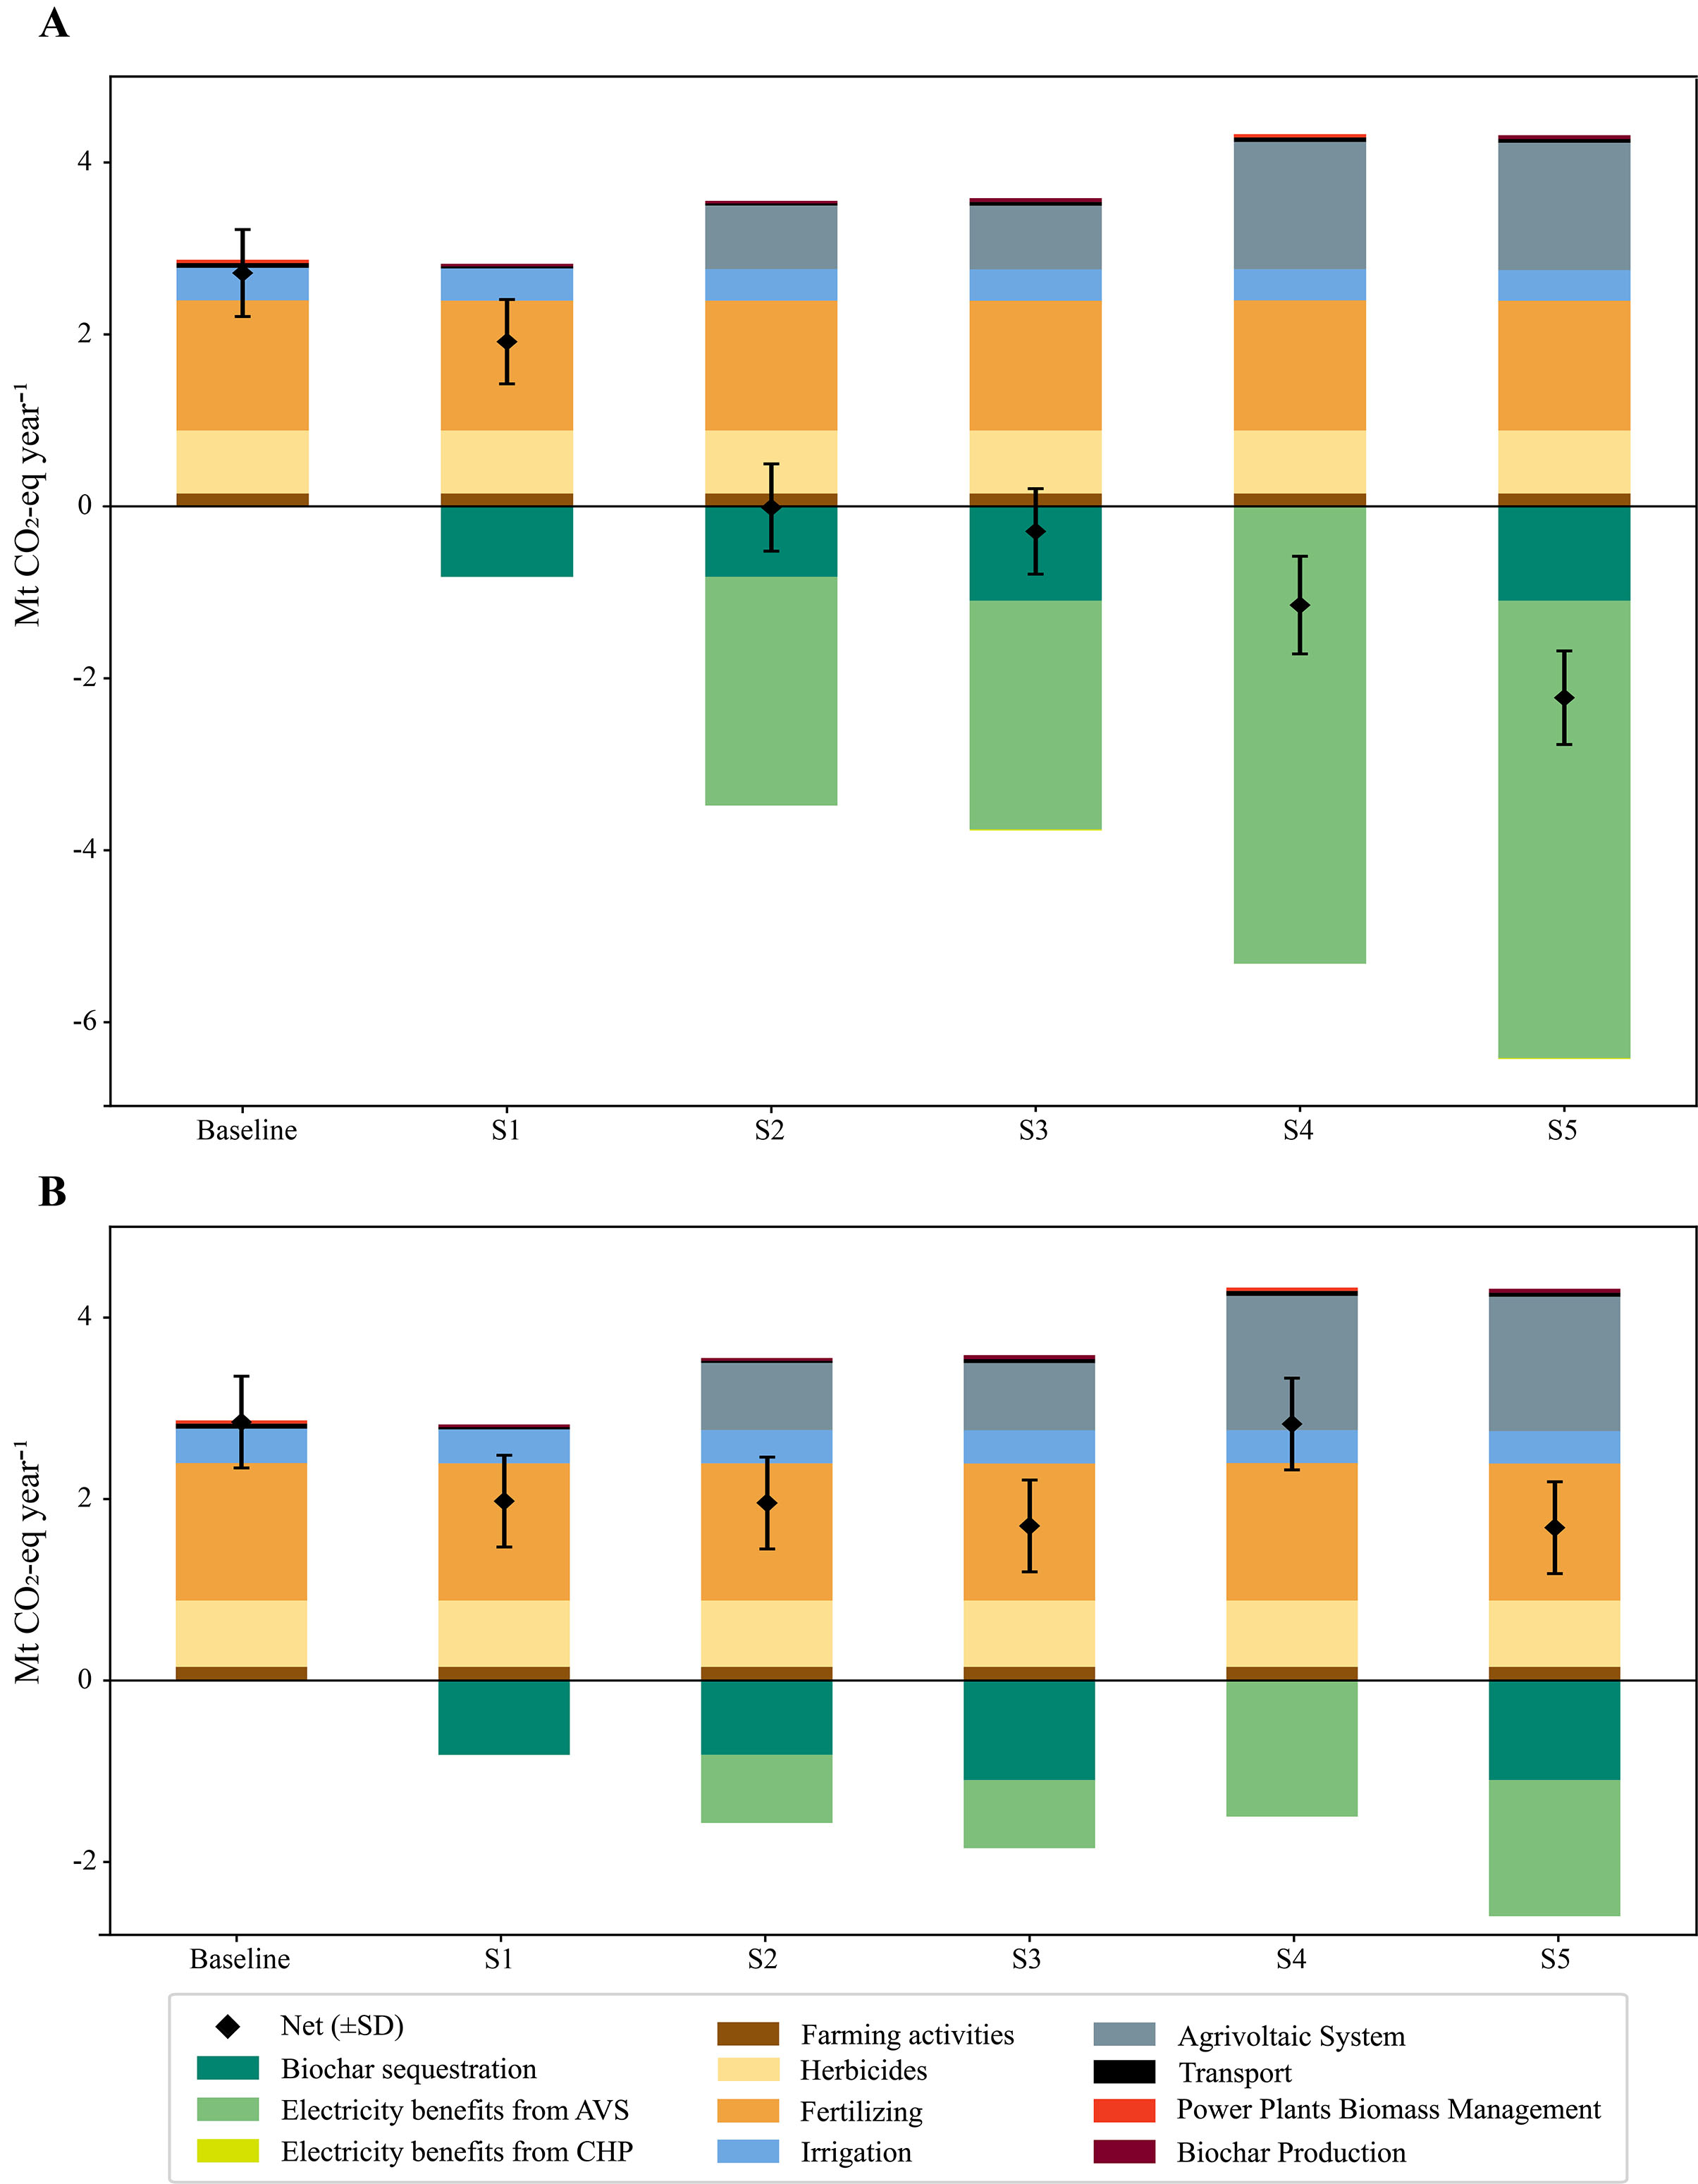
Figure 5. (A) displays the net climate impact of the baseline and intervention scenarios expressed as mega tonnes of CO2 equivalent per year (Mt CO2-eq·year-1), considering the Spanish electricity mix from 2024 for the electricity benefits. (B) shows the sensitivity analysis using the projected 2030 mix. Scenarios are defined by biochar feedstock and AVS deployment levels: S1 (EOP, no AVS), S2 (EOP, 50% AVS), S3 (EOP-OP, 50% AVS), S4 (AVS-only, 100% AVS), and S5 (EOP-OP, 100% AVS). Negative values indicate climate benefits from biochar sequestration and renewable electricity generation. Black markers denote the net total impact with standard deviation (SD) from Monte Carlo simulation.
The reference system emits approximately 2.73 Mt CO2-eq annually, a value in line with previous studies[45]. Across all scenarios, fertilizer application was the largest emissions source (1.51 Mt CO2-eq·year-1, 55% of the total), driven primarily by the energy-intensive manufacturing of nitrogenous compounds. This is followed by herbicides (0.73 Mt CO2-eq·year-1, 27% of the total), with impact stemming from the production of glyphosate. These high impacts reflect the intensive management model characteristic of the region, marked by the reliance on fertilizers to sustain yields and herbicides to maintain bare soil to reduce water competition in olive groves[71,78].
In general, all the scenarios investigated show net emissions that are lower than the baseline, although S1 uncertainty ranges are overlapping. There is a clear progression in climate performance across scenarios. Scenario S1, which is based on biochar from EOP, remains a net emitter (+1.97 Mt CO2-eq·year-1), as biochar-carbon storage in the soil alone does not fully offset emissions from agricultural activities. Introducing AVS is a clear leverage to achieve an almost climate neutral system. In the low-deployment scenarios, S2 (EOP biochar) reduces net emissions to 0.16 Mt CO2-eq·year-1. Here, the additional positive burden comes from the AVS infrastructure (0.74 Mt CO2-eq·year-1), while the mitigation is driven 76% by electricity benefits and 24% by biochar sequestration. The addition of olive pruning (OP) in scenario S3 leads to a negative net impact (-0.11 Mt CO2-eq·year-1). Although managing this extra biomass increases the impacts of biochar production by 33% and transport by 47% compared to S2, these operational costs are outweighed by -1.10 Mt CO2-eq·year-1 and -2.54 Mt CO2-eq·year-1 from the soil carbon sequestration and electricity benefits, respectively.
Scenarios S4 and S5 with higher AVS deployment lead to greater mitigation. In S4, the extensive PV infrastructure adds 1.48 Mt CO2-eq·year-1 of positive emissions. However, this is overwhelmed by the negative emissions from electricity generation (-5.25 Mt CO2-eq·year-1), resulting in a total net impact of -0.94 Mt CO2-eq·year-1. Finally, scenario S5 delivers the largest climate benefit, combining high AVS deployment with maximum biochar production to reach -2.08 Mt CO2-eq·year-1. Here, positive emissions are driven by farming operations (63%) and PV manufacturing (35%), while the system's negative emissions are derived 83% from electricity benefits and 17% from the durable biochar sink.
The application of biochar creates a long-lasting carbon sink at an annual rate of 0.82 Mt CO2-eq·year-1 (S1, S2) to 1.1 Mt CO2-eq·year-1 (S3, S5). This represents a significant contribution, equivalent to offsetting 13% to 17% of Andalusia's 2023 agricultural emissions (6.36 Mt CO2-eq·year-1)[79]. While diverting biomass from combustion to soil storage promotes a circular model, it introduces an energy trade-off, as baseline power plants achieve a lower carbon intensity (32 g CO2-eq kWh-1) compared to the pyrolysis unit
A sensitivity analysis, using the projected 2030 electricity mix (72% lower carbon intensity than 2024[49]) is used to estimate the future energy benefits, shows that mitigation benefits are drastically reduced [Figure 5B]. Under these conditions, baseline and scenario S1 remain unchanged, while net impacts shift to 1.98 ± 0.48 (S2), 1.72 ± 0.49 (S3), 2.84 ± 0.56 (S4), and 1.71 ± 0.54 (S5) Mt CO2-eq·year-1. Despite this reduction, most scenarios still deliver average emission reductions compared to the baseline (30% for S2, 39% for S3, and 40% for S5), but uncertainty ranges are closer. Notably, S4 resulted in a negligible reduction of just 0.08% compared to the baseline, with uncertainty ranges that overlap significantly. Regardless, the structural decline in substitution credits underscores the essential role of biochar in providing robust climate change mitigation, ensuring net-negative emissions even when grid decarbonization diminishes the environmental value of renewable energy generation.
Although the sensitivity analysis frames the climate benefits from large-scale electricity generation as a temporary climate offset, this should not mask its profound contribution to national decarbonization goals. The 26 to 52 TWh of renewable electricity generated annually [Table 2] corresponds to a regional renewable surplus of 115%-230% identified in Section "Scenarios potentials" [Figure 4B]. This capacity is essential for the energy transition, enabling the decarbonization of the grid and improvements in energy security. In addition to promoting more sustainable land uses, the proposed scenarios offer two complementary pathways for climate change mitigation: a durable carbon sink through biochar-carbon storage in agricultural soil and a large source of clean energy through AVS that can support a phase out of obsolescence fossil fuel energy from the grid.
Other environmental impacts
Figure 6 provides the results for other environmental impact categories, normalized to the baseline to allow for comparative interpretation. Absolute values are provided in Supplementary Tables 17-22.
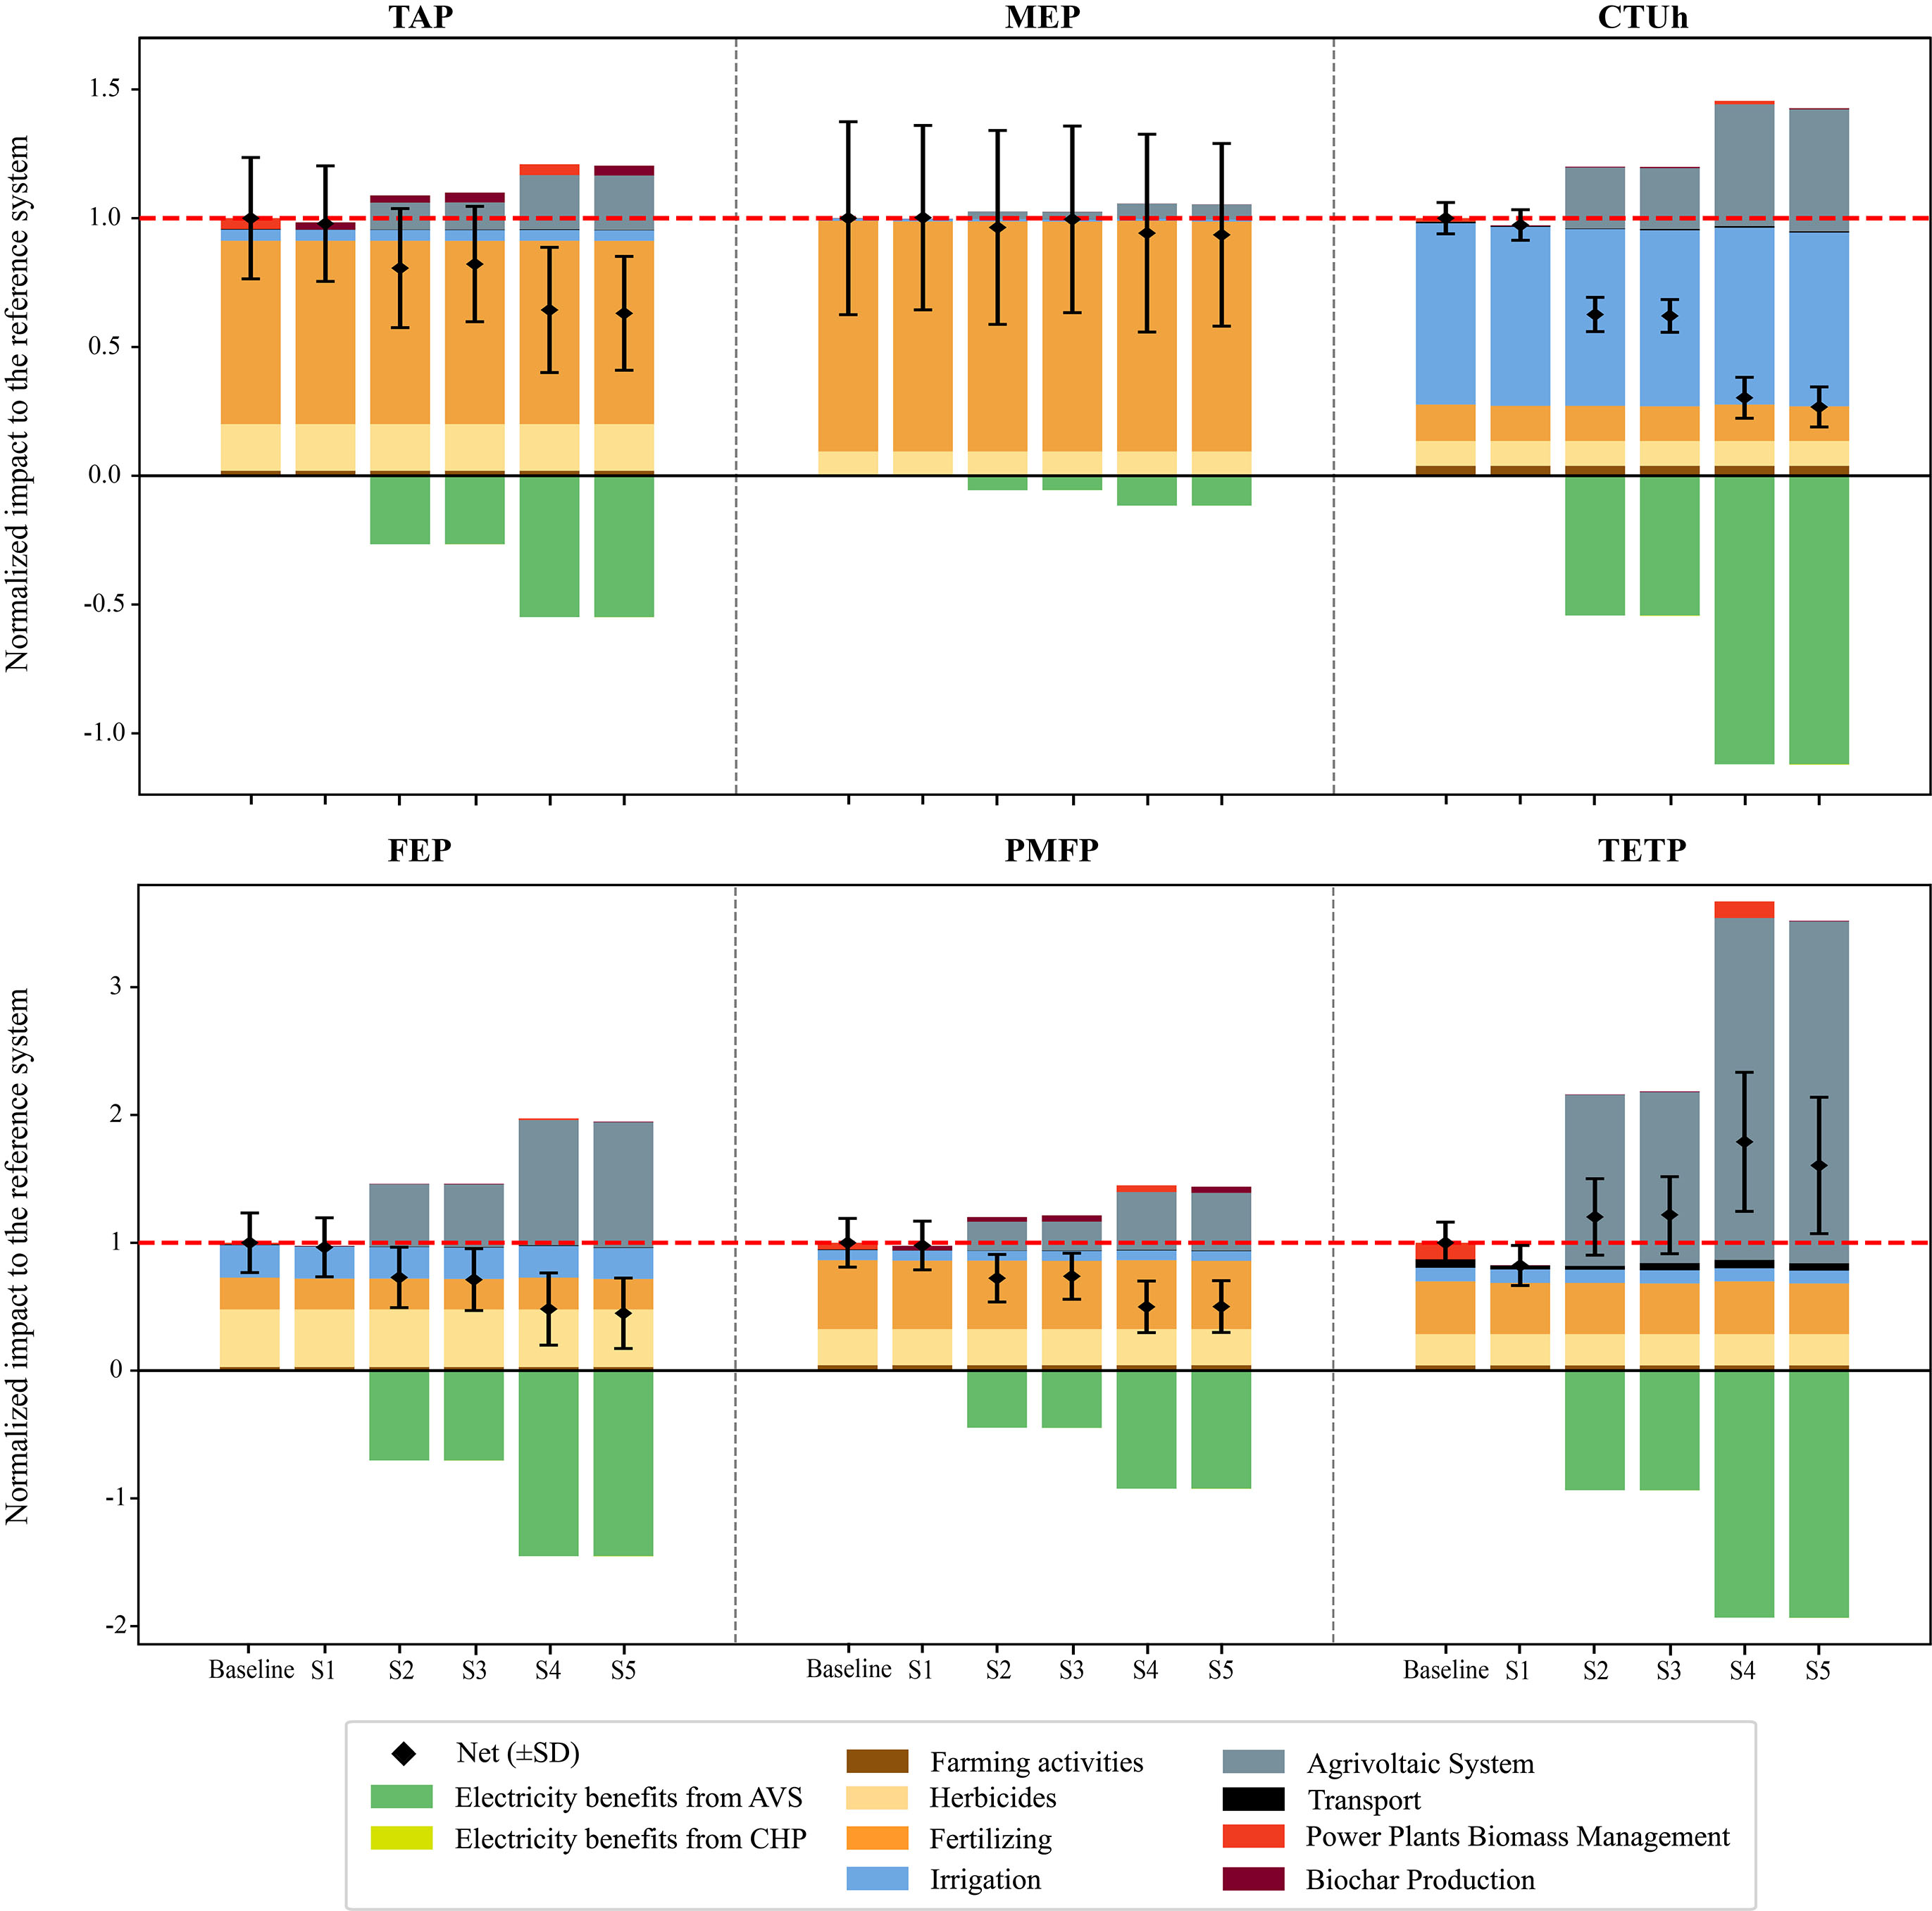
Figure 6. Normalized environmental impacts to the reference system for the proposed scenarios across terrestrial acidification (TAP), freshwater eutrophication (FEP), marine eutrophication (MEP), carcinogenic human toxicity (CTUh), particulate matter formation (PMFP), and terrestrial ecotoxicity (TETP). Scenarios are defined by biochar feedstock and AVS deployment levels: S1 (EOP, no AVS), S2 (EOP, 50% AVS), S3 (EOP-OP, 50% AVS), S4 (AVS-only, 100% AVS), and S5 (EOP-OP, 100% AVS). Black markers denote the net total impact with standard deviation (SD) from Monte Carlo simulation.
Terrestrial Acidification (TAP) in the baseline is 28.62 ± 7.04 kt SO2-eq year-1, primarily driven by fertilizers (ammonia and nitrogen oxide emissions), representing 72% of the total impact. All scenarios achieved a reduction in this category. The largest benefit is found for S5 (18.73 ± 6.41 kt SO2-eq year-1), with a 35% reduction. While the manufacturing of agrivoltaic systems introduces new burdens, these are effectively offset by the environmental credits from renewable electricity generation, which is responsible for most of the benefits. Yet, the uncertainty ranges of all scenarios overlap with that of the baseline.
Marine Eutrophication (MEP) is dominated by nitrogen leaching from fertilizer use (90% of the baseline impact). While biochar application reduces this contribution through nutrient retention, the integrated scenarios introduce additional burdens from the AVS life cycle. However, this increase tends to be compensated for the displacement of grid electricity, resulting in a net reduction of 6% for scenarios S4 and S5. Nonetheless, the high uncertainty observed and the overlap between the scenarios prevent drawing robust conclusions in this category.
Freshwater Eutrophication (FEP) in the reference system is dominated by phosphorus emissions from the manufacturing of glyphosate in herbicides (45%), followed by irrigation (26%), and fertilizers (25%). In Scenario S5, the impacts from irrigation and fertilizers are both reduced by 4%. Although AVS manufacturing introduces a new industrial burden of 0.78 kt P-eq·year-1, this impact is effectively outweighed by the benefits from renewable electricity generation, resulting in a total net reduction of 51% ± 32%.
Fine Particulate Matter Formation (PMFP) follows a similar trend to TAP. In the baseline, 54% of the impact stems from ammonia and NOx emissions associated with fertilizers. While this driver is reduced in biochar scenarios, as fertilizer consumption is reduced, it is outweighed by emissions from the energy intensive manufacturing of silicon for PV panels. However, the credits from electricity substitution compensate for these AVS burdens, resulting in a net reduction of 25% ± 25% in S2, and up to 49% ± 23% in S5, compared to the baseline. However, the uncertainty ranges of scenarios S2 and S3 overlap.
Carcinogenic Human Toxicity (CTUh) is principally driven by irrigation in the baseline (72%). The largest benefits are here achieved with S5 (70% ± 7.87%), due to the biochar increased water retention and AVS reduction in irrigation needs. While AVS systems introduce new burdens, they are completely compensated by the energy generation credits.
Terrestrial Ecotoxicity (TETP) presents a different profile. In the baseline, the impact is 10.21 Mt 1.4-DCB-
This analysis highlights that synthetic fertilizer production is the dominant driver for many impacts categories, including TAP, MEP, PMFP and TETP. Consequently, management strategies that reduce fertilizer dependence demonstrate a clear pathway to mitigating these critical on-farm impacts, a problem already highlighted from other assessment studies in olive groves[71]. Biochar contributions to increase soil nutrient retention help to mitigate this environmental hotspot. Results also clearly show that the interventions proposed introduce environmental trade-offs stemming from AVS manufacturing, most notably in TETP and FEP. While these burdens are currently compensated by electricity credits in most categories, this contribution will gradually decrease as the grid decarbonizes. This underlines the importance of reducing the embodied impact of the agrivoltaic system, which has been observed to be highly sensitive to panel efficiency and technological advancements.
Site-specific implications
Figure 7 summarizes additional implications of the evaluated scenarios at the hectare scale, providing farm-level insights that are not fully captured by the regional aggregated results shown above. To facilitate this comparison, the results focus on the specific technologies, namely biochar, AVS, and their combined application (biochar + AVS), when applied to a single hectare, allowing for a direct evaluation of the management system's impact on a per-hectare basis relative to conventional land management (baseline). Absolute values are provided in Supplementary Table 23.
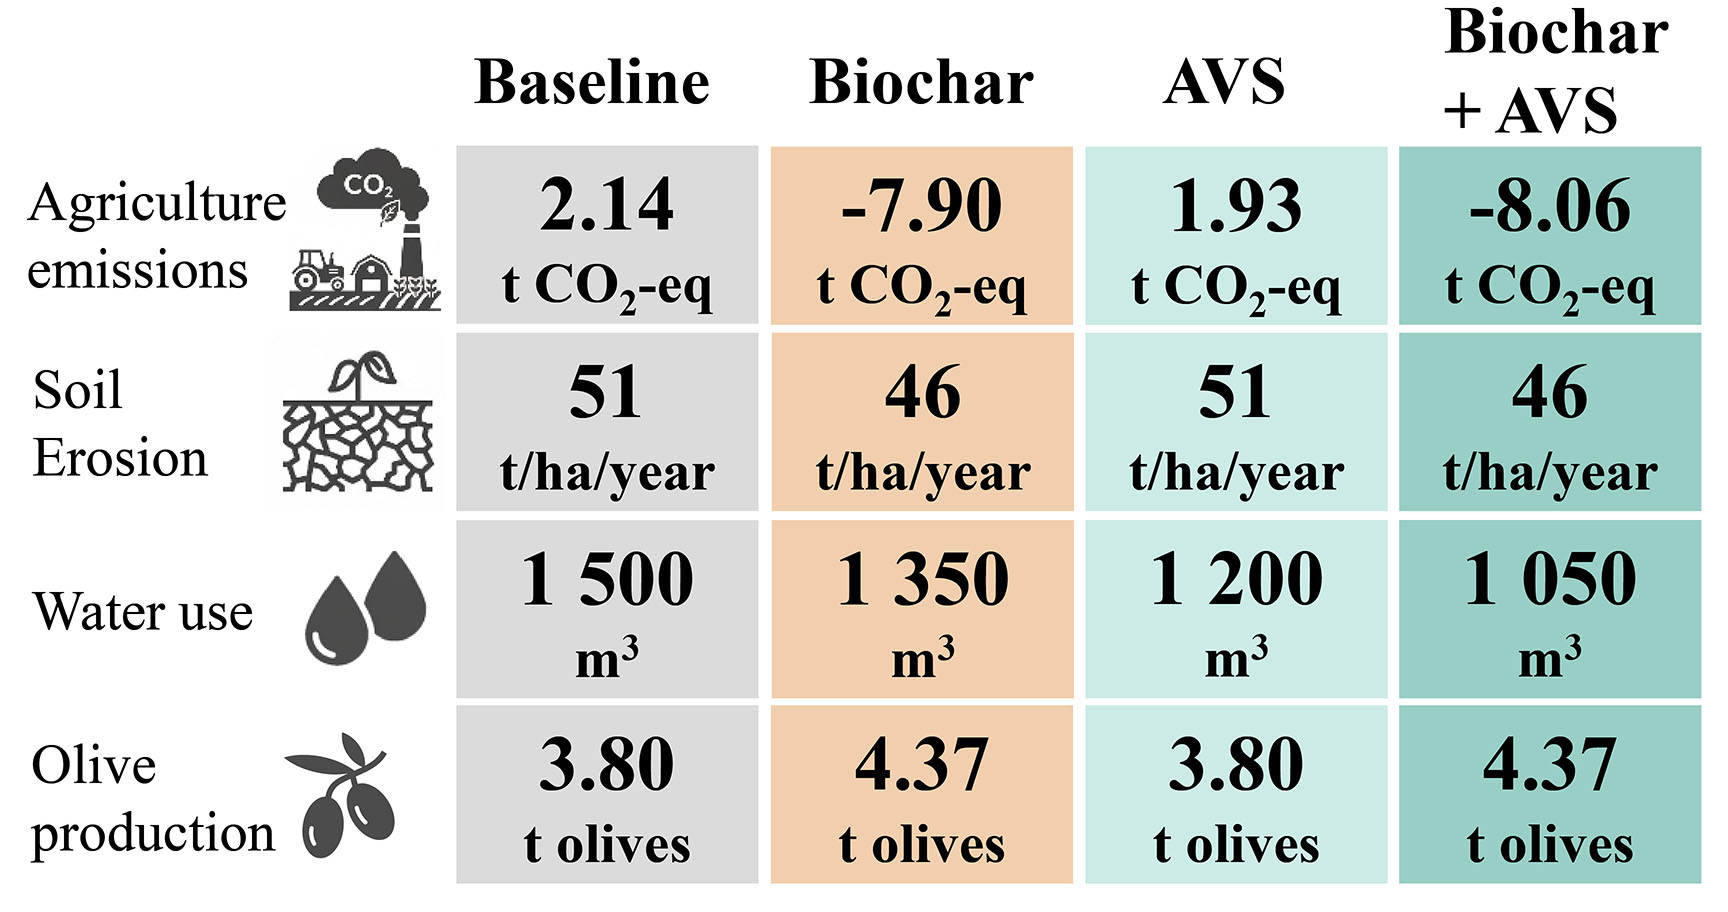
Figure 7. Site-level implications of baseline and intervention scenarios (biochar, AVS, or their combined application) for an average management of 1-hectare olive grove. Metrics include agricultural emissions (t CO2-eq·ha-1) including carbon sequestration from biochar, soil erosion (t·ha-1·year-1), irrigation water use (m3·ha-1·year-1), and olive yield (t·ha-1). Values reflect the specific environmental performance of a hectare under each management strategy.
Agricultural emissions in Andalusian olive groves are reported from other sources to range from 1.26 to
Soil erosion is a critical concern, with baseline soil losses averaging at 51 t·ha-1·year-1, far above the
Water resource management also benefits from these interventions. The baseline average irrigation demand of 1,500 m3·ha-1·year-1 decreases by 10% with biochar and 20% with AVS, reaching 1,050 m3·ha-1·year-1 when both strategies are combined. These savings are driven by improved soil water-holding capacity from biochar[11,62,67] and reduced evapotranspiration under AVS structures[9,59]. Such combined effects are particularly relevant in a region facing recurrent droughts and a growing prevalence of irrigated olive systems, which now account for 40% of the total cultivated area in a crop traditionally rainfed[19].
Finally, regarding productivity, our results indicate a 15% increase in olive yield (from 3.80 to 4.37 t·ha-1) associated with biochar application, attributed to enhance soil fertility and nutrient retention[17]. This agronomic advantage was not directly captured in previous sections as results were shown on an annual basis, but it represents a key co-benefit for farmer adoption. These site-level findings highlight the multidimensional benefits of integrating biochar and AVS, extending beyond climate mitigation to address soil health, water efficiency, and crop productivity. However, variability in soil conditions and management practices warrants further research to validate these outcomes across large spatial scales.
LIMITATIONS AND FUTURE RESEARCH
This study accounts for a wide range of possible uncertainty factors stemming from biochar effects on the soil, its production and supply chain, and differences on PV intensity per hectare. These variabilities have been included in the Monte-Carlo analysis to investigate how they affect our results. The conclusions drawn from the results are generally robust to these pooled uncertainties, especially for climate change and most of the other environmental impact categories, whereas no clear conclusions can be drawn for marine eutrophication and terrestrial acidification, potentially leading to trade-offs. This is consistent with other LCA studies for both biochar and AVS, which show potential trade-offs between climate change mitigation and increased impacts in other impact categories[33,51,52,82].
The analysis includes a dynamic quantification of the benefits from electricity displacement, accounting for progressive grid decarbonization. However, a consistent assessment of the system’s future climatic effects should also consider technological and manufacturing improvements across the different activities, which may reduce the absolute impacts of the AVS and biochar systems and potentially offset part of the reduced benefits from electricity substitution. This can be particularly evident in AVS's environmental performance, which is sensitive to the photovoltaic panel technology used. The life cycle inventory (LCI) data sourced from ecoinvent v3.11 does not fully reflect recent technological improvements[42,83], as it includes an efficiency of around 13% and a climate impact of 28.62 g CO2-eq kWh-1. In contrast, higher module efficiency, combined with the use of cleaner electricity grids in manufacturing and reduced material consumption (e.g., thinner silicon wafers), has been reported to lower the climate impact of modern technology to as low as
LCA studies are subject to different assumptions regarding system boundaries and methodological choices, which make results specific to the individual case and comparison across studies challenging[33,45,52]. In our case, the analysis is tailored to Andalusian olive groves and a specific feedstock composition, both of which influence biochar yield and carbon content[8], as well as transport distances between pyrolysis plants and application sites. To expand the applicability of biochar, future research should explore alternative agro-industrial residues beyond those from the olive oil industry, given the wide diversity of biomass available in Andalusia[86].
This study considered a uniform biochar application rate of 5 t ha-1 across the study region. However, alternative application rates are possible, and they would likely influence both soil responses and the total land area treated[11,69]. For instance, severely degraded sites may require higher or more frequent applications to effectively contrast degradation processes[62,87]. While the chosen application rate determines the carbon sequestered per hectare, the estimated regional carbon capture remains unchanged as biochar production is constrained by biomass availability. Consequently, varying the dosage redistributes the same total quantity of sequestered carbon across a different spatial extent rather than altering the total mitigation potential.
Beyond application rates, biochar’s agronomic benefits (i.e., erosion reduction, lower fertilizer and water use, and yield increase) are subject to local variability due to soil heterogeneity. However, regional modeling studies suggest that local fluctuations tend to offset across space, making aggregated impact factors a robust proxy for estimating overall trends[52,66,69]. While the absolute magnitude of these benefits may vary by site, the direction of environmental impacts remains consistent, allowing regional data to capture broad spatial patterns effectively[66,69]. For these reasons, results in this study are presented at an aggregated regional scale, for which the use of regionally averaged factors provides a robust representation of overall trends, as local heterogeneity in soils, climate, and management tends to offset. By contrast, analyses conducted at higher spatial resolution or focused on a limited subset of locations (e.g., individual farms or specific grid cells) cannot rely on regional averages and require context-specific empirical data to generate reliable estimates. Future research should therefore prioritize the development of high-resolution databases on biochar/AVS-induced soil effects to support site-specific assessments and enable more targeted and optimal deployment of these strategies.
AVS deployment in this study was limited to irrigated olive groves with low slopes (< 5%), a constraint that helps mitigate concerns related to grid access and technological feasibility[30,32]. However, future analyses could expand this boundary, as some commercial AVS providers report feasibility on slopes up to 30%[88]. A more critical challenge lies in the grid’s ability to absorb the high deployment potential of renewables (up to 52 TWh) and address potential grid instability arising from the intermittent nature of solar power. Consequently, the investment in grid reinforcement and energy storage strategies is essential to enhance system resilience, reduce stress, and minimize reliance on fossil-based peak generation[49,89]. These challenges have been underscored by events such as the 2025 national blackout[90]. Alternative solutions for utilizing surplus on-site electricity generation can also be explored, such as producing hydrogen, which can be stored for use during periods of low renewable energy availability or exported to support the growing demands of a future hydrogen economy.
Regarding the interactions between photovoltaic panels and the agroecosystem, our analysis assumed no negative impact on crop yield. This assumption is grounded in the use of a dual-axis tracking system, which has been shown to minimize shading effects[33], distinguishing it from static designs that have reported yield reductions of up to 10%[32]. Beyond yield preservation and the modeled water savings, future research should quantify additional ecosystem services. For instance, AVS-induced groundcover and cooler microclimates[34,59] could not only complement the erosion reduction effects of biochar in olive groves, but also offer opportunities to establish biodiversity corridors in the unfarmed strips of land created, thereby enhancing habitat quality for pollinators[34,59,91].
However, the absolute magnitude of these co-benefits is sensitive to site-specific characteristics, such as soil texture and topography[92], as well as operational constraints like machinery maneuverability or maintenance requirements[59]. These factors may result in lower actual benefits than the regional potentials estimated here. Moreover, current policy frameworks lack mechanisms to ensure that agricultural productivity is prioritized over energy generation[93]. These challenges highlight the essential need for targeted policy support and farmer training programs to effectively manage these integrated energy and land use systems to maximize environmental benefits and technical feasibility[30,60].
Surface albedo alterations from biochar application or AVS deployment were not quantified in this analysis. Biochar application darkens the soil surface, potentially inducing a warming feedback that could reduce its climate mitigation potential by 13%-22% in some arable systems[94]. However, the permanent olive canopy and the presence of vegetative cover crops, whether implemented for erosion control or facilitated by the AVS-induced microclimate, can mask the darker soil, attenuating the radiative forcing effect compared to bare-soil conditions[95]. Similarly, while the installation of PV panels decreases local albedo, recent global assessments indicate that this radiative forcing is minor compared to the substantial carbon avoidance from renewable energy generation, being neutralized within the first year of operation[96].
The economic dimension, while beyond the scope of this study, remains a critical barrier to practical implementation. For biochar, the projected 2025 carbon removal credit price is €128 per tonne[97], while the purchase price in Spain is reported at approximately €400 per tonne[23]. Accounting for these carbon credits, the net cost of applying biochar at a rate of 5 t ha-1 translates into €1,360 per hectare. This represents a substantial investment for farmers, especially in the absence of robust incentives for biochar soil application in Spain[81]. Similarly, AVS systems require high upfront capital investments; however, available data suggest a payback period of less than five years by the estimated electricity outputs (excluding long-term soil benefits), offering significant potential for revenue generation[31,34,60,85]. Nonetheless, widespread adoption of these synergistic strategies will likely depend on targeted policy support to overcome financial barriers and ensure economic feasibility for farmers. To facilitate this adoption, current support mechanisms should evolve to prioritize the funding of ecosystem services over intensive production models[98]. Redirecting financial support toward land-use strategies that deliver carbon sequestration and soil health is essential to align rural policies with environmental goals. Furthermore, establishing such financial mechanisms is identified as a prerequisite for a systemic transformation of the agri-food sector[99], providing the necessary leverage to enable farmers to transition from intensive monocultures to resilient, climate-smart systems like the ones proposed here.
CONCLUSIONS
This study evaluated the environmental profile of integrating biochar production and agrivoltaic systems (AVS) within Andalusia’s olive agroecosystem. Using five scenarios to capture different regional levels of biomass availability and AVS deployment, our life cycle assessment quantified a range of environmental impacts for these interventions against the current baseline.
The results confirm that the investigated strategies can deliver substantial climate benefits through two complementary pathways, namely long-term carbon storage in soils via biochar and short-term emission reductions through renewable electricity generation. Scenario 5, which combines high biomass availability and AVS deployment, achieves the largest climate change mitigation. Although the sensitivity analysis with the projected 2030 electricity mix shows that AVS benefits decline as the grid decarbonizes, their role in accelerating the energy transition remains significant. This finding also highlights the relevance of scaling biochar’s long-term carbon sequestration, as its adoption across all Andalusian olive groves could offset a substantial portion of agricultural emissions.
Beyond climate impacts, the integration of biochar and AVS brings additional benefits at the farm scale. Reductions in irrigation demand, improvements in soil structure and annual erosion potential, and yield increases, highlight the potential of these strategies to strengthen agroecosystem resilience in a region facing recurrent droughts and severe erosion.
The analysis also reveals environmental trade-offs stemming from PV panel manufacturing, which adds considerable burdens to various impact categories, specifically causing terrestrial ecotoxicity to perform worse than the baseline. However, these findings do not undermine the overall potential of the system but point to areas where technological improvements and updated life cycle data could further enhance environmental performance.
Alongside these environmental considerations, economic feasibility and policy support remain decisive factors for adoption. Biochar application costs and AVS capital requirements remain high, yet both strategies offer opportunities for income diversification and land-use efficiency if supported by targeted incentives and adaptive designs that prioritize long-term crop productivity and delivery of key ecosystem services that secure the long-term sustainability of the landscape. While the evidence presented here positions these interventions as strategic tools for Spain’s climate and energy goals, future work should focus on more extensive field validation and policy frameworks that enable farmers to adopt these solutions at scale. By addressing these dimensions, the proposed model can serve as a replicable pathway for sustainable agriculture in dryland regions worldwide.
DECLARATIONS
Acknowledgements
The authors thank Carboliva S. L. for providing technical details regarding the biochar production system from olive pomace.
Authors' contributions
Writing - original draft; writing - review & editing; visualization; validation; software; methodology, investigation; formal analysis; and conceptualization: Salmerón, M.
Writing- review and editing; validation; supervision, conceptualization; and funding acquisition: Cherubini, F.
Writing - review and editing; validation; supervision, conceptualization; methodology; and project administration: Dias de Souza, N. R.
Availability of data and materials
The data presented in this study are available on request from the corresponding author.
AI and AI-assisted tools statement
Not applicable.
Financial support and sponsorship
This work was supported by the LCA4BIO project (https://lca4bioproject.eu/) Horizon Europe grant agreement No. 101135371.
Conflicts of interest
All authors declared that there are no conflicts of interest.
Ethical approval and consent to participate
Not applicable.
Consent for publication
Not applicable.
Copyright
© The Author(s) 2026.
Supplementary Materials
REFERENCES
1. IPCC. Climate change and land: IPCC special report on climate change, desertification, land degradation, sustainable land management, food security, and greenhouse gas fluxes in terrestrial ecosystems. Cambridge University Press; 2022. Available from: https://www.ipcc.ch/srccl/ [Last accessed on 11 Mar 2026].
2. Lacirignola, C.; Capone, R.; Debs, P.; El, Bilali. H.; Bottalico, F. Natural resources - food nexus: food-related environmental footprints in the mediterranean countries. Front. Nutr. 2014, 1, 23.
3. Hultgren, A.; Carleton, T.; Delgado, M.; et al. Impacts of climate change on global agriculture accounting for adaptation. Nature 2025, 642, 644-52.
5. Ferreira, C. S. S.; Seifollahi-Aghmiuni, S.; Destouni, G.; Ghajarnia, N.; Kalantari, Z. Soil degradation in the European Mediterranean region: processes, status and consequences. Sci. Total. Environ. 2022, 805, 150106.
6. Antonelli, M.; Basile, L.; Gagliardi, F.; Isernia, P. The future of the Mediterranean agri-food systems: trends and perspectives from a Delphi survey. Land. Use. Policy. 2022, 120, 106263.
7. IEMed. Agriculture and food security in climate sensitive areas in the mediterranean. Publications Office: LU; 2020. Available from: https://data.europa.eu/doi/10.2863/584624 [Last accessed on 11 Mar 2026].
8. Biswal, B. K.; Balasubramanian, R. Use of biomass-derived biochar as a sustainable material for carbon sequestration in soil: recent advancements and future perspectives. NPJ. Mater. Sustain. 2025, 3, 26.
9. Barron-Gafford, G. A.; Murphy, P.; Salazar, A.; et al. Agrivoltaics as a climate-smart and resilient solution for midday depression in photosynthesis in dryland regions. NPJ. Sustain. Agric. 2025, 3, 32.
10. Stid, J. T.; Shukla, S.; Kendall, A. D.; et al. Impacts of agrisolar co-location on the food-energy-water nexus and economic security. Nat. Sustain. 2025, 8, 702-13.
11. Tisserant, A.; Hu, X.; Liu, Q.; Xie, Z.; Zhao, W.; Cherubini, F. Biochar and its potential to deliver negative emissions and better soil quality in Europe. Earth's. Future. 2023, 11, e2022EF003246.
12. Eurostat. Key figures on the European food chain - 2024 edition. Available from: https://ec.europa.eu/eurostat/web/products-key-figures/w/ks-01-24-000 [Last accessed on 11 Mar 2026].
13. Inventario nacional de erosión de suelos. Available from: https://www.miteco.gob.es/en/biodiversidad/servicios/banco-datos-naturaleza/informacion-disponible/inventario_nacional_erosion.html [Last accessed on 11 Mar 2026].
14. Panagos, P.; Ballabio, C.; Poesen, J.; et al. A soil erosion indicator for supporting agricultural, environmental and climate policies in the European Union. Remote. Sens. 2020, 12, 1365.
15. Galán-Martín, Á.; Contreras, M. D. M.; Romero, I.; et al. The potential role of olive groves to deliver carbon dioxide removal in a carbon-neutral Europe: opportunities and challenges. Renew. Sustain. Energy. Rev. 2022, 165, 112609.
16. Junta de Andalucía. Análisis de la densidad en las plantaciones de olivar en Andalucía. 2019. Available from: https://www.juntadeandalucia.es/sites/default/files/2020-04/An%C3%A1lisis%20densidad%20olivar%20andaluz%20v3_0.pdf [Last accessed on 11 Mar 2026].
17. De La Rosa, J. M.; Campos, P.; Diaz-Espejo, A.; et al. Soil biochar application: assessment of the effects on soil water properties, plant physiological status, and yield of super-intensive olive groves under controlled irrigation conditions. Agronomy 2022, 12, 2321.
18. Gratsea, M.; Varotsos, K.; López-Nevado, J.; López-Feria, S.; Giannakopoulos, C. Assessing the long-term impact of climate change on olive crops and olive fly in Andalusia, Spain, through climate indices and return period analysis. Clim. Serv. 2022, 28, 100325.
19. Junta de Andalucía. Primera estrategia andaluza para el sector del olivar. 2027. Available from: https://www.juntadeandalucia.es/sites/default/files/2025-02/Plan_Estrate%CC%81gico_Olivar_digital.pdf [Last accessed on 11 Mar 2026].
20. Lehmann, J.; Cowie, A.; Masiello, C. A.; et al. Biochar in climate change mitigation. Nat. Geosci. 2021, 14, 883-92.
21. Smith, P. Soil carbon sequestration and biochar as negative emission technologies. Glob. Chang. Biol. 2016, 22, 1315-24.
22. Gahane, D.; Biswal, D.; Mandavgane, S. A. Life cycle assessment of biomass pyrolysis. Bioenergy. Res. 2022, 15, 1387-406.
23. Fornes, F.; Lidón, A.; Belda, R. M.; et al. Soil fertility and plant nutrition in an organic olive orchard after 5 years of amendment with compost, biochar or their blend. Sci. Rep. 2024, 14, 16606.
24. Crespo-Barreiro, A.; Gómez, N.; González-Arias, J.; Ortiz-Liébana, N.; González-Andrés, F.; Cara-JIménez, J. Scaling-up of the production of biochar from olive tree pruning for agricultural use: evaluation of biochar characteristics and phytotoxicity. Agriculture 2023, 13, 1064.
25. Khan, S.; Irshad, S.; Mehmood, K.; et al. Biochar production and characteristics, its impacts on soil health, crop production, and yield enhancement: a review. Plants 2024, 13, 166.
26. Gu, K.; Gao, K.; Guan, S.; et al. The impact of the combined application of biochar and organic fertilizer on the growth and nutrient distribution in wheat under reduced chemical fertilizer conditions. Sci. Rep. 2025, 15, 5285.
27. Pokharel, U.; Neelgund, G.; Ray, R. L.; Balan, V.; Kumar, S. Biochar for soil amendment: applications, benefits, and environmental impacts. Bioengineering 2025, 12, 1137.
28. Solargis. Solar resource maps & GIS data. 2021. Available from: https://solargis.com/resources/free-maps-and-gis-data [Last accessed on 11 Mar 2026].
29. Análisis, S. G.; Estadística, C. Extensión de los parques fotovoltaicos en españa. 2024. Available from: https://www.mapa.gob.es/dam/mapa/contenido/ministerio/servicios/servicios-de-informacion/analisis-y-prospectiva/ayp-serie-agrinfo/ayp_37_parquefotovoltaico.pdf [Last accessed on 11 Mar 2026].
30. Varo-Martínez, M.; López-Bernal, A.; Fernández, De. Ahumada. L.; López-luque, R.; Villalobos, F. Simulation model for electrical and agricultural productivity of an olive hedgerow Agrivoltaic system. J. Clean. Prod. 2024, 477, 143888.
31. Fernández-Solas, Á.; Fernández-Ocaña, A. M.; Almonacid, F.; Fernández, E. F. Potential of agrivoltaics systems into olive groves in the Mediterranean region. Appl. Energy. 2023, 352, 121988.
32. Mouhib, E.; Fernández-Solas, Á.; Pérez-Higueras, P. J.; et al. Enhancing land use: integrating bifacial PV and olive trees in agrivoltaic systems. Appl. Energy. 2024, 359, 122660.
33. Ravilla, A.; Shirkey, G.; Chen, J.; Jarchow, M.; Stary, O.; Celik, I. Techno-economic and life cycle assessment of agrivoltaic system (AVS) designs. Sci. Total. Environ. 2024, 912, 169274.
34. Merheb, C.; Macknick, J.; Davatzes, N.; Ravi, S. Synergies and trade-offs of multi-use solar landscapes. Nat. Sustain. 2025, 8, 857-70.
35. Marrou, H.; Dufour, L.; Wery, J. How does a shelter of solar panels influence water flows in a soil-crop system? Eur. J. Agron. 2013, 50, 38-51.
36. Hassanpour Adeh, E.; Selker, J. S.; Higgins, C. W. Remarkable agrivoltaic influence on soil moisture, micrometeorology and water-use efficiency. PLoS. ONE. 2018, 13, e0203256.
37. Gobierno de España. Orden TED/765/2024, de 22 de julio, por la que se establecen las bases reguladoras para la concesión de ayudas a la inversión en proyectos innovadores de energías renovables y almacenamiento, así como a la implantación de sistemas térmicos renovables (Programa de energías renovables innovadoras), en el marco del Plan de Recuperación, Transformación y Resiliencia, financiado por la Unión Europea-Next Generation EU. 2024. Available from: https://www.boe.es/boe/dias/2024/07/25/pdfs/BOE-A-2024-15413.pdf [Last accessed on 11 Mar 2026].
38. El MITECO destina 148 millones a 199 proyectos pioneros con almacenamiento de agrivoltaica, renovables en infraestructuras, y bomba de calor. 2025. Available from: https://www.miteco.gob.es/es/prensa/ultimas-noticias/2025/agosto/el-miteco-destina-148-millones-a-199-proyectos-pioneros-con-alma.html [Last accessed on 11 Mar 2026].
39. Manzanares, P.; Ruiz, E.; Ballesteros, M.; et al. Residual biomass potential in olive tree cultivation and olive oil industry in Spain: valorization proposal in a biorefinery context. Span. J. Agric. Res. 2017, 15, e0206.
40. Huijbregts, M. A. J.; Steinmann, Z. J. N.; Elshout, P. M. F.; et al. ReCiPe2016: a harmonised life cycle impact assessment method at midpoint and endpoint level. Int. J. Life. Cycle. Assess. 2016, 22, 138-47.
41. Rosenbaum, R. K.; Huijbregts, M. A. J.; Henderson, A. D.; et al. USEtox human exposure and toxicity factors for comparative assessment of toxic emissions in life cycle analysis: sensitivity to key chemical properties. Int. J. Life. Cycle. Assess. 2011, 16, 710-27.
42. Wernet, G.; Bauer, C.; Steubing, B.; Reinhard, J.; Moreno-Ruiz, E.; Weidema, B. The ecoinvent database version 3 (part I): overview and methodology. Int. J. Life. Cycle. Assess. 2016, 21, 1218-30.
43. Fernández-Lobato, L.; López-Sánchez, Y.; Blejman, G.; Jurado, F.; Moyano-Fuentes, J.; Vera, D. Life cycle assessment of the Spanish virgin olive oil production: A case study for Andalusian region. J. Clean. Prod. 2021, 290, 125677.
44. Fernández-Lobato, L.; Ruiz-Carrasco, B.; Tostado-Véliz, M.; Jurado, F.; Vera, D. Environmental impact of the most representative Spanish olive oil farming systems: a life cycle assessment study. J. Clean. Prod. 2024, 442, 141169.
45. Fernández-Lobato, L.; Aguado, R.; Jurado, F.; Vera, D. Biomass gasification as a key technology to reduce the environmental impact of virgin olive oil production: a life cycle assessment approach. Biomass. Bioenergy. 2022, 165, 106585.
46. Fernández-Lobato, L.; García-Ruiz, R.; Jurado, F.; Vera, D. Life cycle assessment, C footprint and carbon balance of virgin olive oils production from traditional and intensive olive groves in southern Spain. J. Environ. Manag. 2021, 293, 112951.
47. Carboliva, S. L. Industrial data on the pyrolysis of olive pomace (Unpublished industrial data provided by the company). Company website: https://www.carboliva.es/en/ [Last accessed on 18 Mar 2026].
48. Redeia. National electricity system: generation structure by technology. Red Eléctrica 2024. Available from: https://www.ree.es/en/datos/generation/generation-structure [Last accessed on 11 Mar 2026].
49. Ministerio para la Transición Ecológica y el Reto Demográfico. Plan nacional integrado de energía y clima (2023-2030). 2024. Available from: https://www.miteco.gob.es/content/dam/miteco/es/energia/files-1/pniec-2023-2030/PNIEC_2024_240924.pdf [Last accessed on 11 Mar 2026].
50. Yang, Q.; Zhou, H.; Bartocci, P.; et al. Prospective contributions of biomass pyrolysis to China's 2050 carbon reduction and renewable energy goals. Nat. Commun. 2021, 12, 1698.
51. Parascanu, M.; Puig, Gamero. M.; Sánchez, P.; Soreanu, G.; Valverde, J.; Sanchez-silva, L. Life cycle assessment of olive pomace valorisation through pyrolysis. Renew. Energy. 2018, 122, 589-601.
52. Tisserant, A.; Morales, M.; Cavalett, O.; et al. Life-cycle assessment to unravel co-benefits and trade-offs of large-scale biochar deployment in Norwegian agriculture. Resour. Conserv. Recycl. 2022, 179, 106030.
53. Werra, M.; Watanabe, M. D. B.; Ballal, V.; et al. Life-cycle assessment of ferromanganese production using biocarbon as reductant and carbon capture and storage. Environ. Impact. Assess. Rev. 2026, 117, 108204.
54. Ministerio de Agricultura, Alimentación y Medio Ambiente. Real decreto 815/2013, de 18 de Octubre, Por El Que Se aprueba el reglamento de emisiones industriales y de desarrollo de La Ley 16/2002, de 1 de Julio, de prevención y control integrados de la contaminación. 2013. Available from: https://www.boe.es/eli/es/rd/2013/10/18/815 [Last accessed on 11 Mar 2026].
55. Casares De La Torre, F.; Varo, M.; López-Luque, R.; Ramírez-Faz, J.; Fernández-Ahumada, L. Design and analysis of a tracking/backtracking strategy for PV plants with horizontal trackers after their conversion to agrivoltaic plants. Renew. Energy. 2022, 187, 537-50.
56. Krasner, N. Z.; Fox, J.; Armstrong, A.; et al. Impacts of photovoltaic solar energy on soil carbon: a global systematic review and framework. Renew. Sustain. Energy. Rev. 2025, 208, 115032.
57. Kumpanalaisatit, M.; Setthapun, W.; Sintuya, H.; Pattiya, A.; Jansri, S. N. Current status of agrivoltaic systems and their benefits to energy, food, environment, economy, and society. Sustain. Prod. Consum. 2022, 33, 952-63.
58. AgrawData. Los olivos superintensivos: su impacto en producción de aceite de oliva. 2024. Available from:https://agrawdata.com/blog/olivos-superintensivos/ [Last accessed on 11 Mar 2026].
59. Agrivoltaics. Opportunities for agriculture and the energy transition. 2024. Available from: https://www.ise.fraunhofer.de/en/publications/studies/agrivoltaics-opportunities-for-agriculture-and-the-energy-transition.html [Last accessed on 11 Mar 2026].
60. European Commission. Overview of the potential and challenges for agri-photovoltaics in the European Union. Publications Office; 2023. Available from: https://publications.jrc.ec.europa.eu/repository/handle/JRC132879 [Last accessed on 11 Mar 2026].
61. Ferreira, R. F.; Marques, Lameirinhas. R. A.; Correia, V. P. Bernardo C, Torres JPN, Santos M. Agri-PV in Portugal: how to combine agriculture and photovoltaic production. Energy. Sustain. Dev. 2024, 79, 101408.
62. Premalatha, R. P.; Poorna, Bindu. J.; Nivetha, E.; et al. A review on biochar’s effect on soil properties and crop growth. Front. Energy. Res. 2023, 11, 1092637.
63. European Commission. Indicators to support the soil perspectives of the common agricultural policy (CAP). Publications Office; 2023. Available from: https://publications.jrc.ec.europa.eu/repository/handle/JRC132234 [Last accessed on 11 Mar 2026].
64. Kroeger, J. E.; Pourhashem, G.; Medlock, K. B.; Masiello, C. A. Water cost savings from soil biochar amendment: a spatial analysis. GCB. Bioenergy. 2020, 13, 133-42.
65. Sánchez-Monedero, M. A.; Cayuela, M. L.; Sánchez-García, M.; et al. Agronomic evaluation of biochar, compost and biochar-blended compost across different cropping systems: perspective from the European project FERTIPLUS. Agronomy 2019, 9, 225.
66. Gholamahmadi, B.; Jeffery, S.; Gonzalez-Pelayo, O.; et al. Biochar impacts on runoff and soil erosion by water: a systematic global scale meta-analysis. Sci. Total. Environ. 2023, 871, 161860.
67. Yang, W.; Zhang, L.; Wang, Z.; Zhang, J.; Li, P.; Su, L. Effects of biochar and nitrogen fertilizer on microbial communities, CO2 emissions, and organic carbon content in soil. Sci. Rep. 2025, 15, 9789.
68. Agronomía. Biochar impulsa la producción de aceite en olivos hasta un 24%, según investigación de soil o-live. Available from: https://www.oleorevista.com/texto-diario/mostrar/5215494/biochar-impulsa-produccion-aceite-olivos-hasta-24-segun-investigacion-soil-live [Last accessed on 11 Mar 2026].
69. Liu, Q.; Liu, B.; Zhang, Y.; et al. Biochar application as a tool to decrease soil nitrogen losses (NH3 volatilization, N2O emissions, and N leaching) from croplands: options and mitigation strength in a global perspective. Global. Chang. Biol. 2019, 25, 2077-93.
70. IPCC. 2019 Refinement to the 2006 IPCC guidelines for national greenhouse gas inventories. 2019. Available from: https://www.ipcc-nggip.iges.or.jp/EFDB/find_ef.php [Last accessed on 11 Mar 2026].
71. Domouso, P.; Calero, J.; Ruiz-Cátedra, G.; García-Ruiz, R. Nitrogen recycling across a spectrum of fertilization strategies: an assessment in olive groves. Agric. Ecosyst. Environ. 2024, 372, 109096.
72. Cameira, M.; Pereira, A.; Ahuja, L.; Ma, L. Sustainability and environmental assessment of fertigation in an intensive olive grove under Mediterranean conditions. Agric. Water. Manag. 2014, 146, 346-60.
73. Intergovernmental Panel on Climate Change. Appendix 4 method for estimating the change in mineral soil organic carbon stocks from biochar amendments: basis for future methodological development. 2019. Available from: https://www.ipcc-nggip.iges.or.jp/public/2019rf/pdf/4_Volume4/19R_V4_Ch02_Ap4_Biochar.pdf [Last accessed on 11 Mar 2026].
74. European Commission, Directorate-General for Climate Action. Support to the development of methodologies for the certification of industrial carbon removals with permanent storage: review of carbon removals through biochar. 2024. Available from: https://climate.ec.europa.eu/document/download/51aaaada-e29b-4bce-a34e-878d4d264846_en?filename=policy_carbon_expert_review_biochar_en.pdf [Last accessed on 11 Mar 2026].
75. Ballal, V.; Barbosa, Watanabe. M. D.; Gilardi, M.; et al. Influence of wood resource types, conversion technologies, and plant size on the climate benefits and costs of advanced biofuels for aviation, shipping and heavy-duty transport. Energy. Convers. Manag. 2025, 327, 119586.
76. Internation Renewable Energy Agency. Renewable power generation costs in 2023. 2024. Available from: https://www.irena.org/-/media/Files/IRENA/Agency/Publication/2024/Sep/IRENA_Renewable_power_generation_costs_in_2023.pdf [Last accessed on 11 Mar 2026].
77. Ministerio para la Transición Ecológica y el Reto Demográfico. Estrategia a largo plazo para una economía española moderna, competitiva y climáticamente neutra en 2050. 2020. Available from: https://www.miteco.gob.es/content/dam/miteco/es/cambio-climatico/planes-y-estrategias/ELP_2050.pdf [Last accessed on 11 Mar 2026].
78. Cerdà, A.; Terol, E.; Daliakopoulos, I. N. Weed cover controls soil and water losses in rainfed olive groves in Sierra de Enguera, eastern Iberian Peninsula. J. Environ. Manag. 2021, 290, 112516.
79. Junta de Andalucia. Consejeria de Sostenibilidad, Medio Ambiente y Economía Azul. Inventario Andaluz de Emisiones de Gases de Efecto Invernadero 2023. 2024. Available from: https://www.juntadeandalucia.es/medioambiente/portal/web/cambio-climatico/mitigacion/inventario-emisiones-gei/1990-2022 [Last accessed on 11 Mar 2026].
80. Qian, S.; Zhou, X.; Fu, Y.; et al. Biochar-compost as a new option for soil improvement: Application in various problem soils. Sci. Total. Environ. 2023, 870, 162024.
81. Ministerio de Agricultura, Pesca y Alimentación. Plan estratégico de la PAC de españa (PEPAC) - Documento 33. 2025. Available from: https://www.mapa.gob.es/dam/mapa/contenido/reforma-de-la-pac/plan-estrategico-pac-post-2020/documentos/pepac-33.pdf [Last accessed on 11 Mar 2026].
82. Krexner, T.; Bauer, A.; Gronauer, A.; Mikovits, C.; Schmidt, J.; Kral, I. Environmental life cycle assessment of a stilted and vertical bifacial crop-based agrivoltaic multi land-use system and comparison with a mono land-use of agricultural land. Renew. Sustain. Energy. Rev. 2024, 196, 114321.
83. Müller, A.; Friedrich, L.; Reichel, C.; Herceg, S.; Mittag, M.; Neuhaus, D. H. A comparative life cycle assessment of silicon PV modules: impact of module design, manufacturing location and inventory. Sol. Energy. Mater. Sol. Cells. 2021, 230, 111277.
84. Smith, B.; Sekar, A.; Mirletz, H.; Heath, G.; Margolis, R. An updated life cycle assessment of utility-scale solar photovoltaic systems installed in the United States. 2024.
85. Trends in photovoltaic applications 2025. 2025. Available from: www.iea-pvps.org [Last accessed on 11 Mar 2026].
86. Agencia Andaluza de la Energía. La Biomasa en Andalucía. 2020. Available from: https://www.agenciaandaluzadelaenergia.es/sites/default/files/Documentos/3_2_0068_20_LA_BIOENERGIA_EN_ANDALUCIA.PDF [Last accessed on 11 Mar 2026].
87. Li, Y.; Yang, J.; Yang, M.; Zhang, F. Exploring biochar addition impacts on soil erosion under natural rainfall: a study based on four years of field observations on the Loess Plateau. Soil. Tillage. Res. 2024, 236, 105935.
88. Smart, P. V. solar. tracker. solutions. Available from: https://www.solargik.com/ [Last accessed on 11 Mar 2026].
89. A Flexibility Strategy for the EU. A trengthening the grid with batteries and demand response. 2023. Available from: https://api.solarpowereurope.org/uploads/Position_Paper_Flexibility_strengthening_the_grid_with_storage_and_demand_response_Augusto_eb67f28c09.pdf [Last accessed on 11 Mar 2026].
90. Redeia. Actuación de Red Eléctrica ante el incidente del 28 de abril. Red Eléctrica. 2025. Available from: https://www.ree.es/es/sala-de-prensa/actualidad/nota-de-prensa/2025/04/proceso-de-recuperacion-de-la-tension-en-el-sistema-electrico-peninsular [Last accessed on 11 Mar 2026].
91. Graham, M.; Ates, S.; Melathopoulos, A. P.; et al. Partial shading by solar panels delays bloom, increases floral abundance during the late-season for pollinators in a dryland, agrivoltaic ecosystem. Sci. Rep. 2021, 11, 7452.
92. Khazael, S. M.; Abdul, Maulud. K. N.; A,
93. Ministerio de Agricultura, Pesca y Alimentation. Informe prospectivo sobre la situacion de la energía agrivoltaica. 2023. Available from: https://rb.gy/gfgwk7 [Last accessed on 11 Mar 2026].
94. Meyer, S.; Bright, R. M.; Fischer, D.; Schulz, H.; Glaser, B. Albedo impact on the suitability of biochar systems to mitigate global warming. Environ. Sci. Technol. 2012, 46, 12726-34.
95. Genesio, L.; Miglietta, F.; Lugato, E.; Baronti, S.; Pieri, M.; Vaccari, F. P. Surface albedo following biochar application in durum wheat. Environ. Res. Lett. 2012, 7, 014025.
96. Wei, S.; Ziegler, A. D.; Qin, Y.; et al. Small reduction in land surface albedo due to solar panel expansion worldwide. Commun. Earth. Environ. 2024, 5, 474.
97. CORC carbon removal indexes. 2025. Available from: https://puro.earth/corc-carbon-removal-indexes [Last accessed on 11 Mar 2026].
98. Gawith, D.; Hodge, I. Focus rural land policies on ecosystem services, not agriculture. Nat. Ecol. Evol. 2019, 3, 1136-9.
Cite This Article
How to Cite
Download Citation
Export Citation File:
Type of Import
Tips on Downloading Citation
Citation Manager File Format
Type of Import
Direct Import: When the Direct Import option is selected (the default state), a dialogue box will give you the option to Save or Open the downloaded citation data. Choosing Open will either launch your citation manager or give you a choice of applications with which to use the metadata. The Save option saves the file locally for later use.
Indirect Import: When the Indirect Import option is selected, the metadata is displayed and may be copied and pasted as needed.
About This Article
Special Topic
Copyright

Data & Comments
Data
0


Comments
Comments must be written in English. Spam, offensive content, impersonation, and private information will not be permitted. If any comment is reported and identified as inappropriate content by OAE staff, the comment will be removed without notice. If you have any queries or need any help, please contact us at [email protected].