



fig12
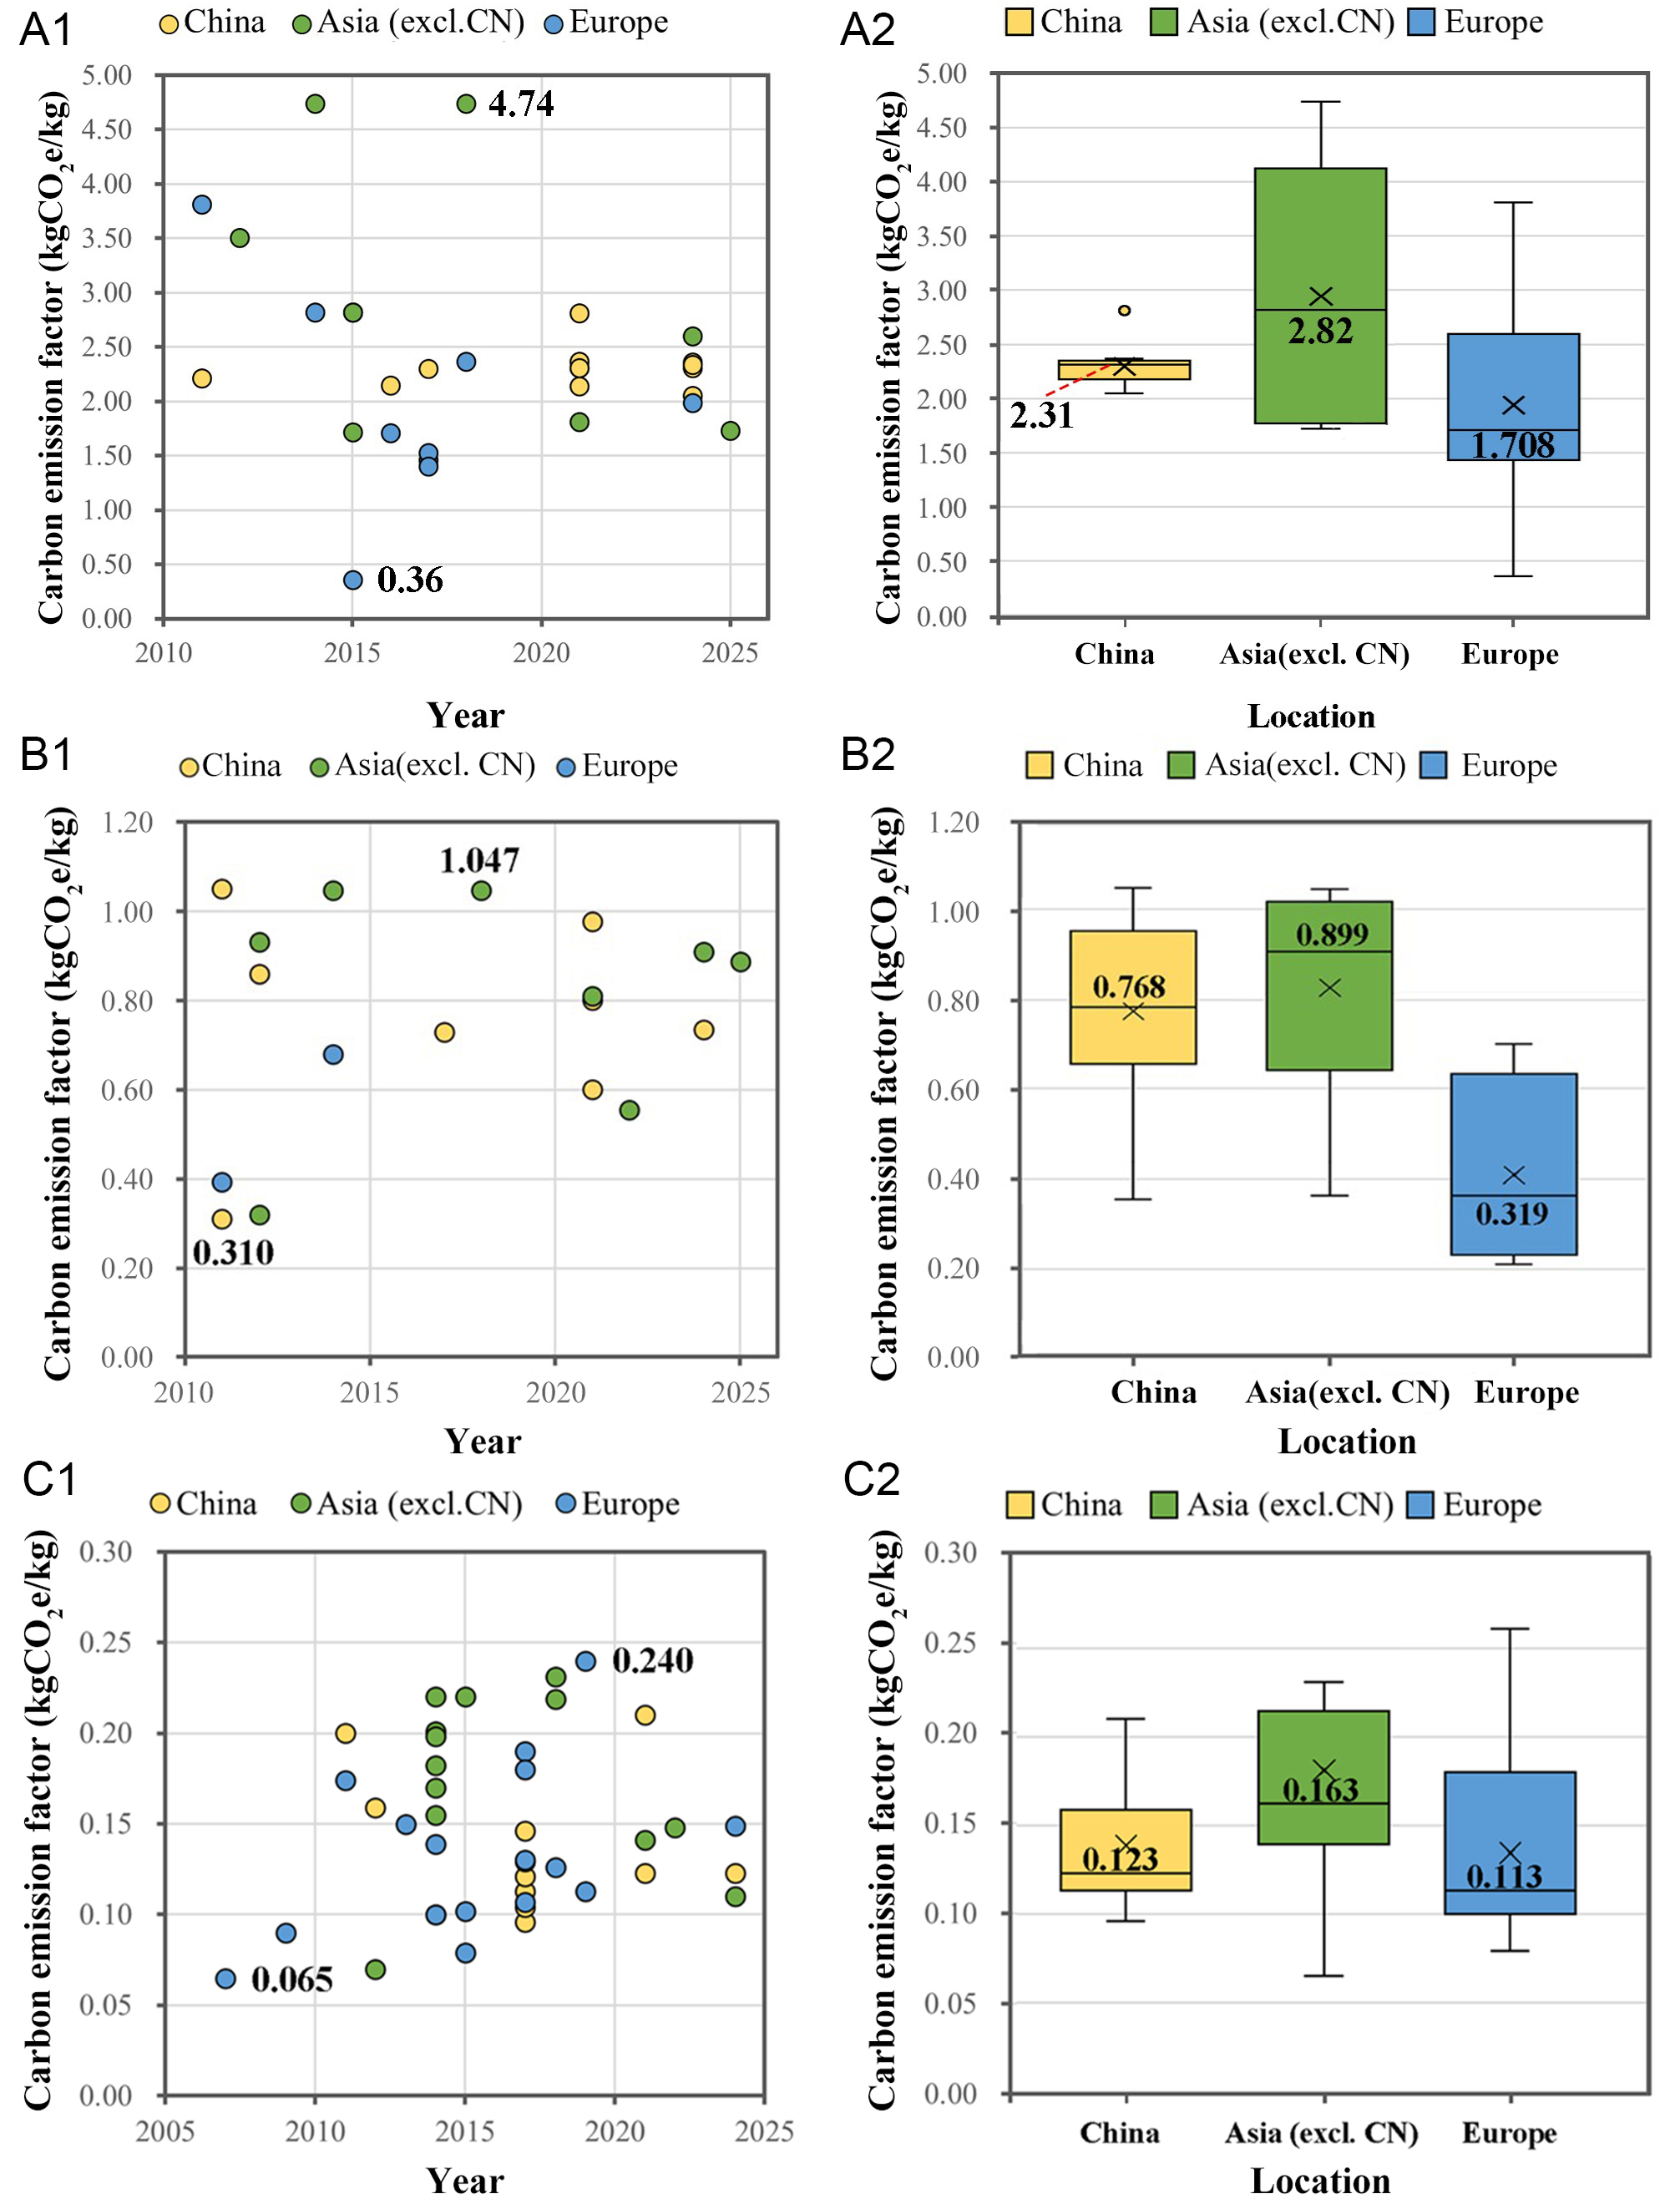
Figure 12. CEF of steel, cement, and concrete used in the reviewed case studies. The box range represents the interquartile range(Q1-Q3), the horizontal line inside the box indicates the median, and the cross symbol (×) denotes the mean value. The sample sizes for (A), (B), and (C) were 32, 18, and 42, respectively. (A1) Distribution of all results, (A2) Quartile plot; (B1) Distribution of all results, (B2) Quartile plot; (C1) Distribution of all results, (C2) Quartile plot.





