

fig4
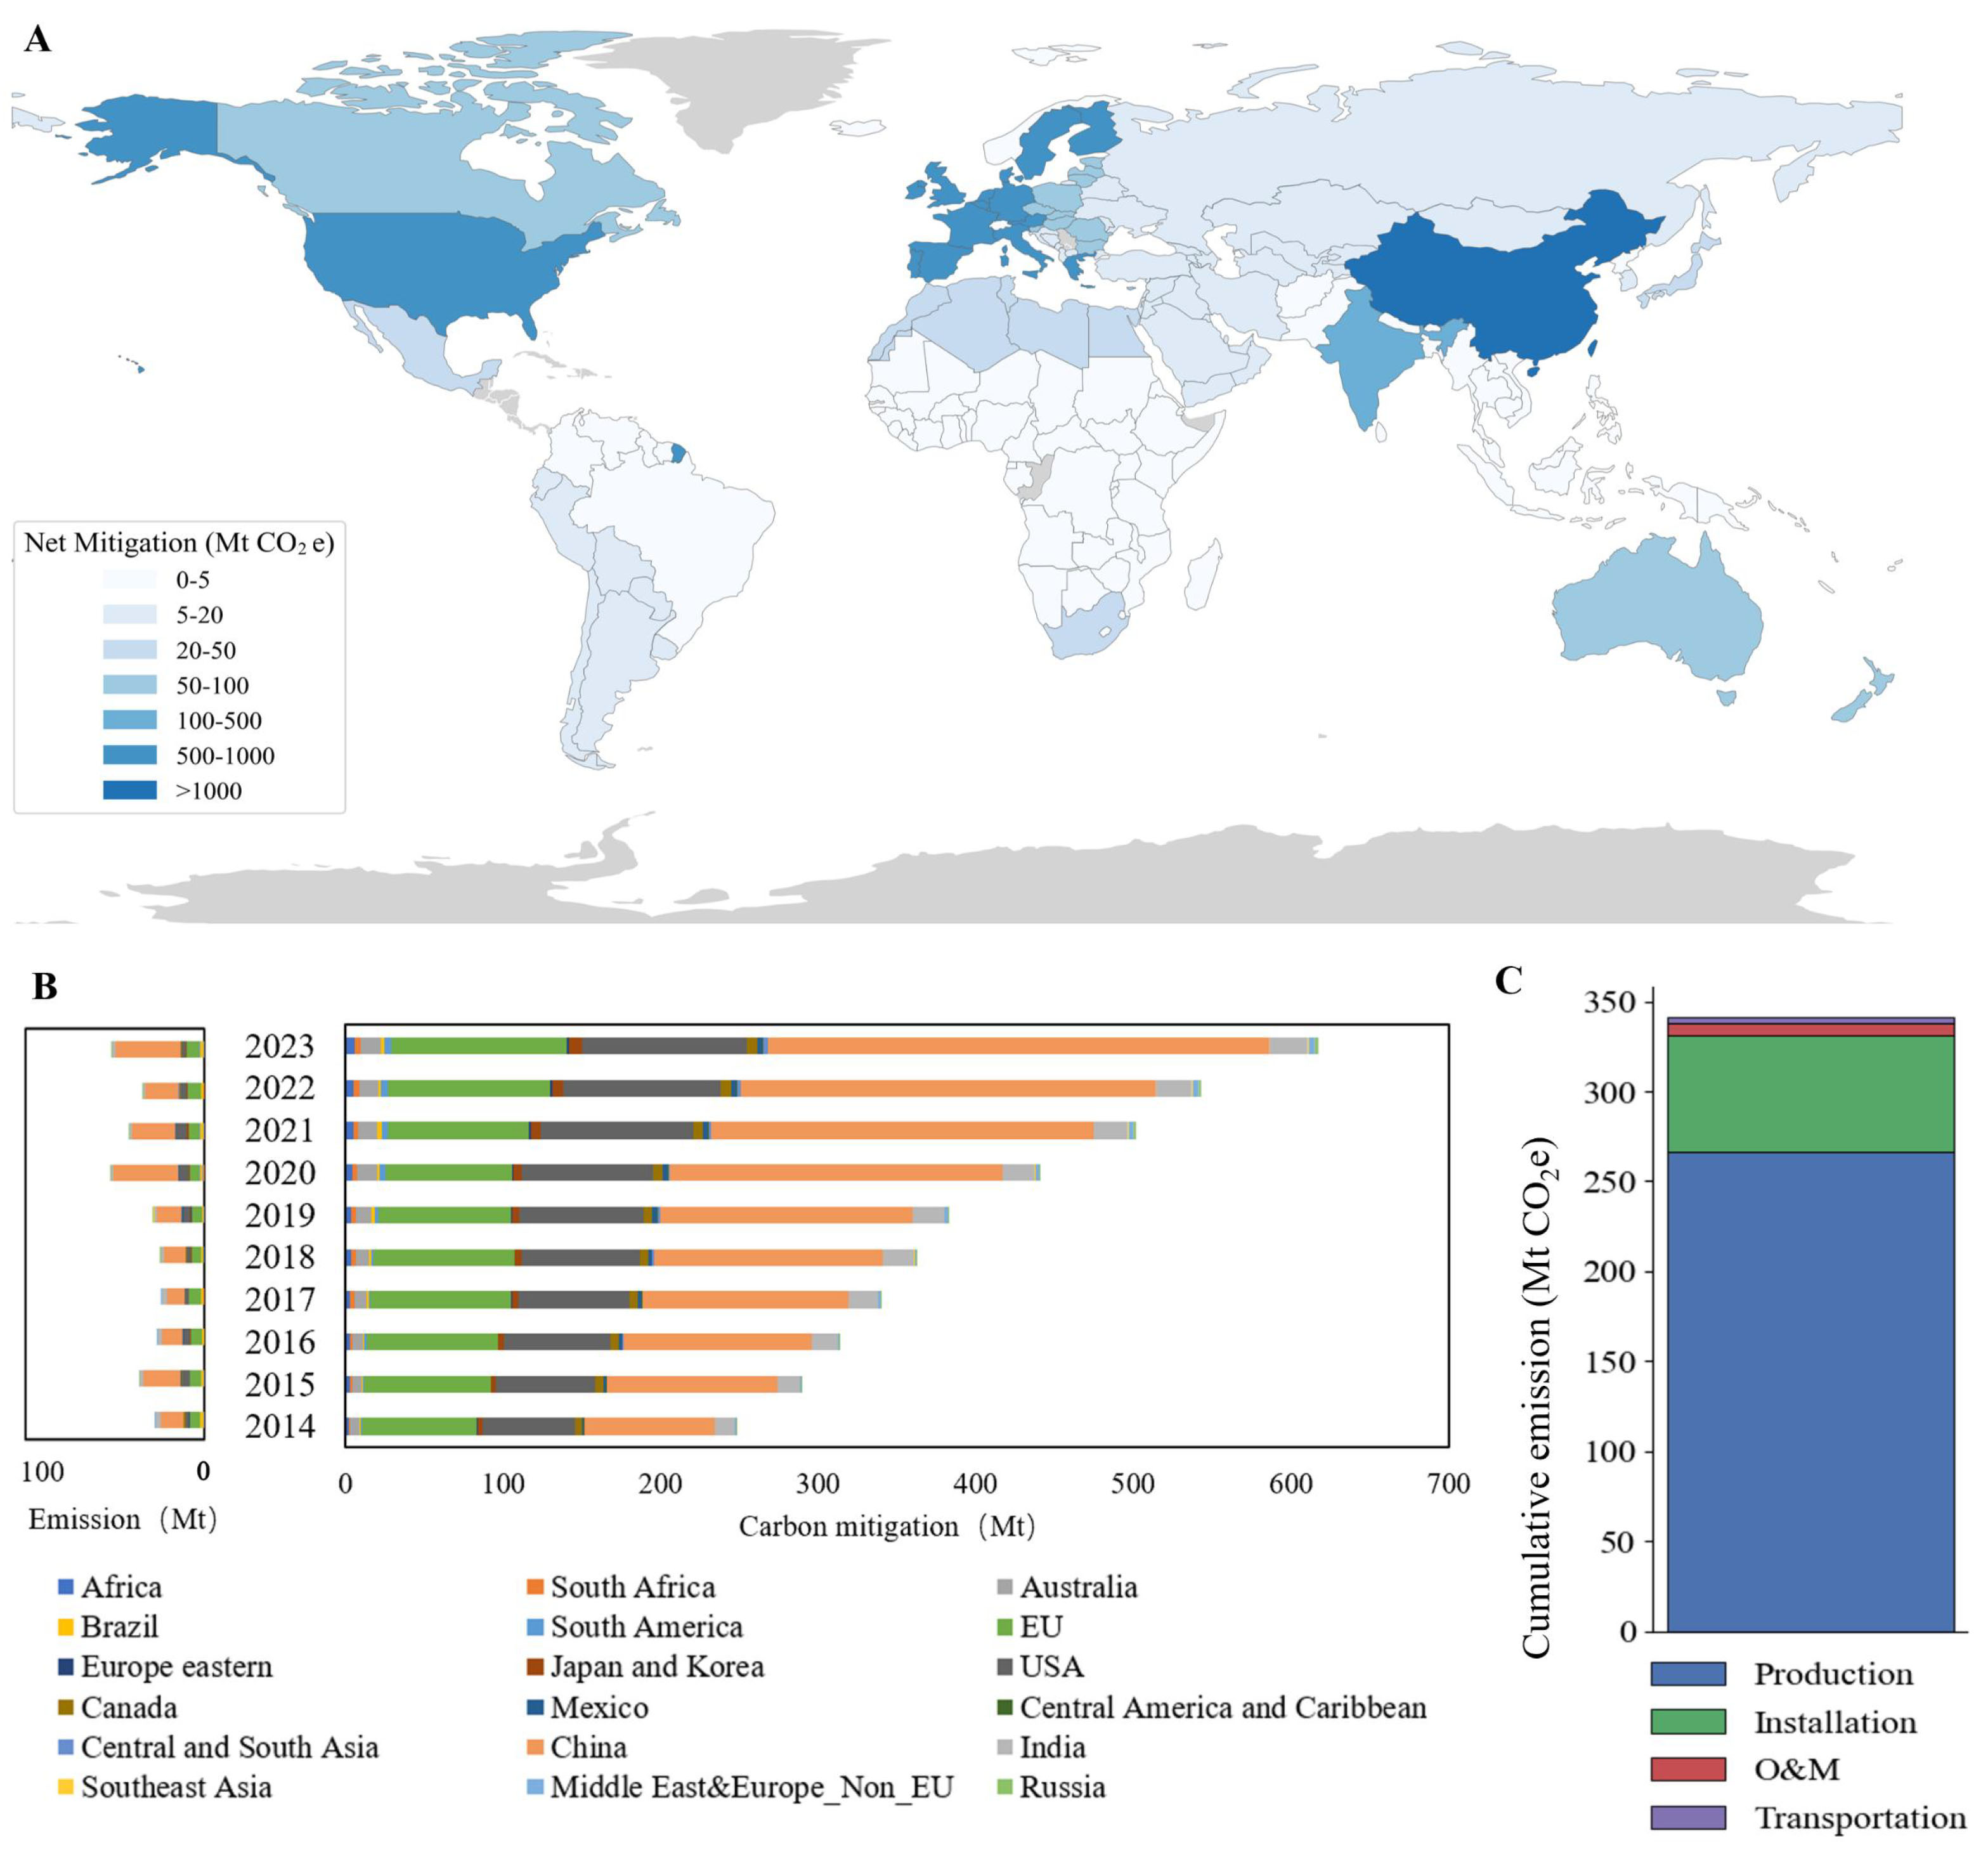
Figure 4. Global distribution of wind power carbon emissions and mitigation benefits during 2014-2023. (A) Global net carbon mitigation benefits across regions, with gray regions indicating the absence of data; (B) Regional comparison of net carbon mitigation benefits and life cycle carbon emissions from 2014 to 2023; (C) Carbon emissions by stage in the life cycle of the wind system. The country boundary data are obtained from the Folium example GeoJSON dataset (https://raw.githubusercontent.com/python-visualization/folium/master/examples/data/world-countries.json).





