

fig1
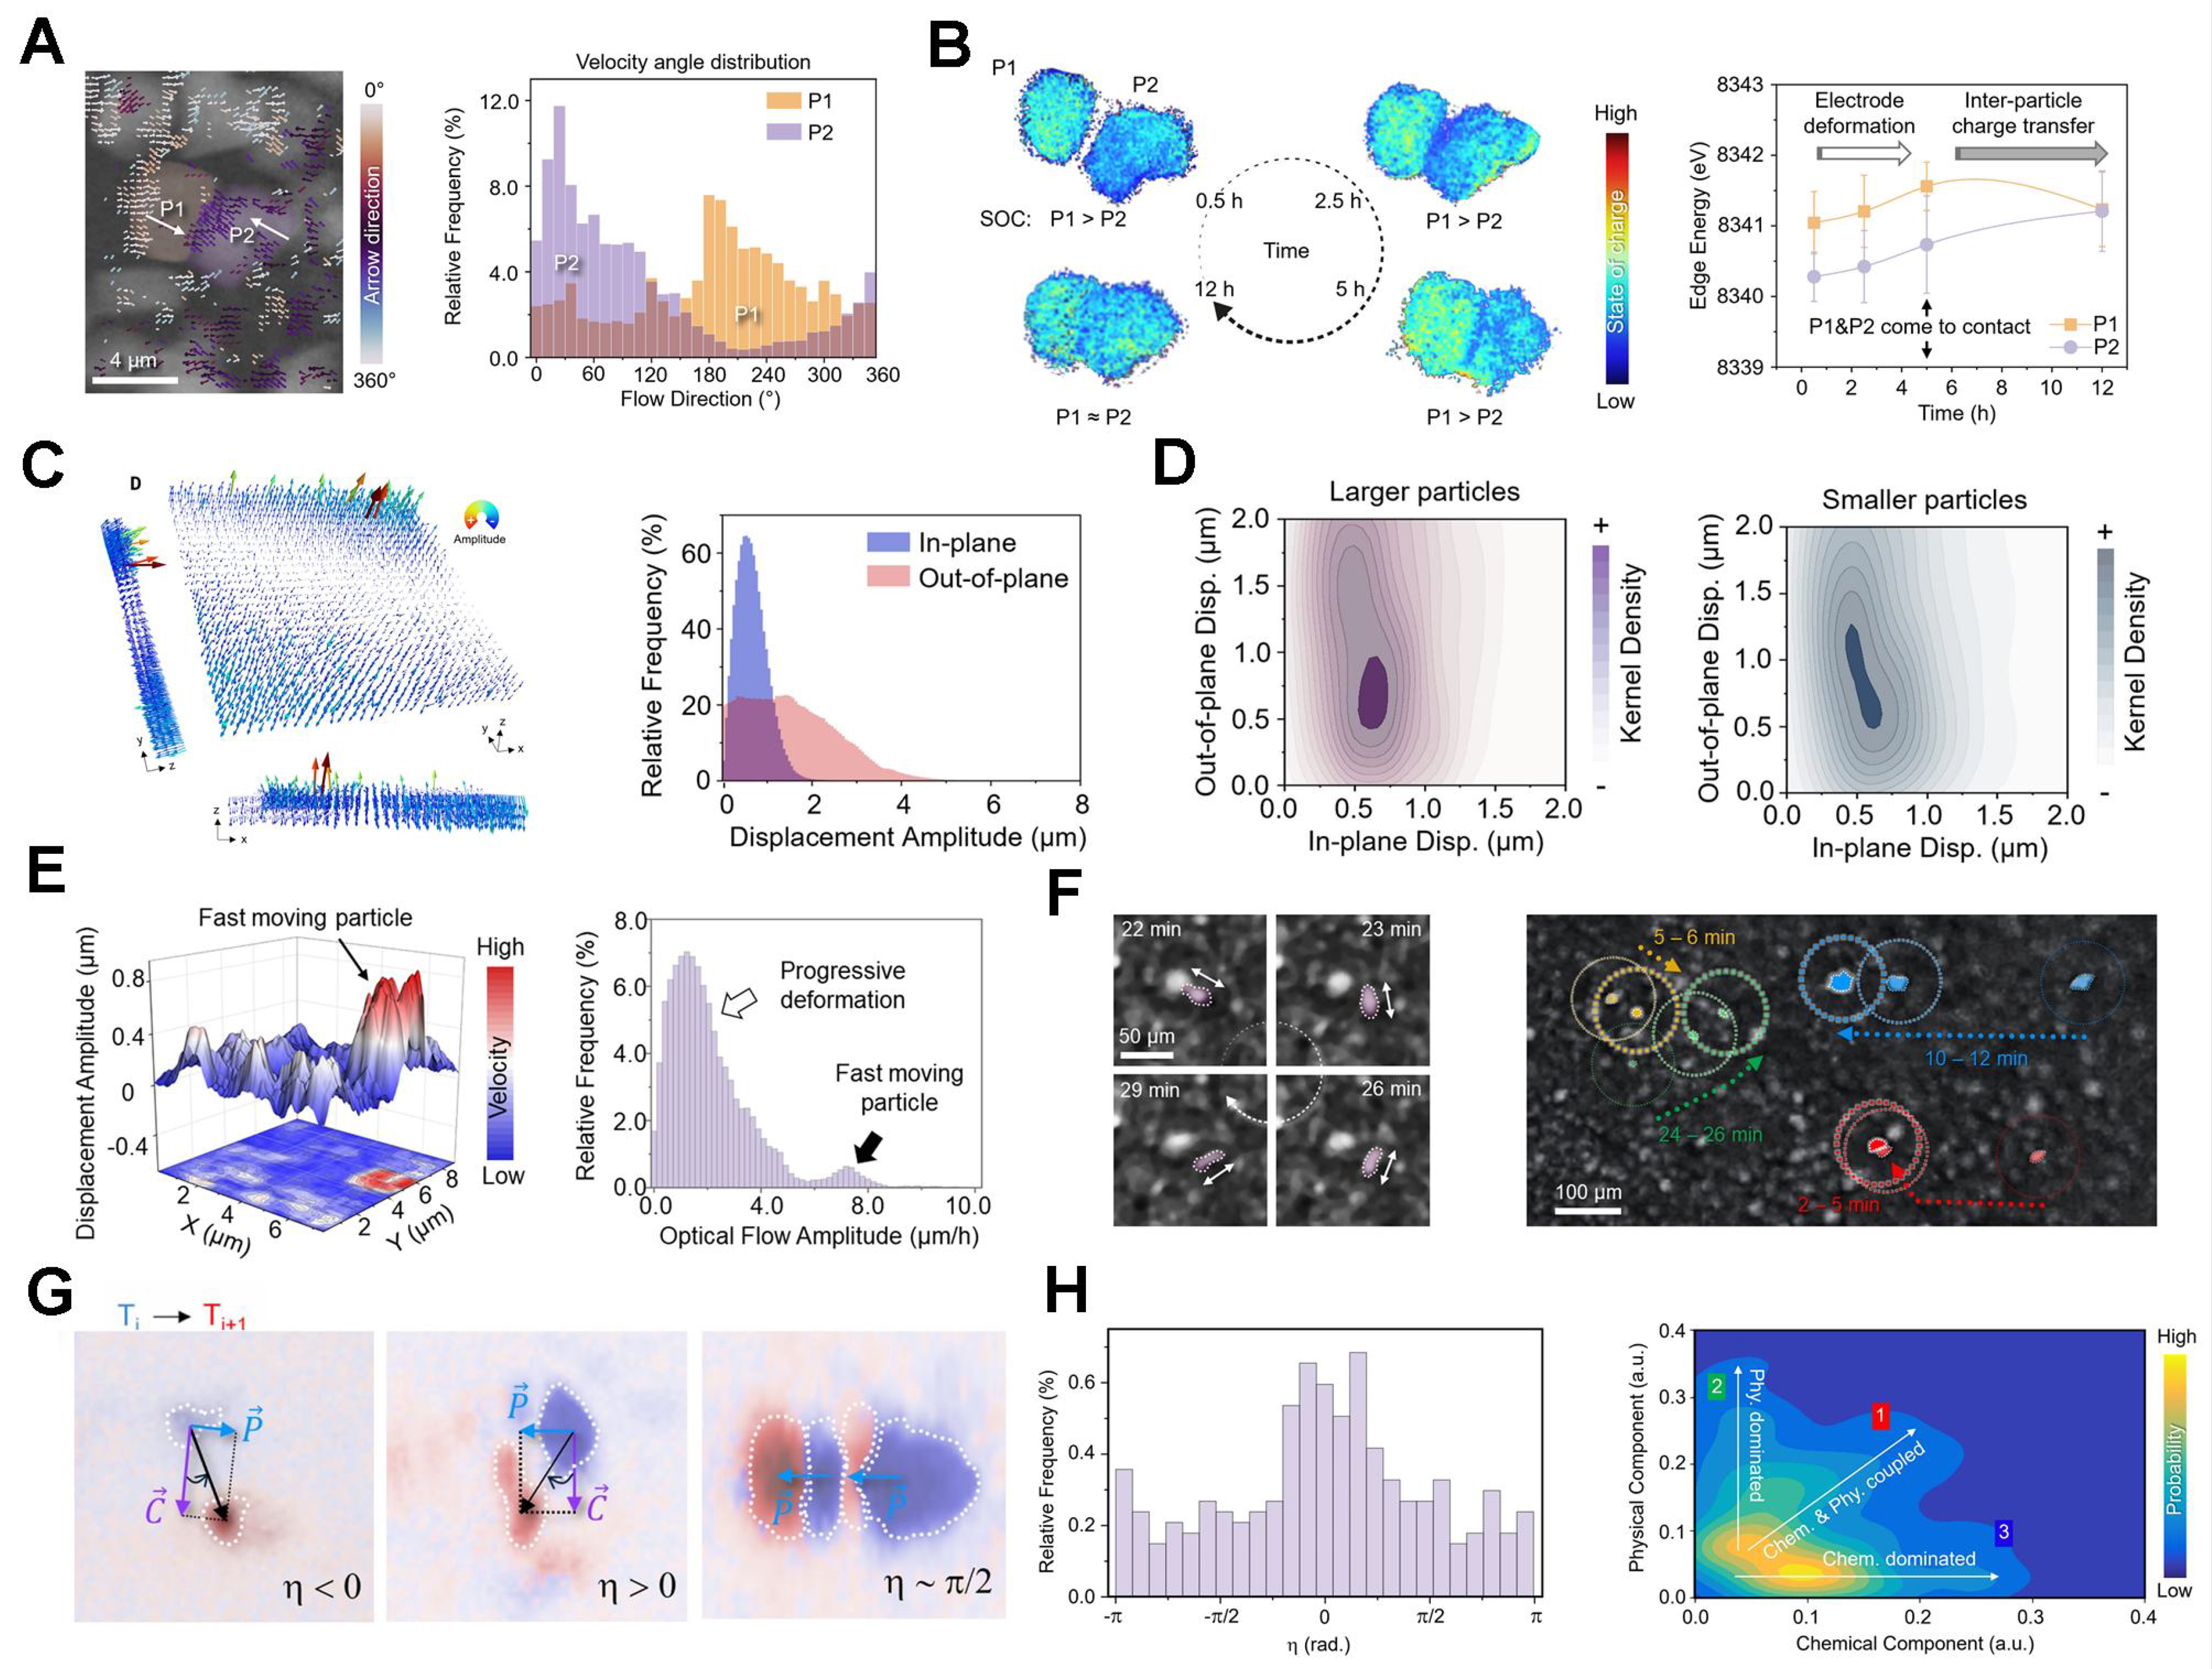
Figure 1. (A) Optical flow analysis of particle motion and probability distribution of local velocity angles in particles P1 and P2; (B) TXM-based SOC mapping using Ni K-edge energy, along with the evolution of the mean value and standard deviation of Ni K-edge energy in particles P1 and P2; (C) Visualization of electrode strain and probability distributions of the in-plane and out-of-plane components of the deformation field; (D) Kernel density distributions for larger and smaller particles; (E) Amplitude of particle lateral displacement and probability distributions of displacement amplitudes; (F) Localized particle rotation observed via in situ optical microscopy, along with optical imaging of randomly occurring irregular particle movements; (G) Selected Bragg peaks exhibiting different chemomechanical behaviors during cell cycling; (H) Probability distribution of η for all captured Bragg peaks and scatter plot of Bragg peak displacements. Adapted with permission Ref.[6]. Copyright 2025, American Association for the Advancement of Science. TXM: Transmission X-ray microscopy; SOC: state-of-charge.


