

fig1
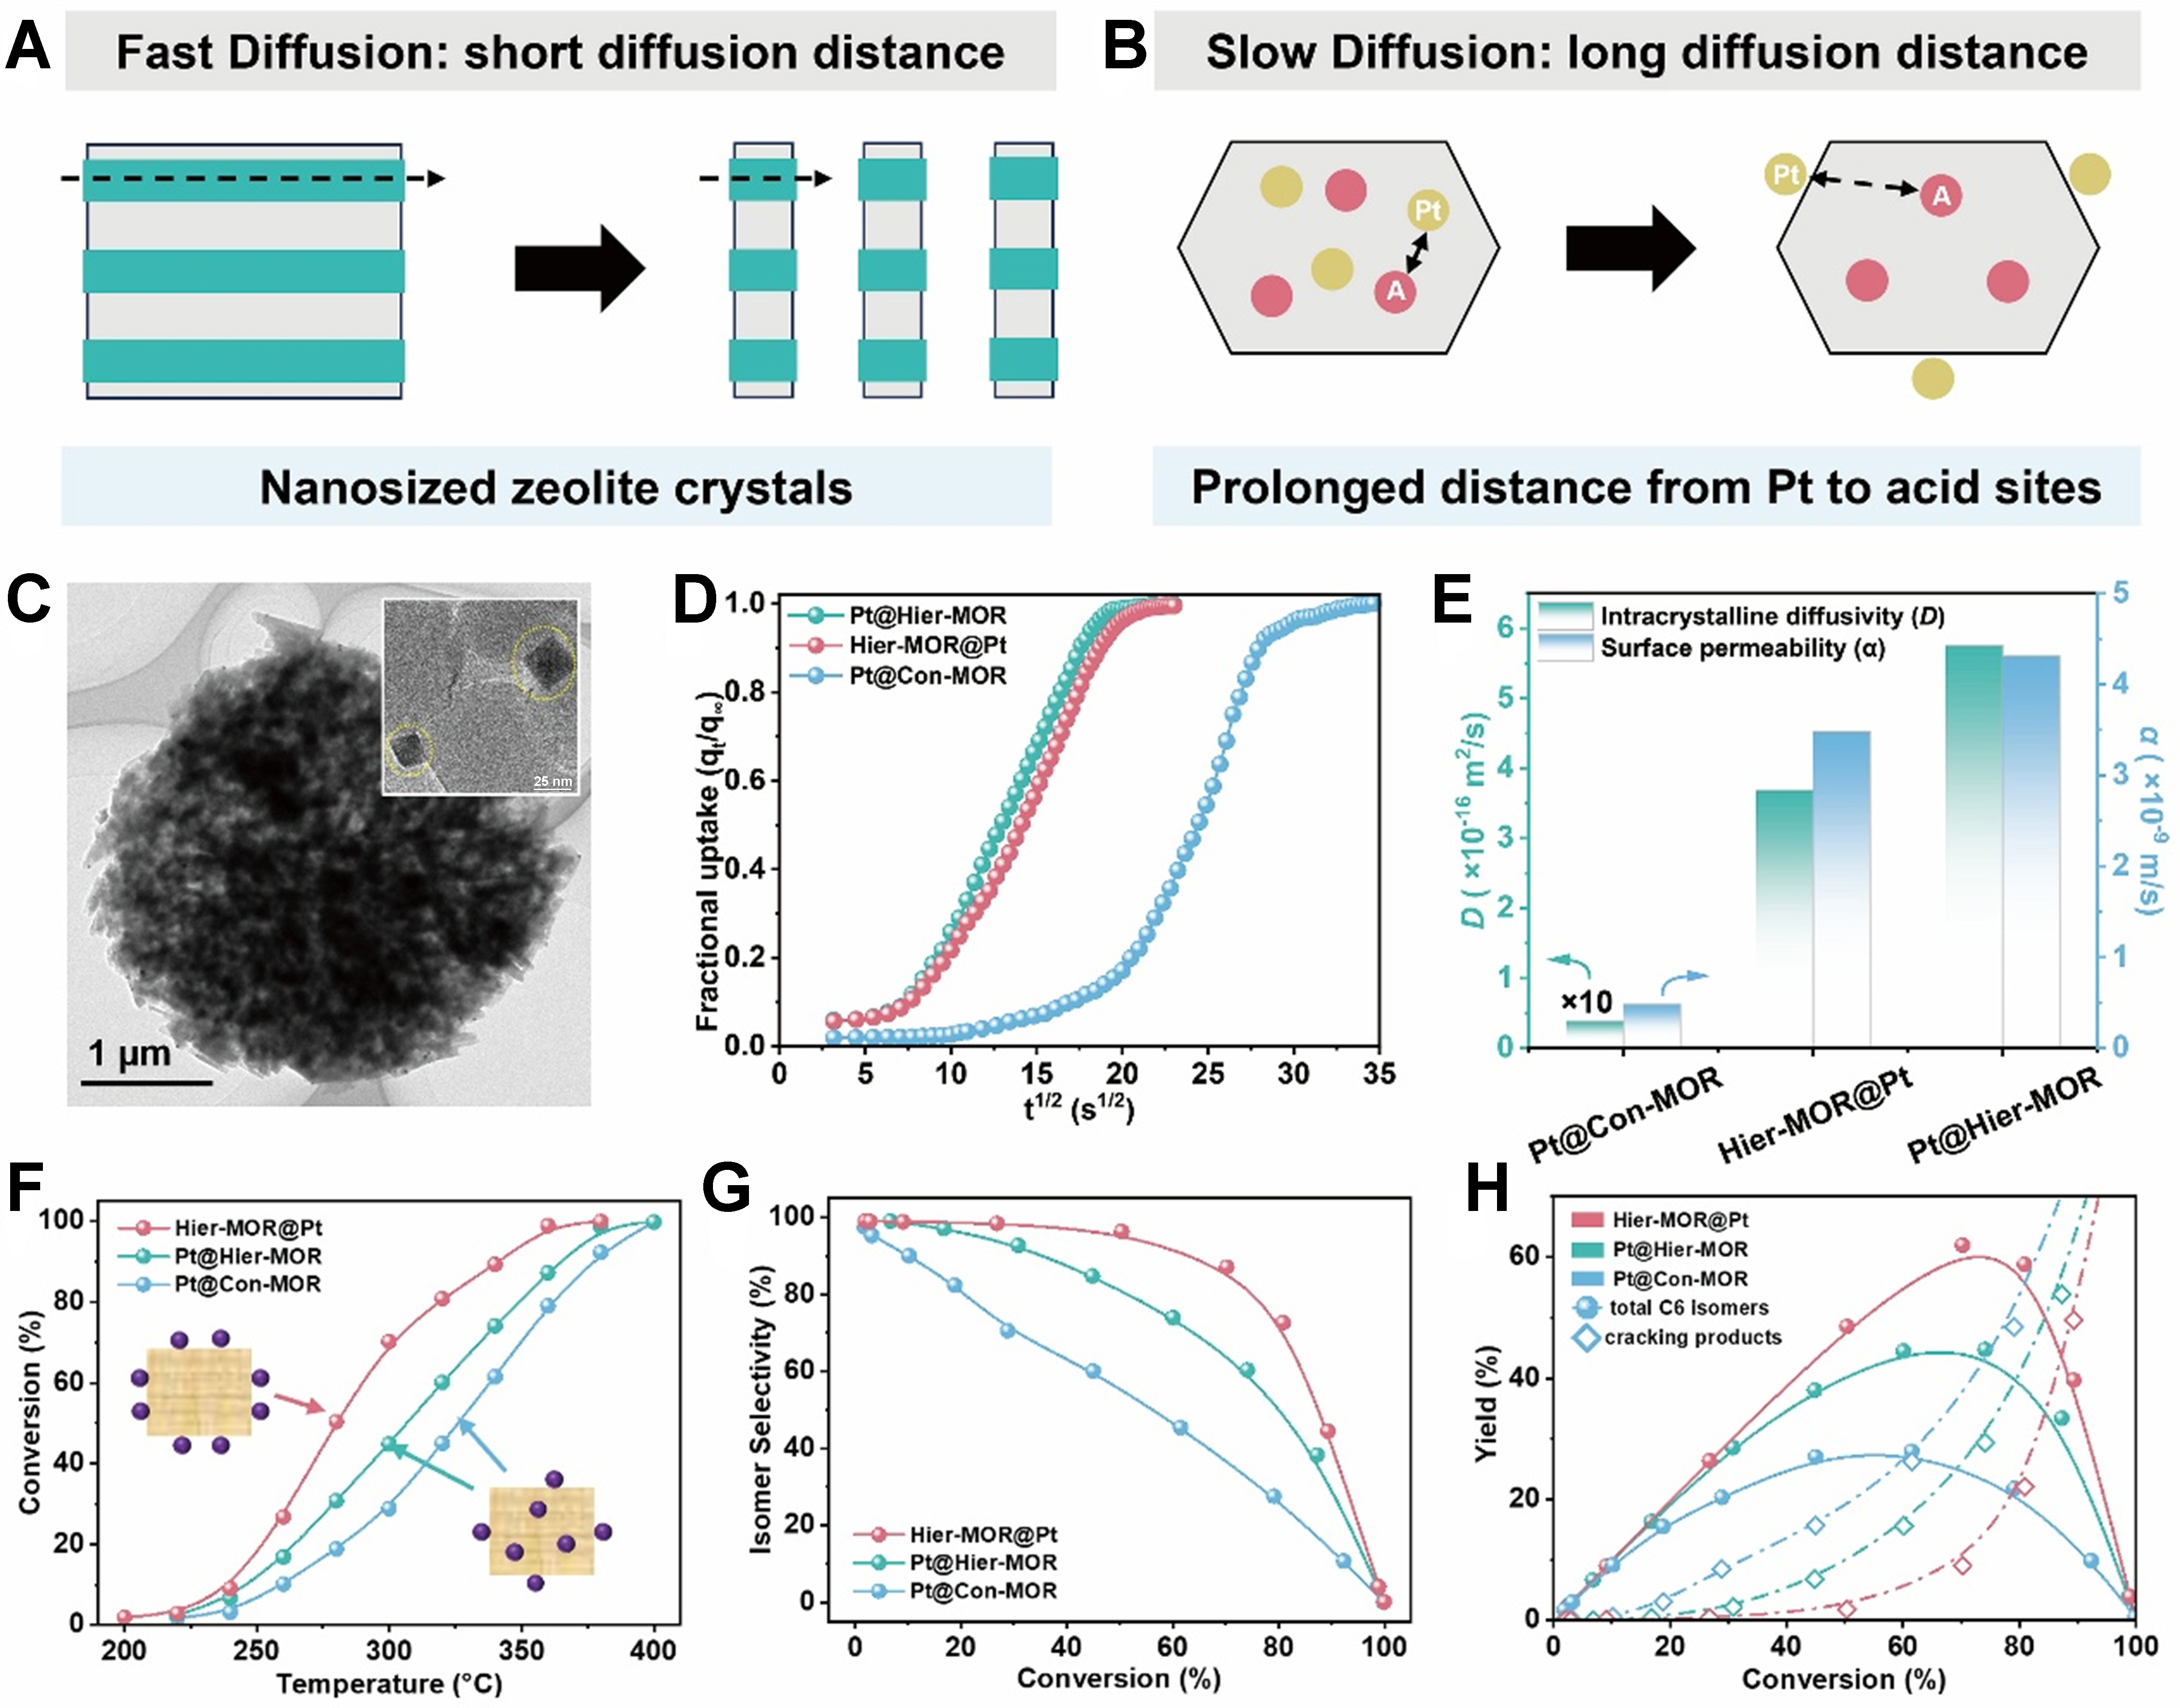
Figure 1. (A and B) Illustration of diffusion demands in hydroisomerization and corresponding strategies; (C) Transmission electron microscopy image of a MOR nanorod assembly (inset: external Pt nanoparticles); (D) Overall evolution of the normalized fluorescence intensity (qt/q∞) as a function of the square root of time; (E) Comparison of diffusion coefficients (D) and surface permeability (α) among samples; (F) n-Hexane conversion as a function of reaction temperature. The purple ball represents the platine (Pt) nanoparticules; (G) C6 isomer selectivity as a function of n-hexane conversion; (H) C6 isomer yield as a function of n-hexane conversion. The figure is reproduced from Ref.[11], Copyright 2026 Wiley-VCH GmbH. MOR: Mordenite Zeolite.


