


fig1
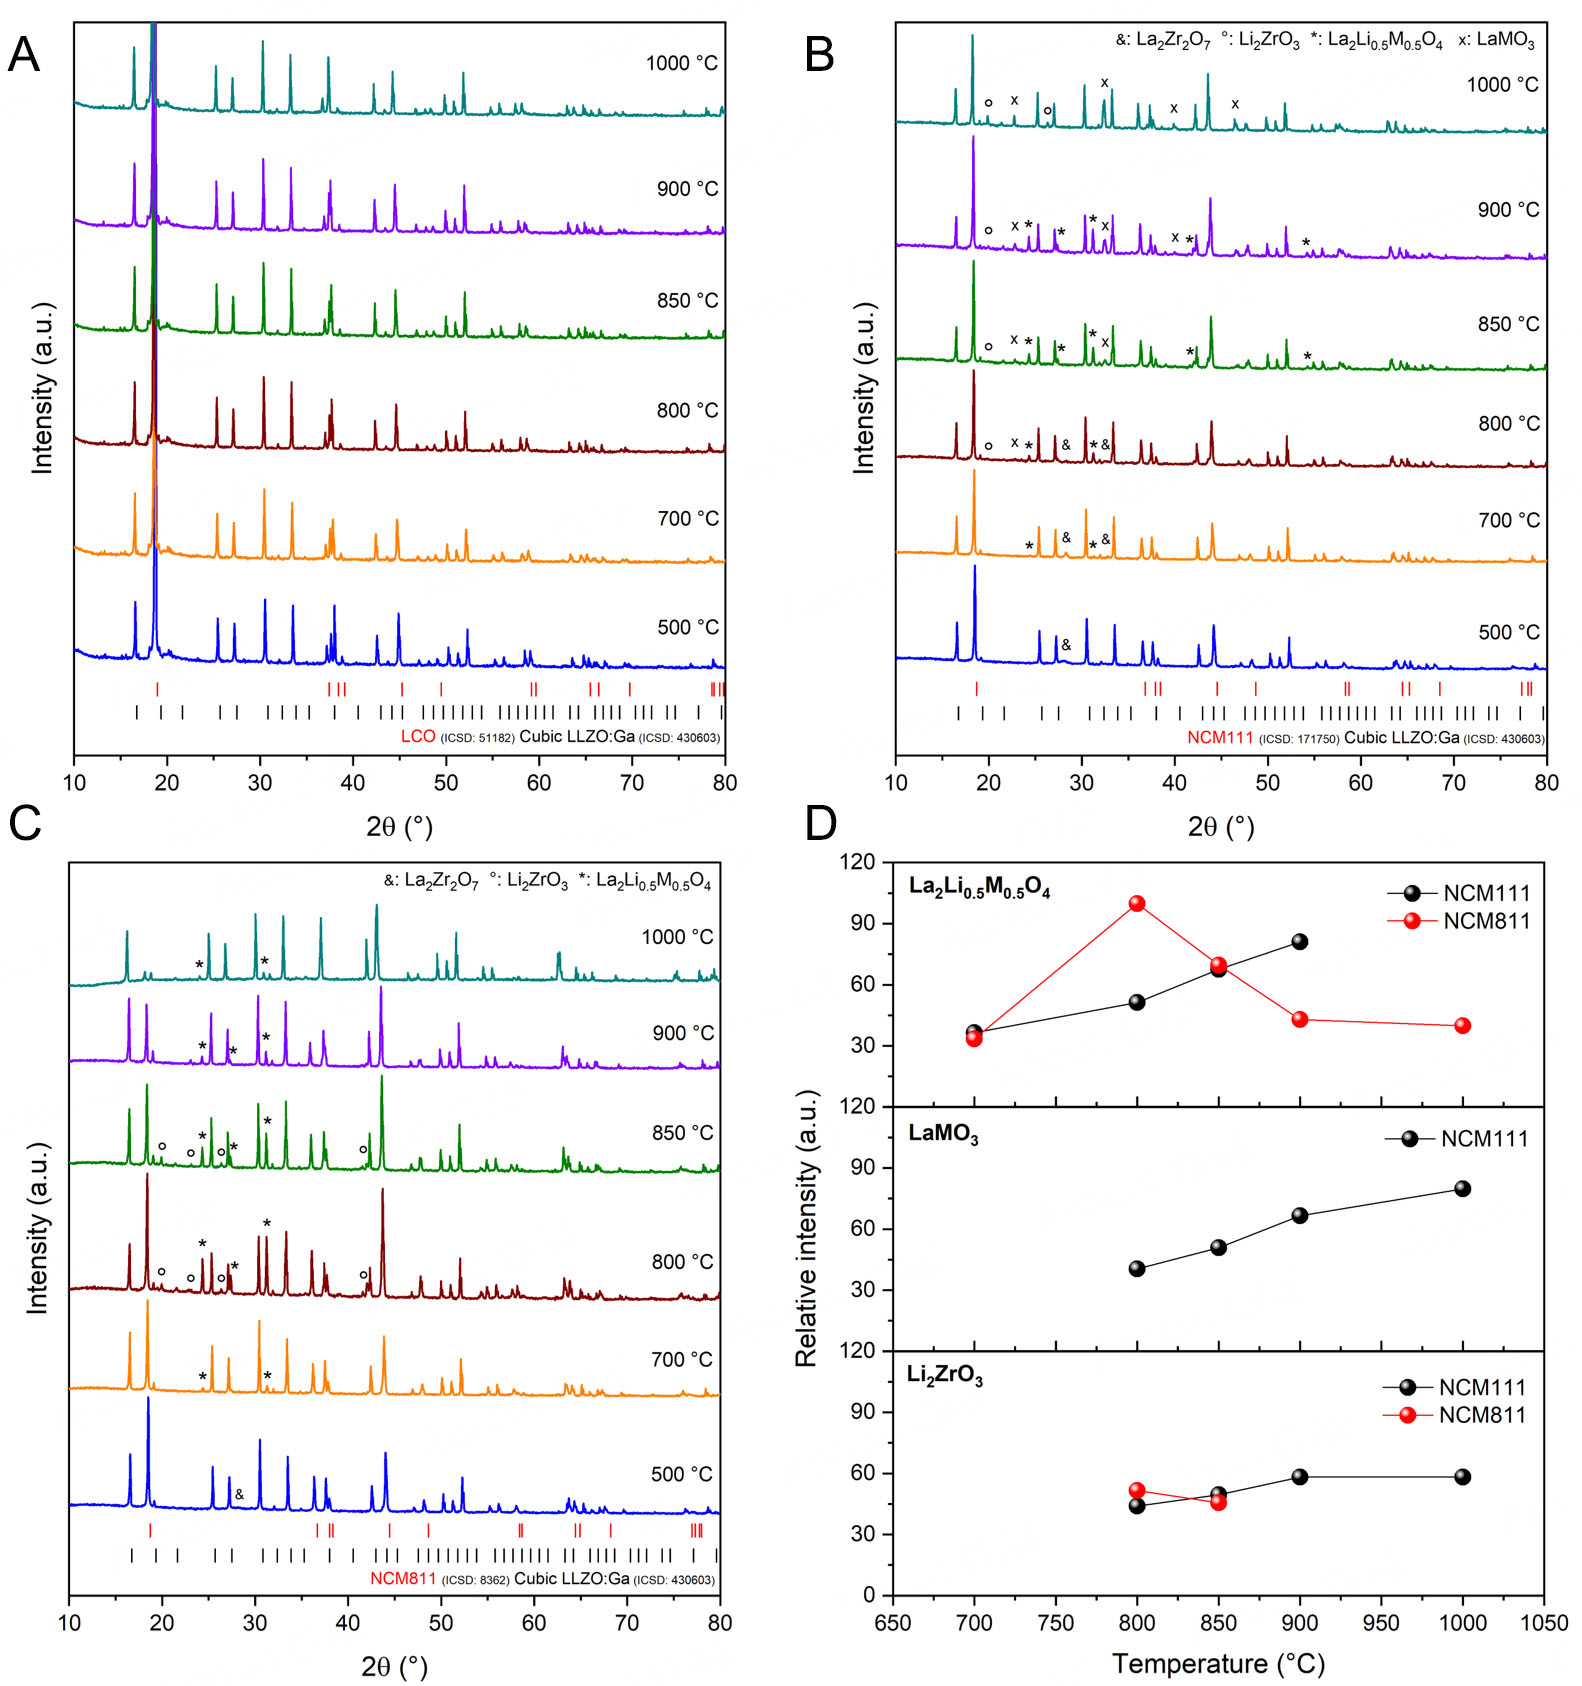
Figure 1. In situ HT-XRD patterns for 1:1 mixtures of cubic LLZO:Ga with (A) LCO, (B) NCM111, and (C) NCM811. Only selected temperatures are shown. Diffractions attributed to the pyrochlore or secondary phases are labeled accordingly. Due to thermal expansion at elevated temperatures, the Bragg peak positions are shifted slightly in comparison to the reference pattern for LCO, NCM111, NCM811, and cubic LLZO:Ga. (D) Relative intensities of the secondary phase reflections of Li2ZrO3 (110) at ~19.9° 2θ, La2(M0.5Li0.5)O4 reflection (131) at ~31.3° 2θ, and


