


fig6
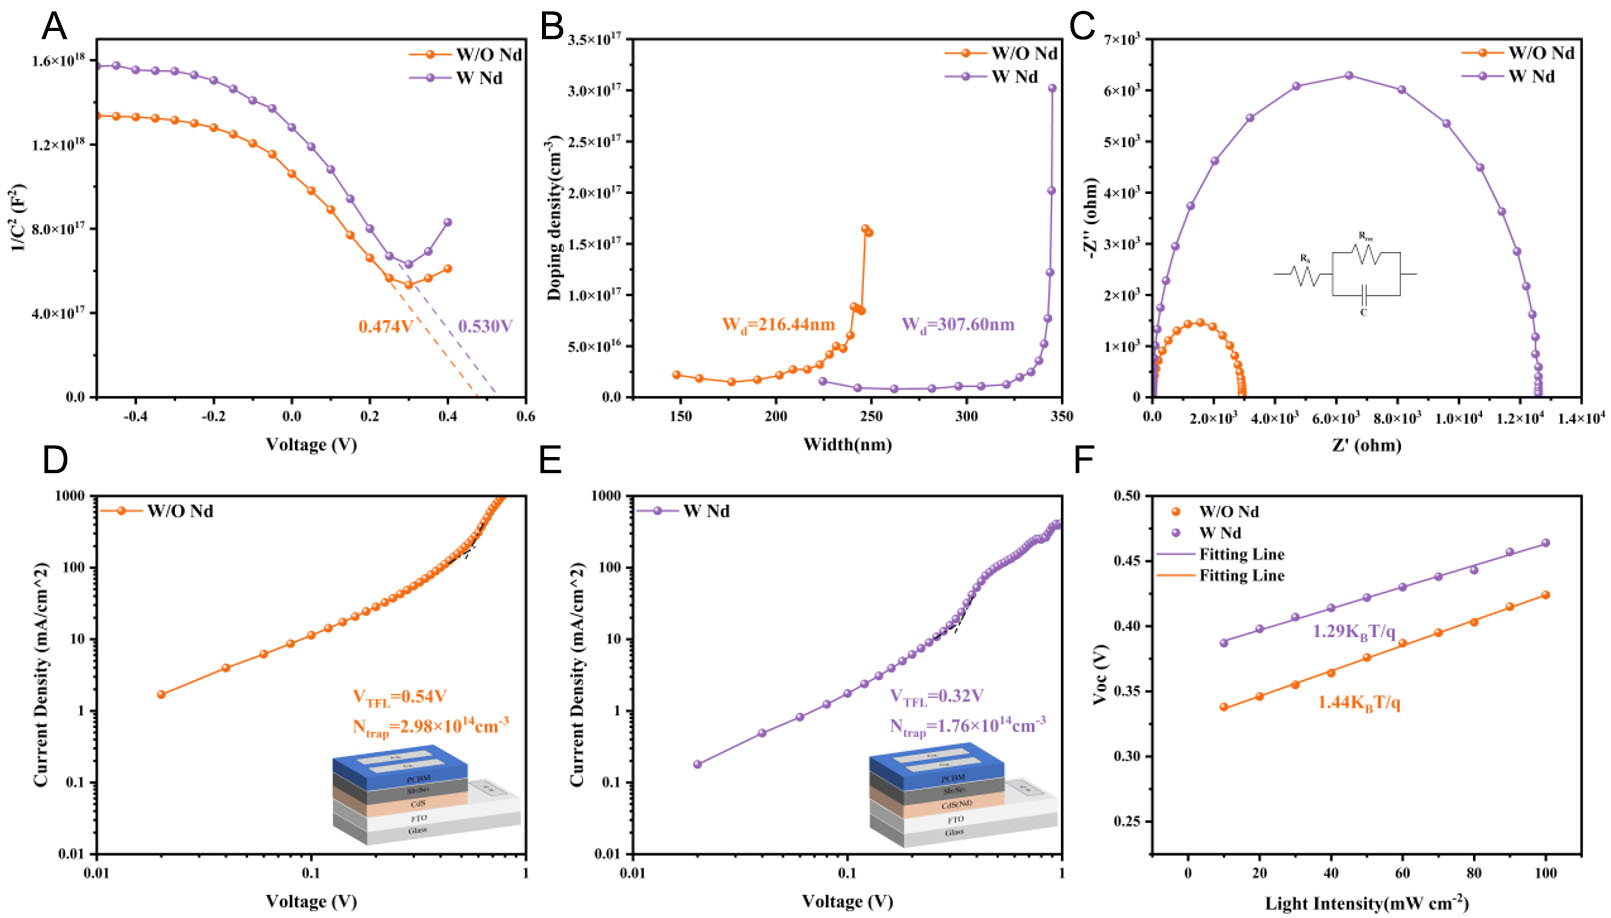
Figure 6. (A) Mott-Schottky plots (1/C2-V), (B) NC-V curves, (C) Nyquist plots, (D and E) space-charge-limited current (SCLC) measurements of W/O and W Nd samples, (F) light-intensity dependence of VOC.
Figure 6. (A) Mott-Schottky plots (1/C2-V), (B) NC-V curves, (C) Nyquist plots, (D and E) space-charge-limited current (SCLC) measurements of W/O and W Nd samples, (F) light-intensity dependence of VOC.


All published articles are preserved here permanently:
https://www.portico.org/publishers/oae/


