


fig7
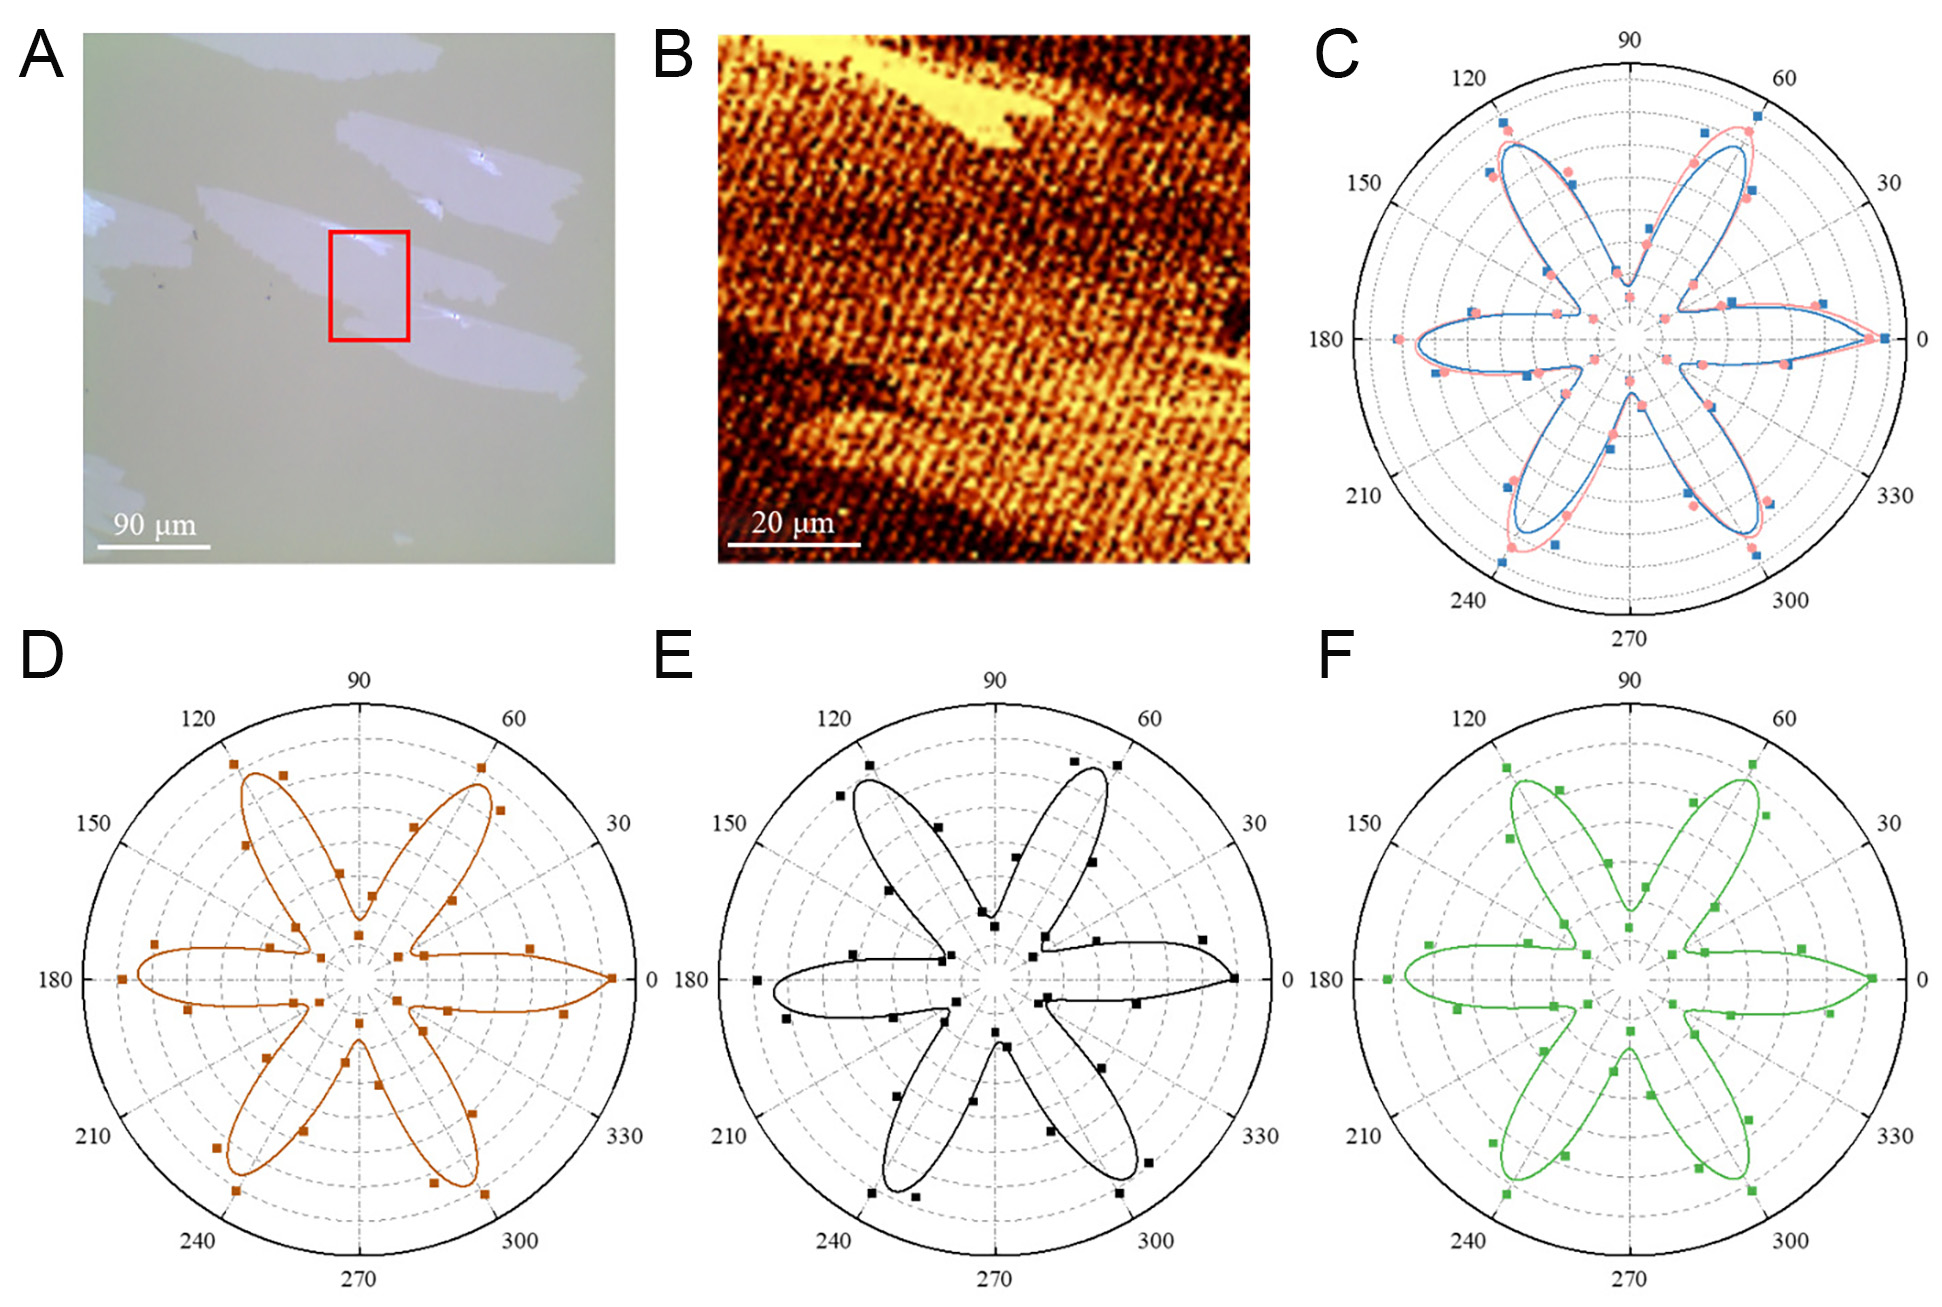
Figure 7. (A) OM image of two merging MoS2 domains. (B) SHG mapping of two merging MoS2 domains in the red region in (A). (C-F) Polar plot (°) of the SHG intensity of five MoS2 grains on the same substrate.
Figure 7. (A) OM image of two merging MoS2 domains. (B) SHG mapping of two merging MoS2 domains in the red region in (A). (C-F) Polar plot (°) of the SHG intensity of five MoS2 grains on the same substrate.


All published articles are preserved here permanently:
https://www.portico.org/publishers/oae/

