


fig4
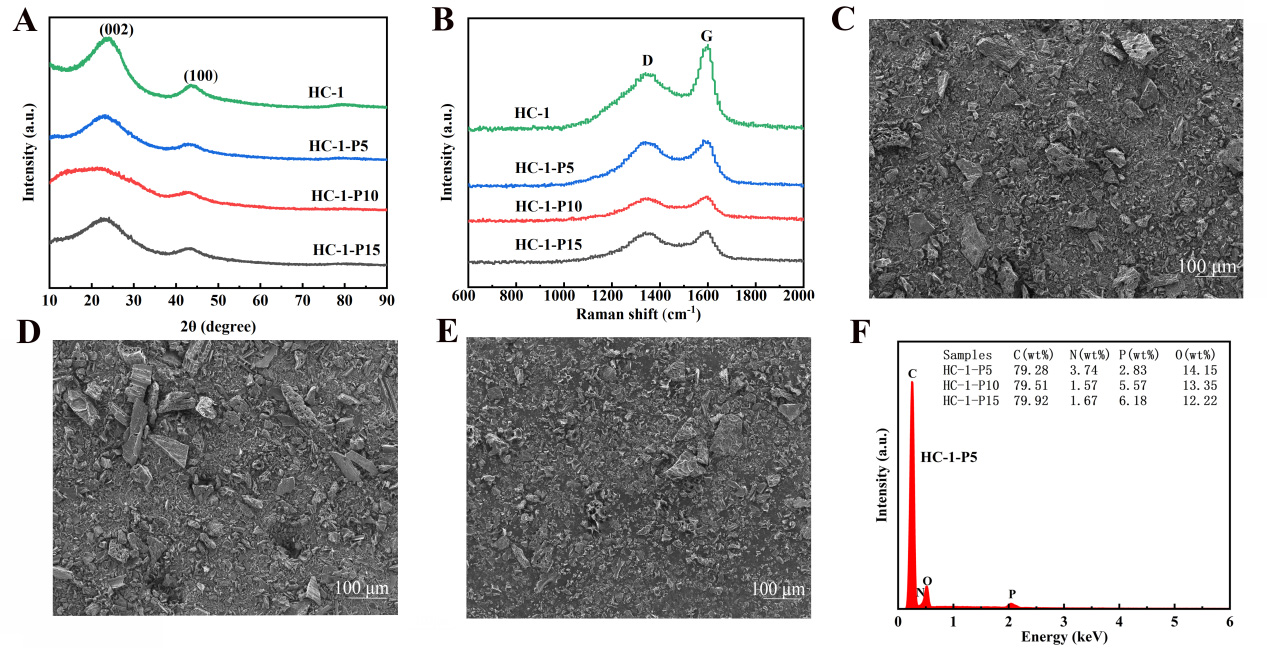
Figure 4. (A) XRD pattern, (B) Raman spectra, (C-E) High magnification SEM images of HC-1 at phosphorus contents of 5, 10, and 15 wt%, respectively and (F) EDS image of HC-1. XRD: X-ray diffraction; SEM: scanning electron microscopy; EDS: energy-dispersive X-ray spectroscopy; HC: hard carbon.


