

fig5
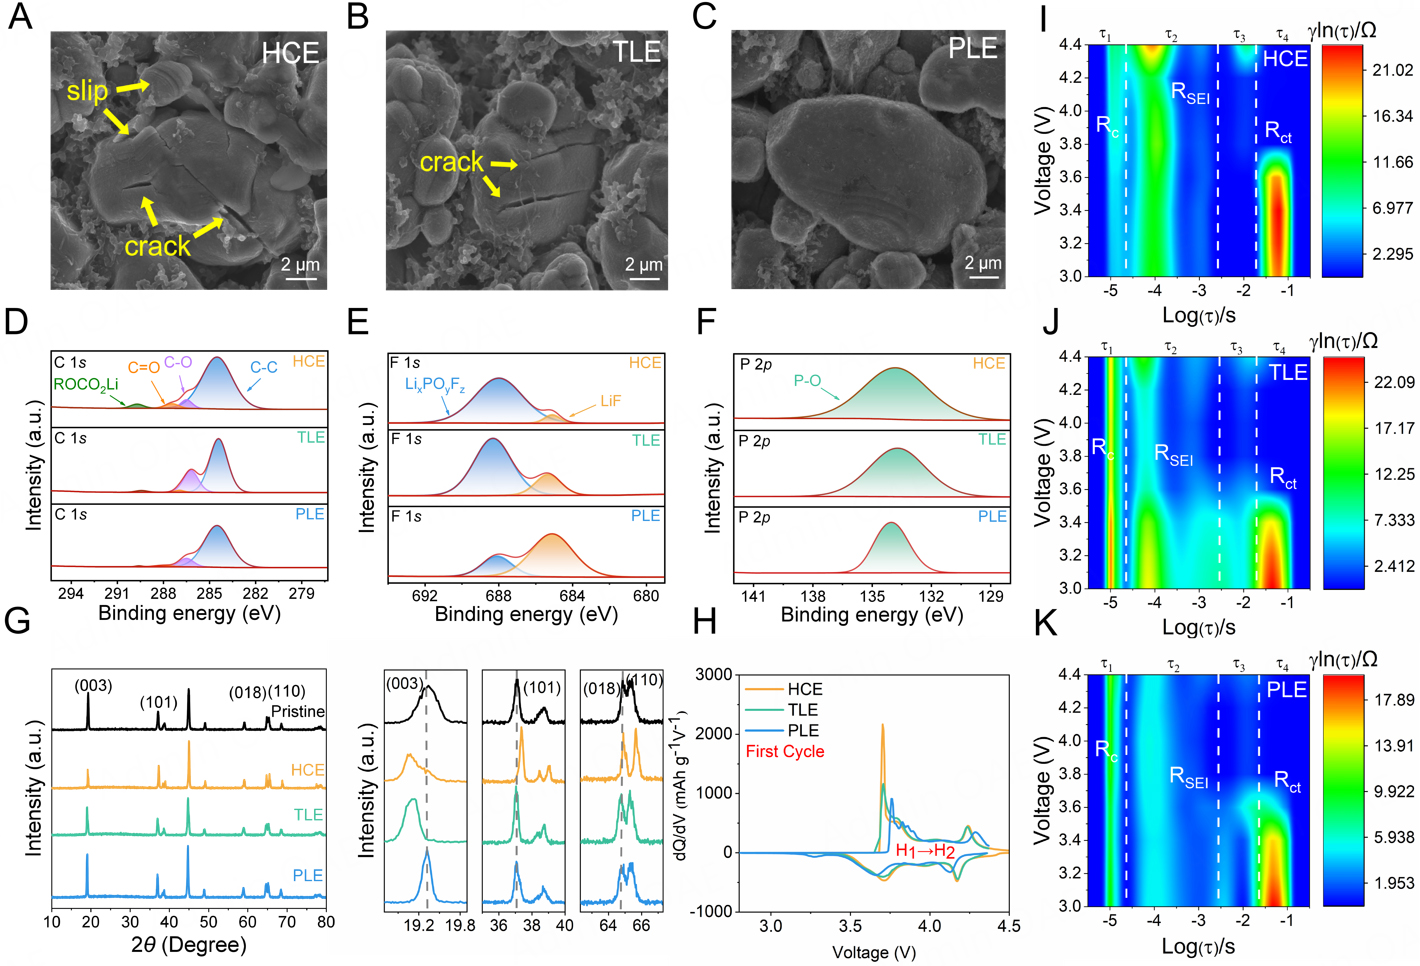
Figure 5. SEM images of morphology of NCM811 cycled in various electrolytes: (A) HCE, (B) TLE and (C) PLE. XPS analysis of (D) C 1s, (E) F 1s, and (F) P 2p of Li||NCM811 cells after 50 cycles in various electrolytes. (G) XRD patterns of NCM811 cathodes in pristine and after 50 cycles in various electrolytes. (H) The dQ/dV curves from the 1st charging and discharging process in HCE, TLE and PLE electrolytes. The initial charge/discharge curve of Li||NCM811 cells was measured at 0.1 C and the corresponding DRT results collected during initial charge/discharge are displayed in (I) HCE, (J) TLE and (K) PLE electrolytes.