
fig5
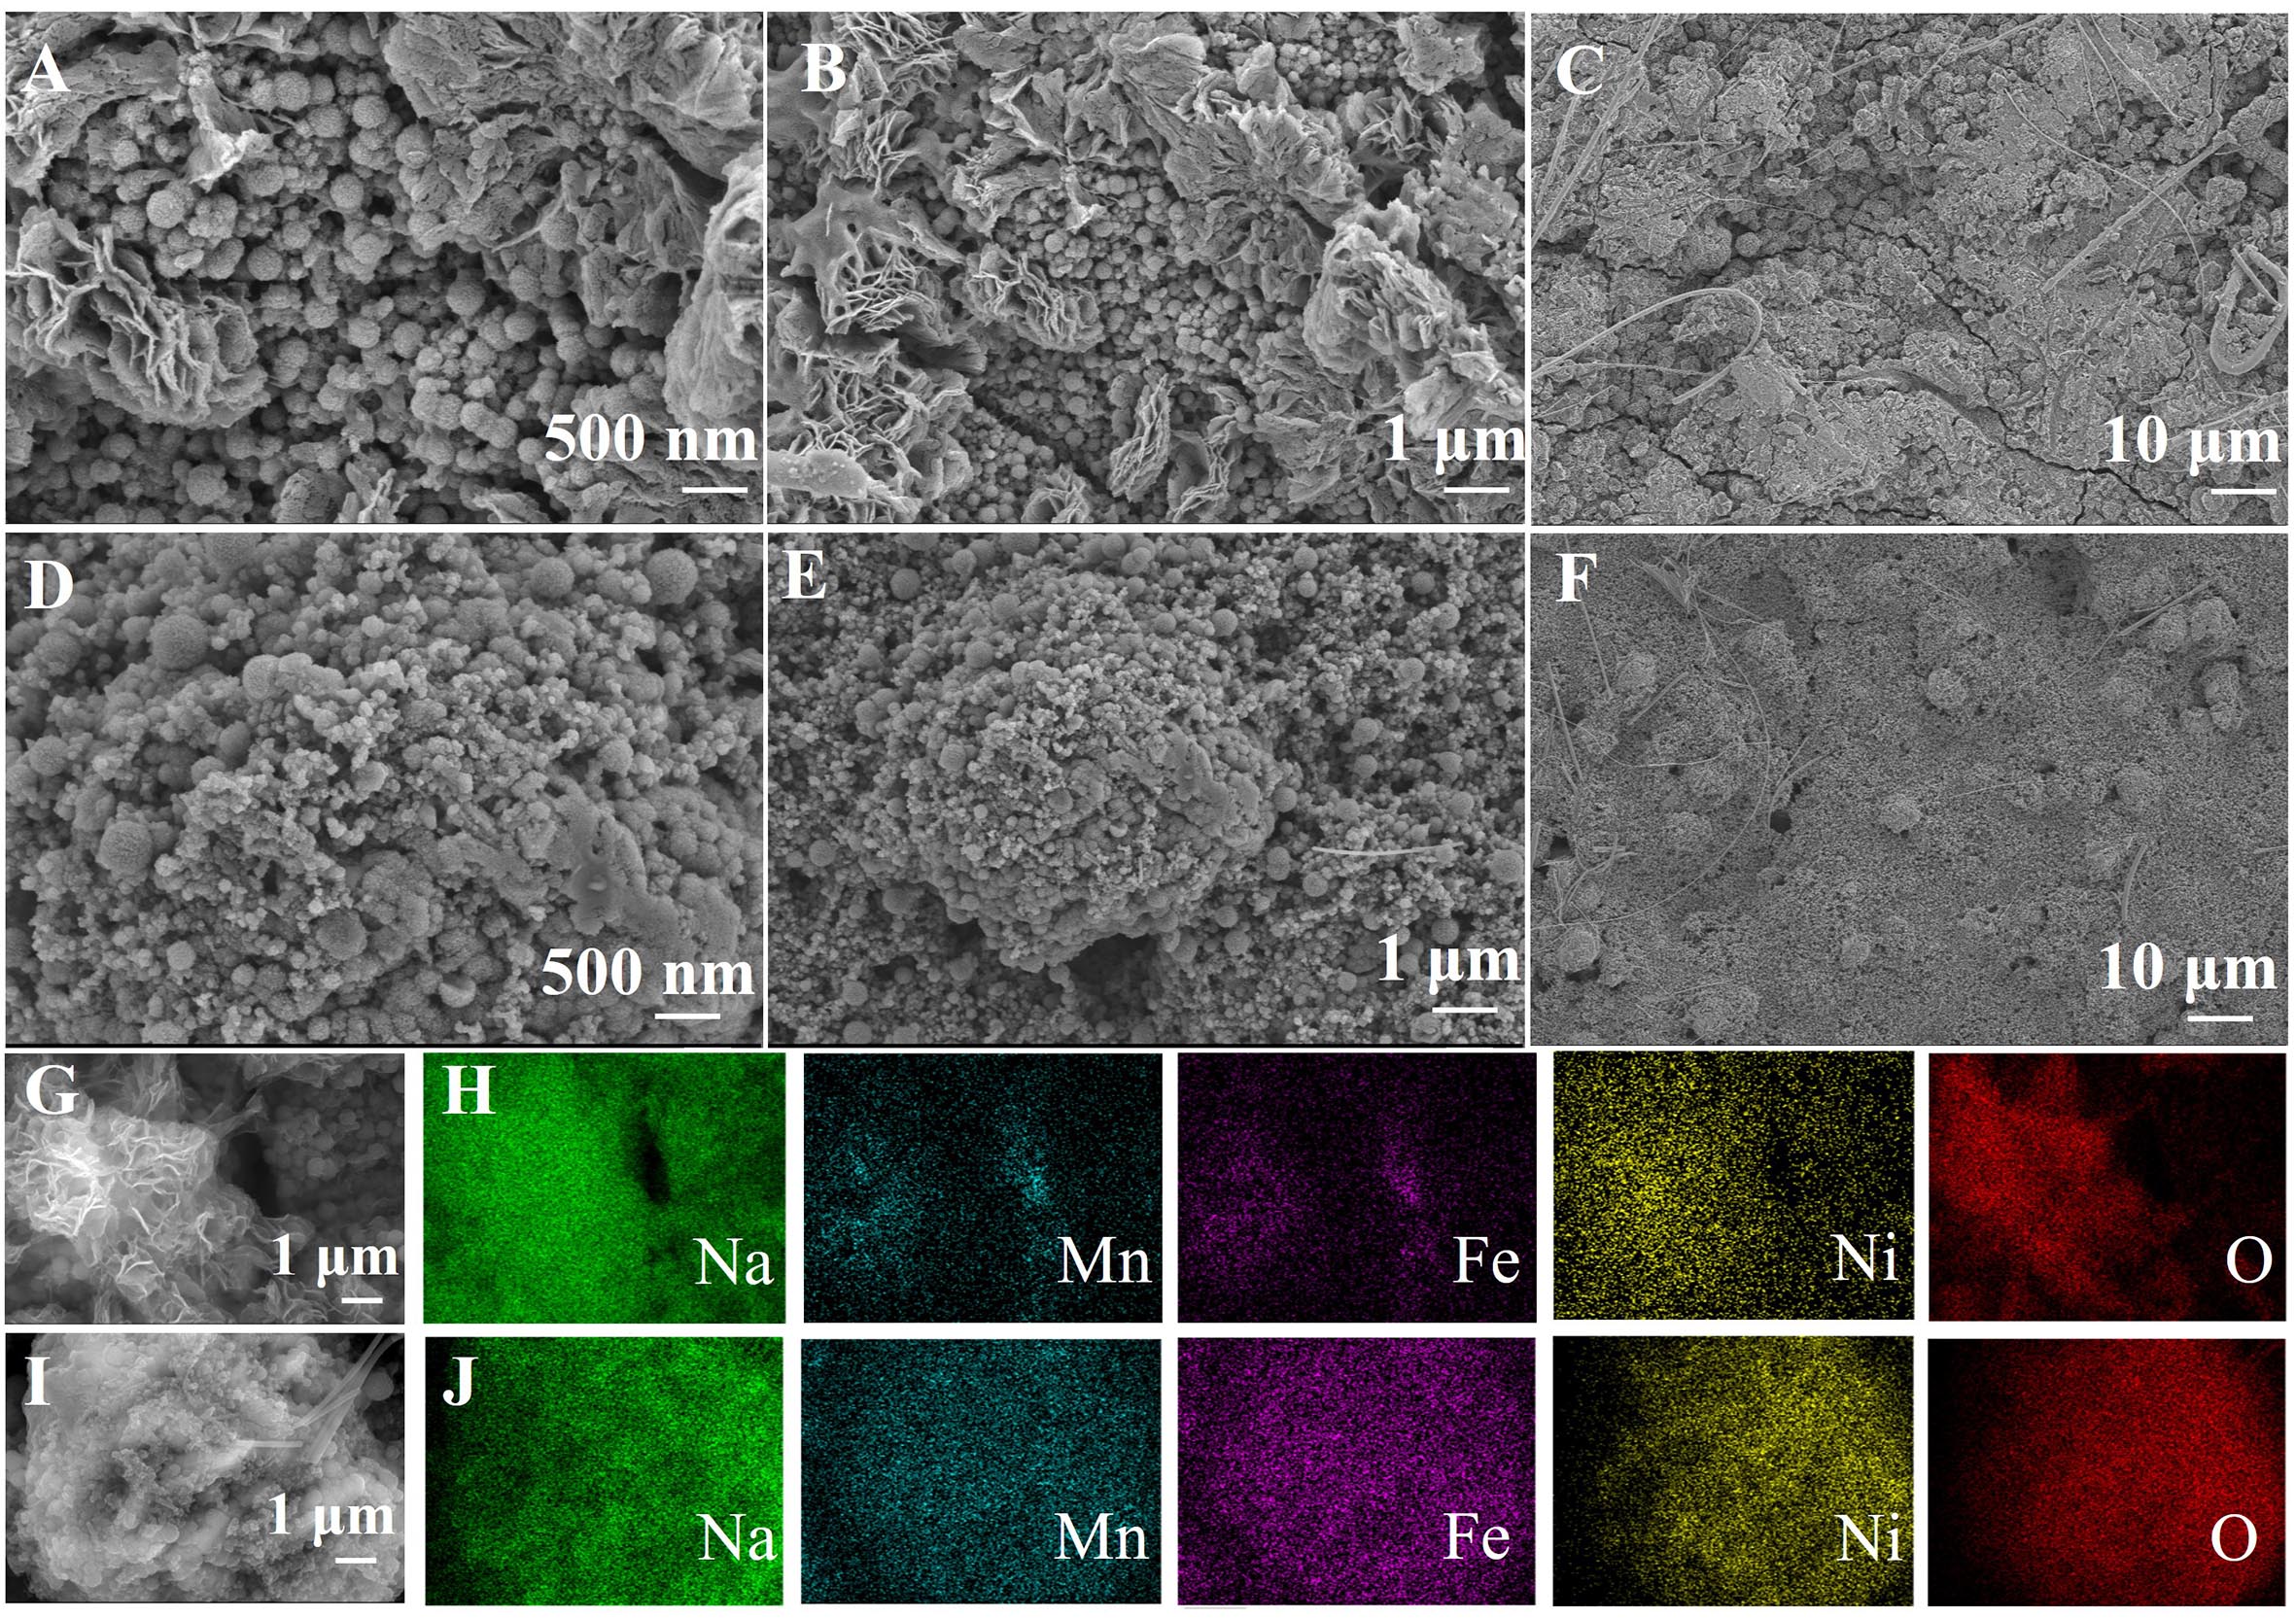
Figure 5. SEM images of the NFM@CTA-4 cathode after 300 cycles at 10 C in PE (A-C) and PE1VC (D-F). SEM images and corresponding EDS elemental mappings of the cycled cathodes in PE (G and H) and PE1VC (I and J) (scale bars in G-J: 1 μm).

Figure 5. SEM images of the NFM@CTA-4 cathode after 300 cycles at 10 C in PE (A-C) and PE1VC (D-F). SEM images and corresponding EDS elemental mappings of the cycled cathodes in PE (G and H) and PE1VC (I and J) (scale bars in G-J: 1 μm).


All published articles are preserved here permanently:
https://www.portico.org/publishers/oae/


