

fig10
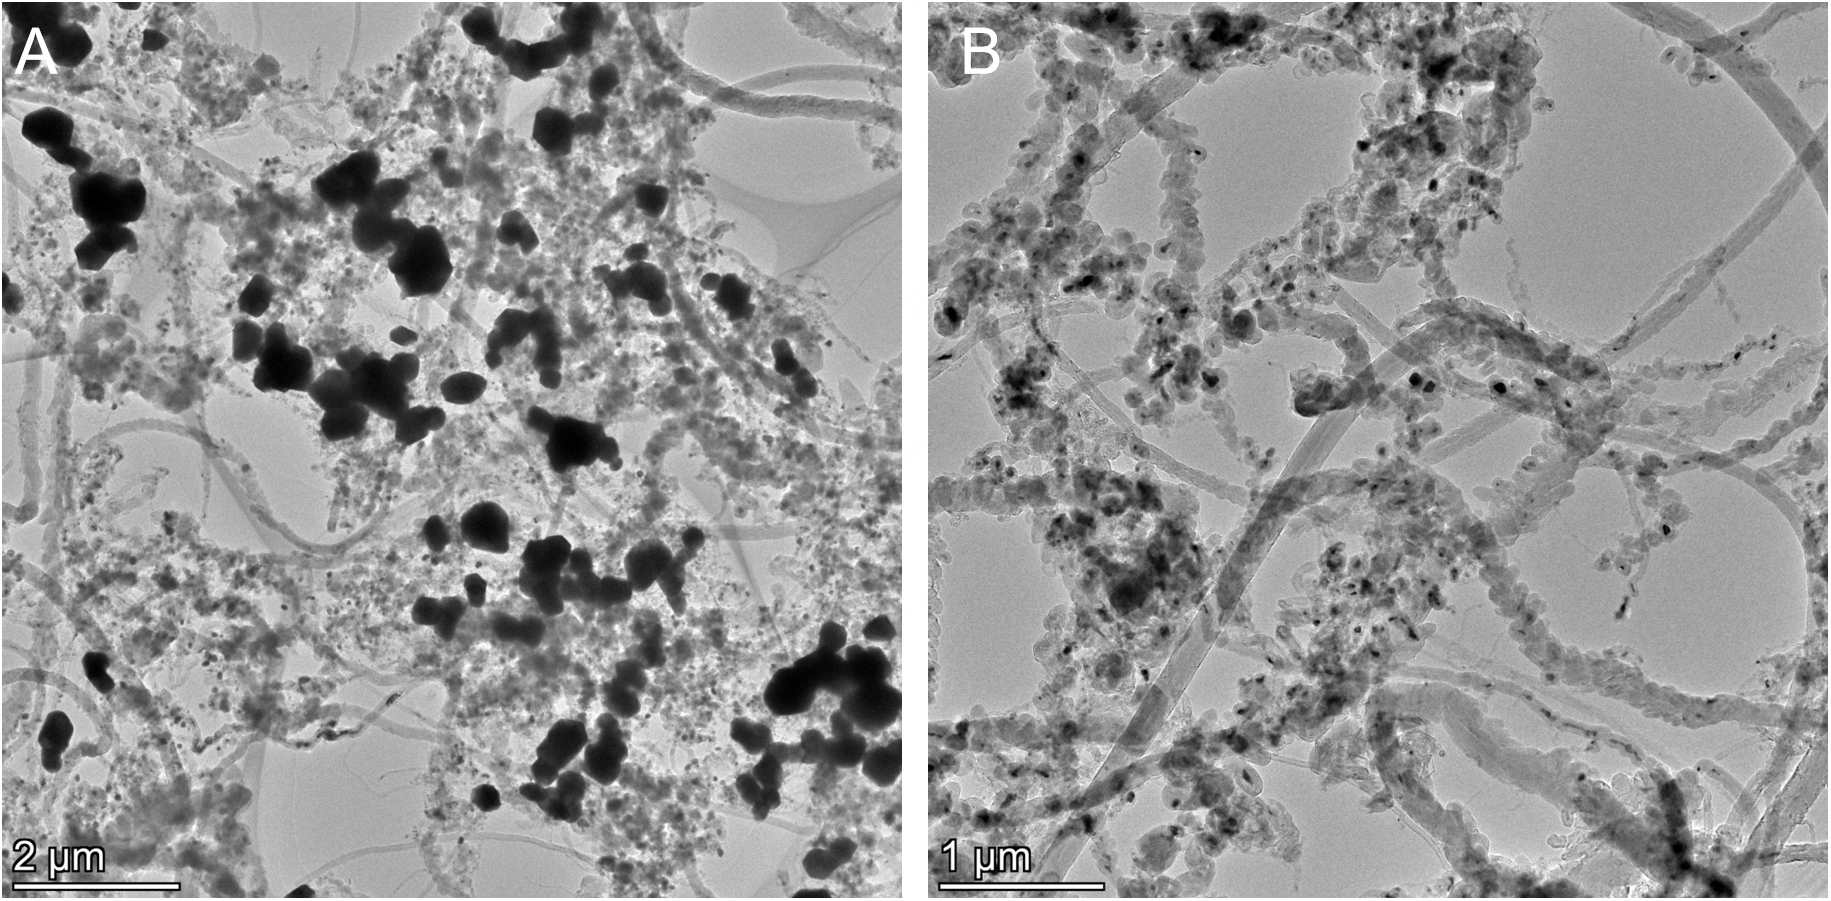
Figure 10. Representative TEM images of carbon-catalyst mixture after 8 h CDM reaction: (A) before acid treatment and (B) after acid treatment with 5 M HNO3. Dark contrast regions associated with catalyst particles are significantly reduced after acid treatment, while the overall carbon morphology is preserved. TEM: Transmission electron microscopy; CDM: catalytic decomposition of methane.