

fig4
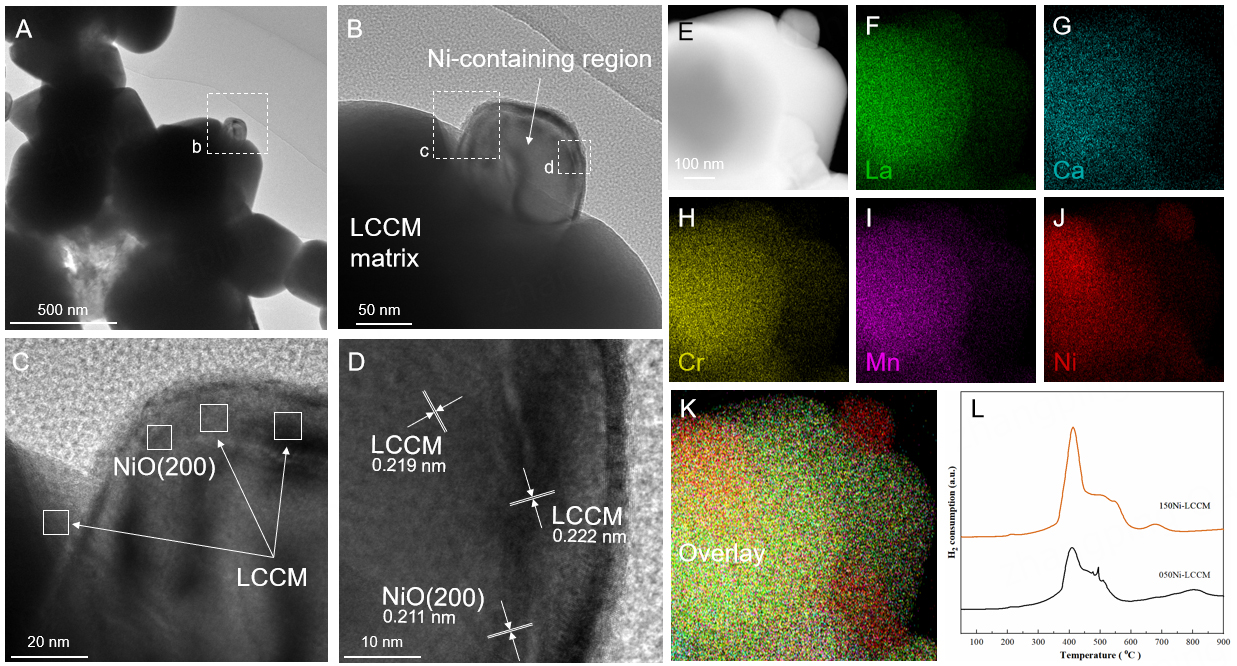
Figure 4. Ni-LCCM interfacial anchoring, elemental distribution, and reducibility of representative xNi-LCCM catalysts. (A) Low-magnification TEM image of 100Ni-LCCM showing a Ni-containing region at the LCCM matrix. (B) Enlarged TEM image of the selected interfacial region; (C and D) HRTEM images showing lattice fringes assigned to NiO and LCCM in the interfacial region; (E-K) STEM-EDS elemental mapping of the selected region: (E) HAADF image, (F) La, (G) Ca, (H) Cr, (I) Mn, (J) Ni, and (K) corresponding elemental overlay; (l) H2-TPR profiles of 050Ni-LCCM and 150Ni-LCCM catalysts after calcination in air at 1,100 °C for 5 h. HRTEM: High-resolution transmission electron microscopy; STEM: scanning transmission electron microscopy; EDS: energy-dispersive X-ray spectroscopy;