


fig2
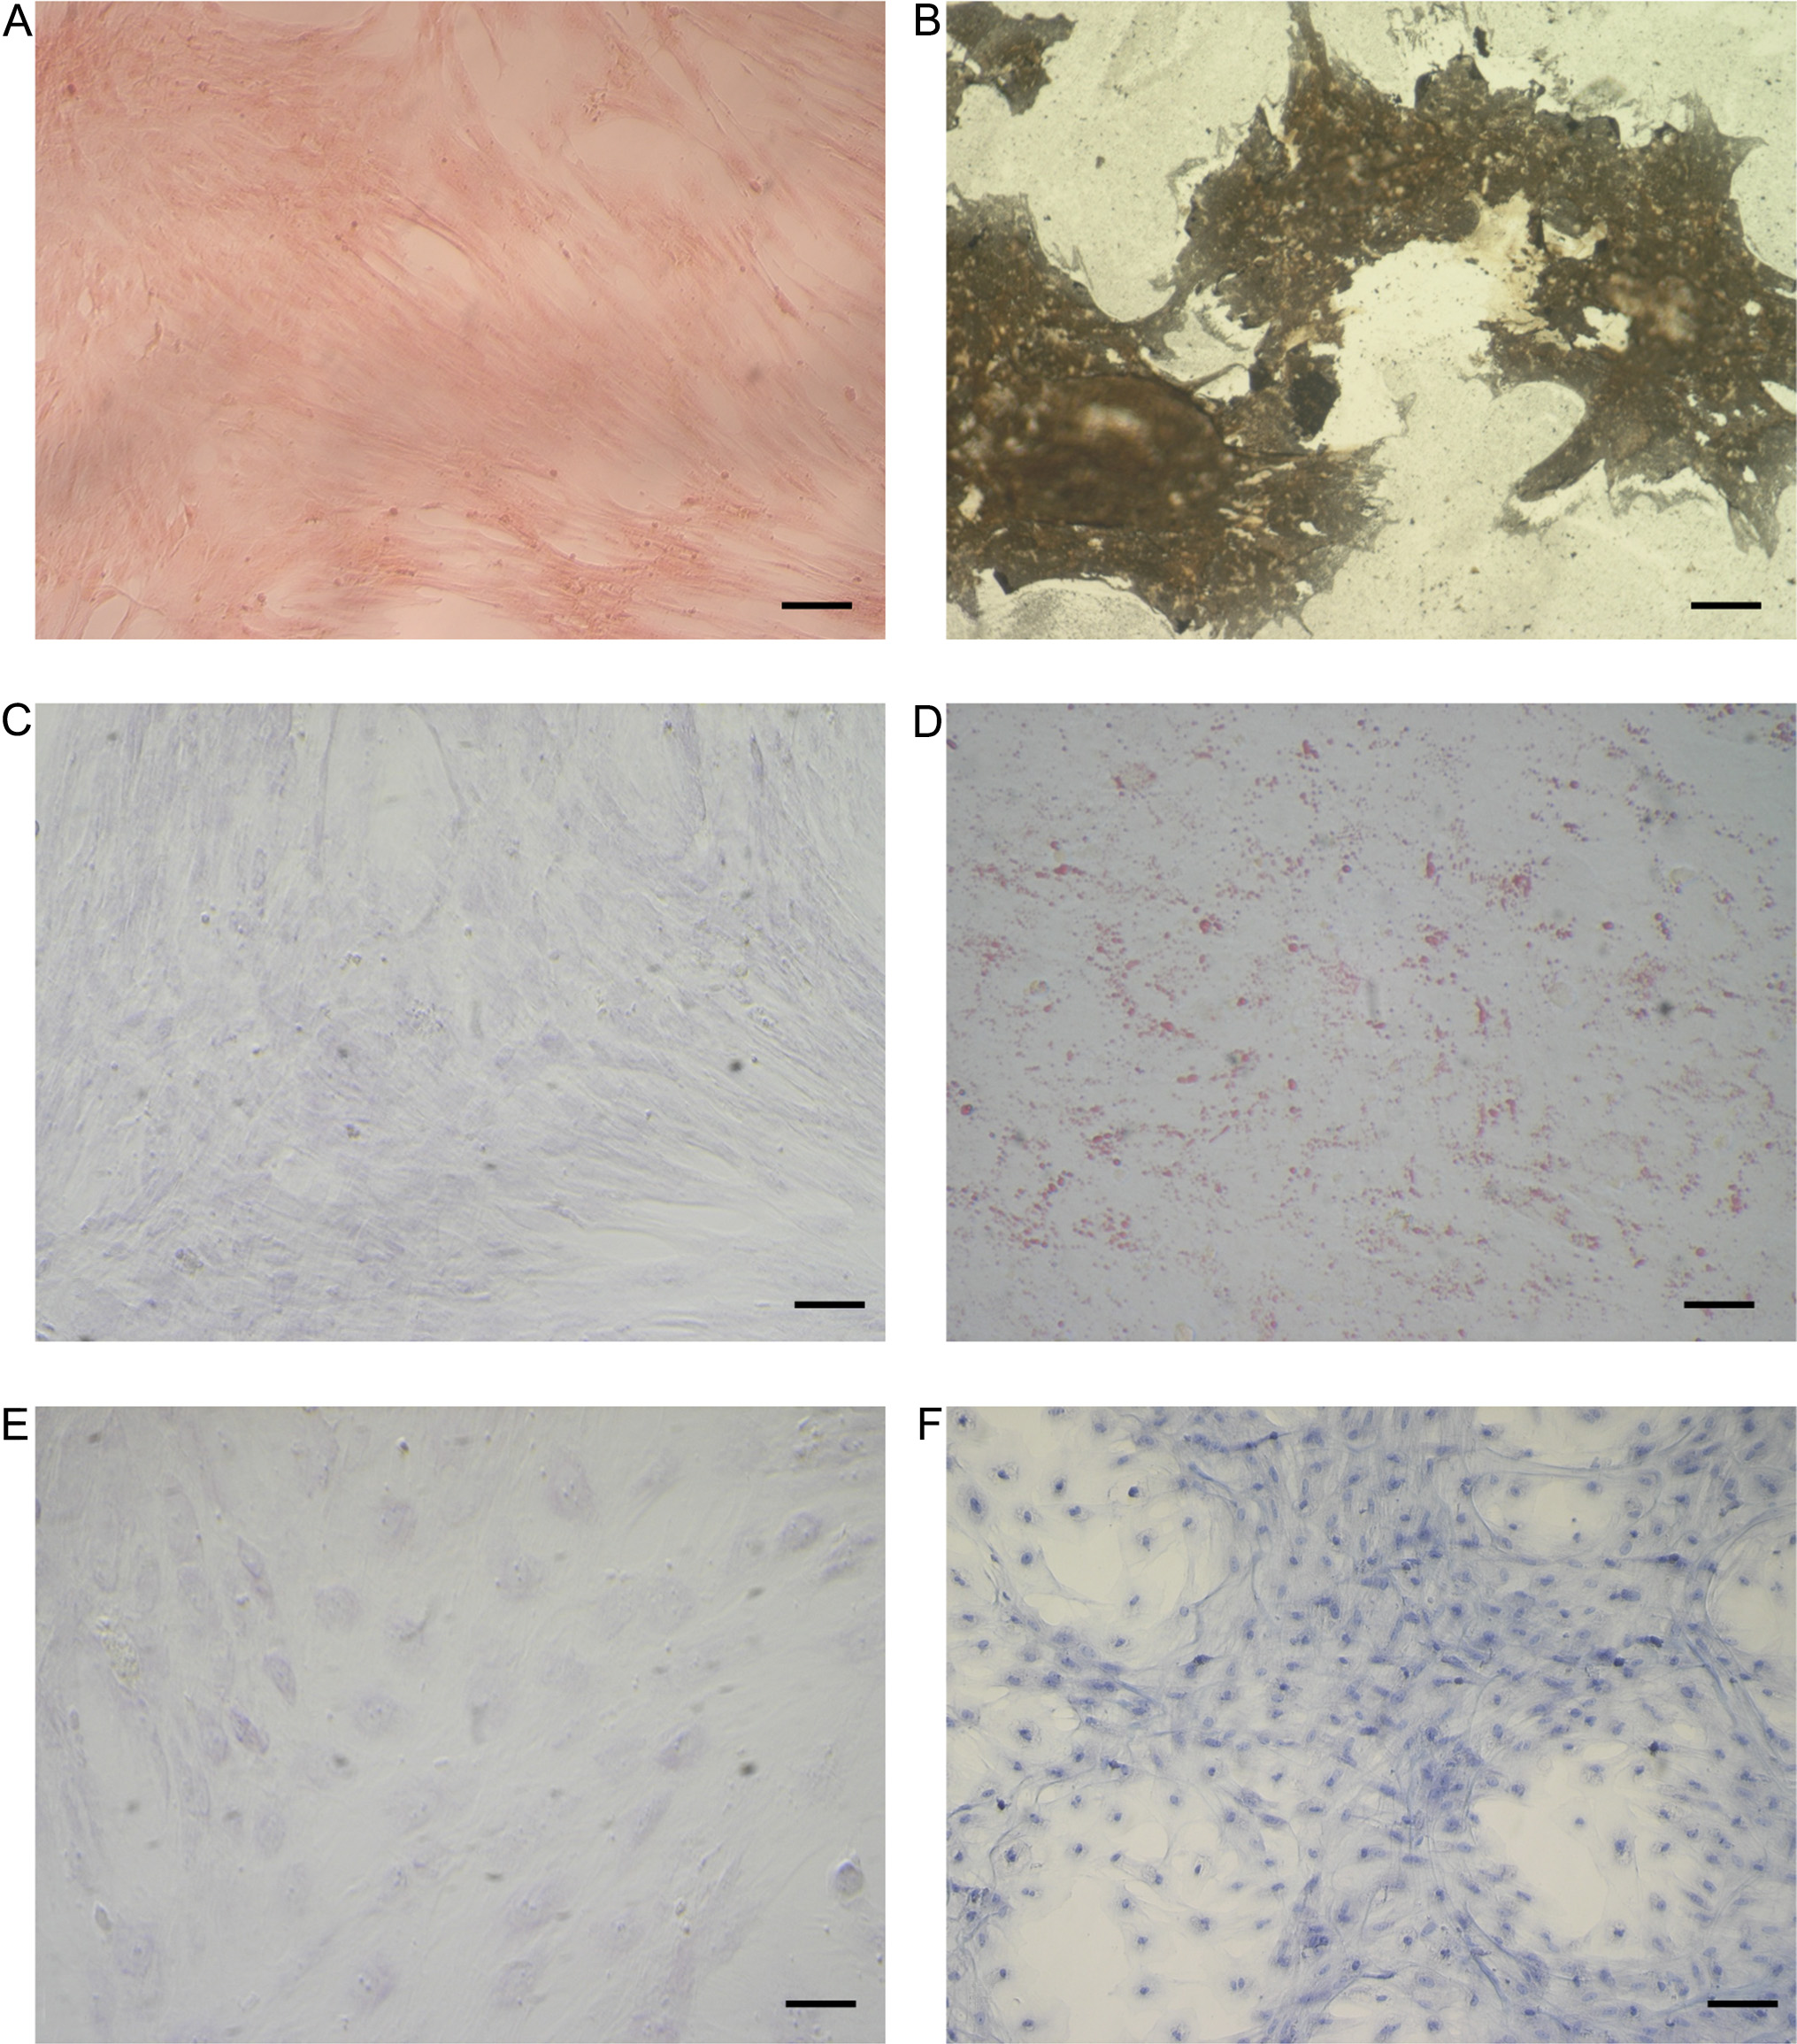
Figure 2. Staining of differentiated and control undifferentiated eAMCs. (A and B) von Kossa staining after osteogenic induction; (C and D) Oil red O cytoplasmic neutral lipids after adipogenic induction; (E and F) Alcian blue staining after chondrogenic induction. Magnification 20×; scale bar = 20 μm. eAMCs: Equine amniotic mesenchymal cells.


