


fig3
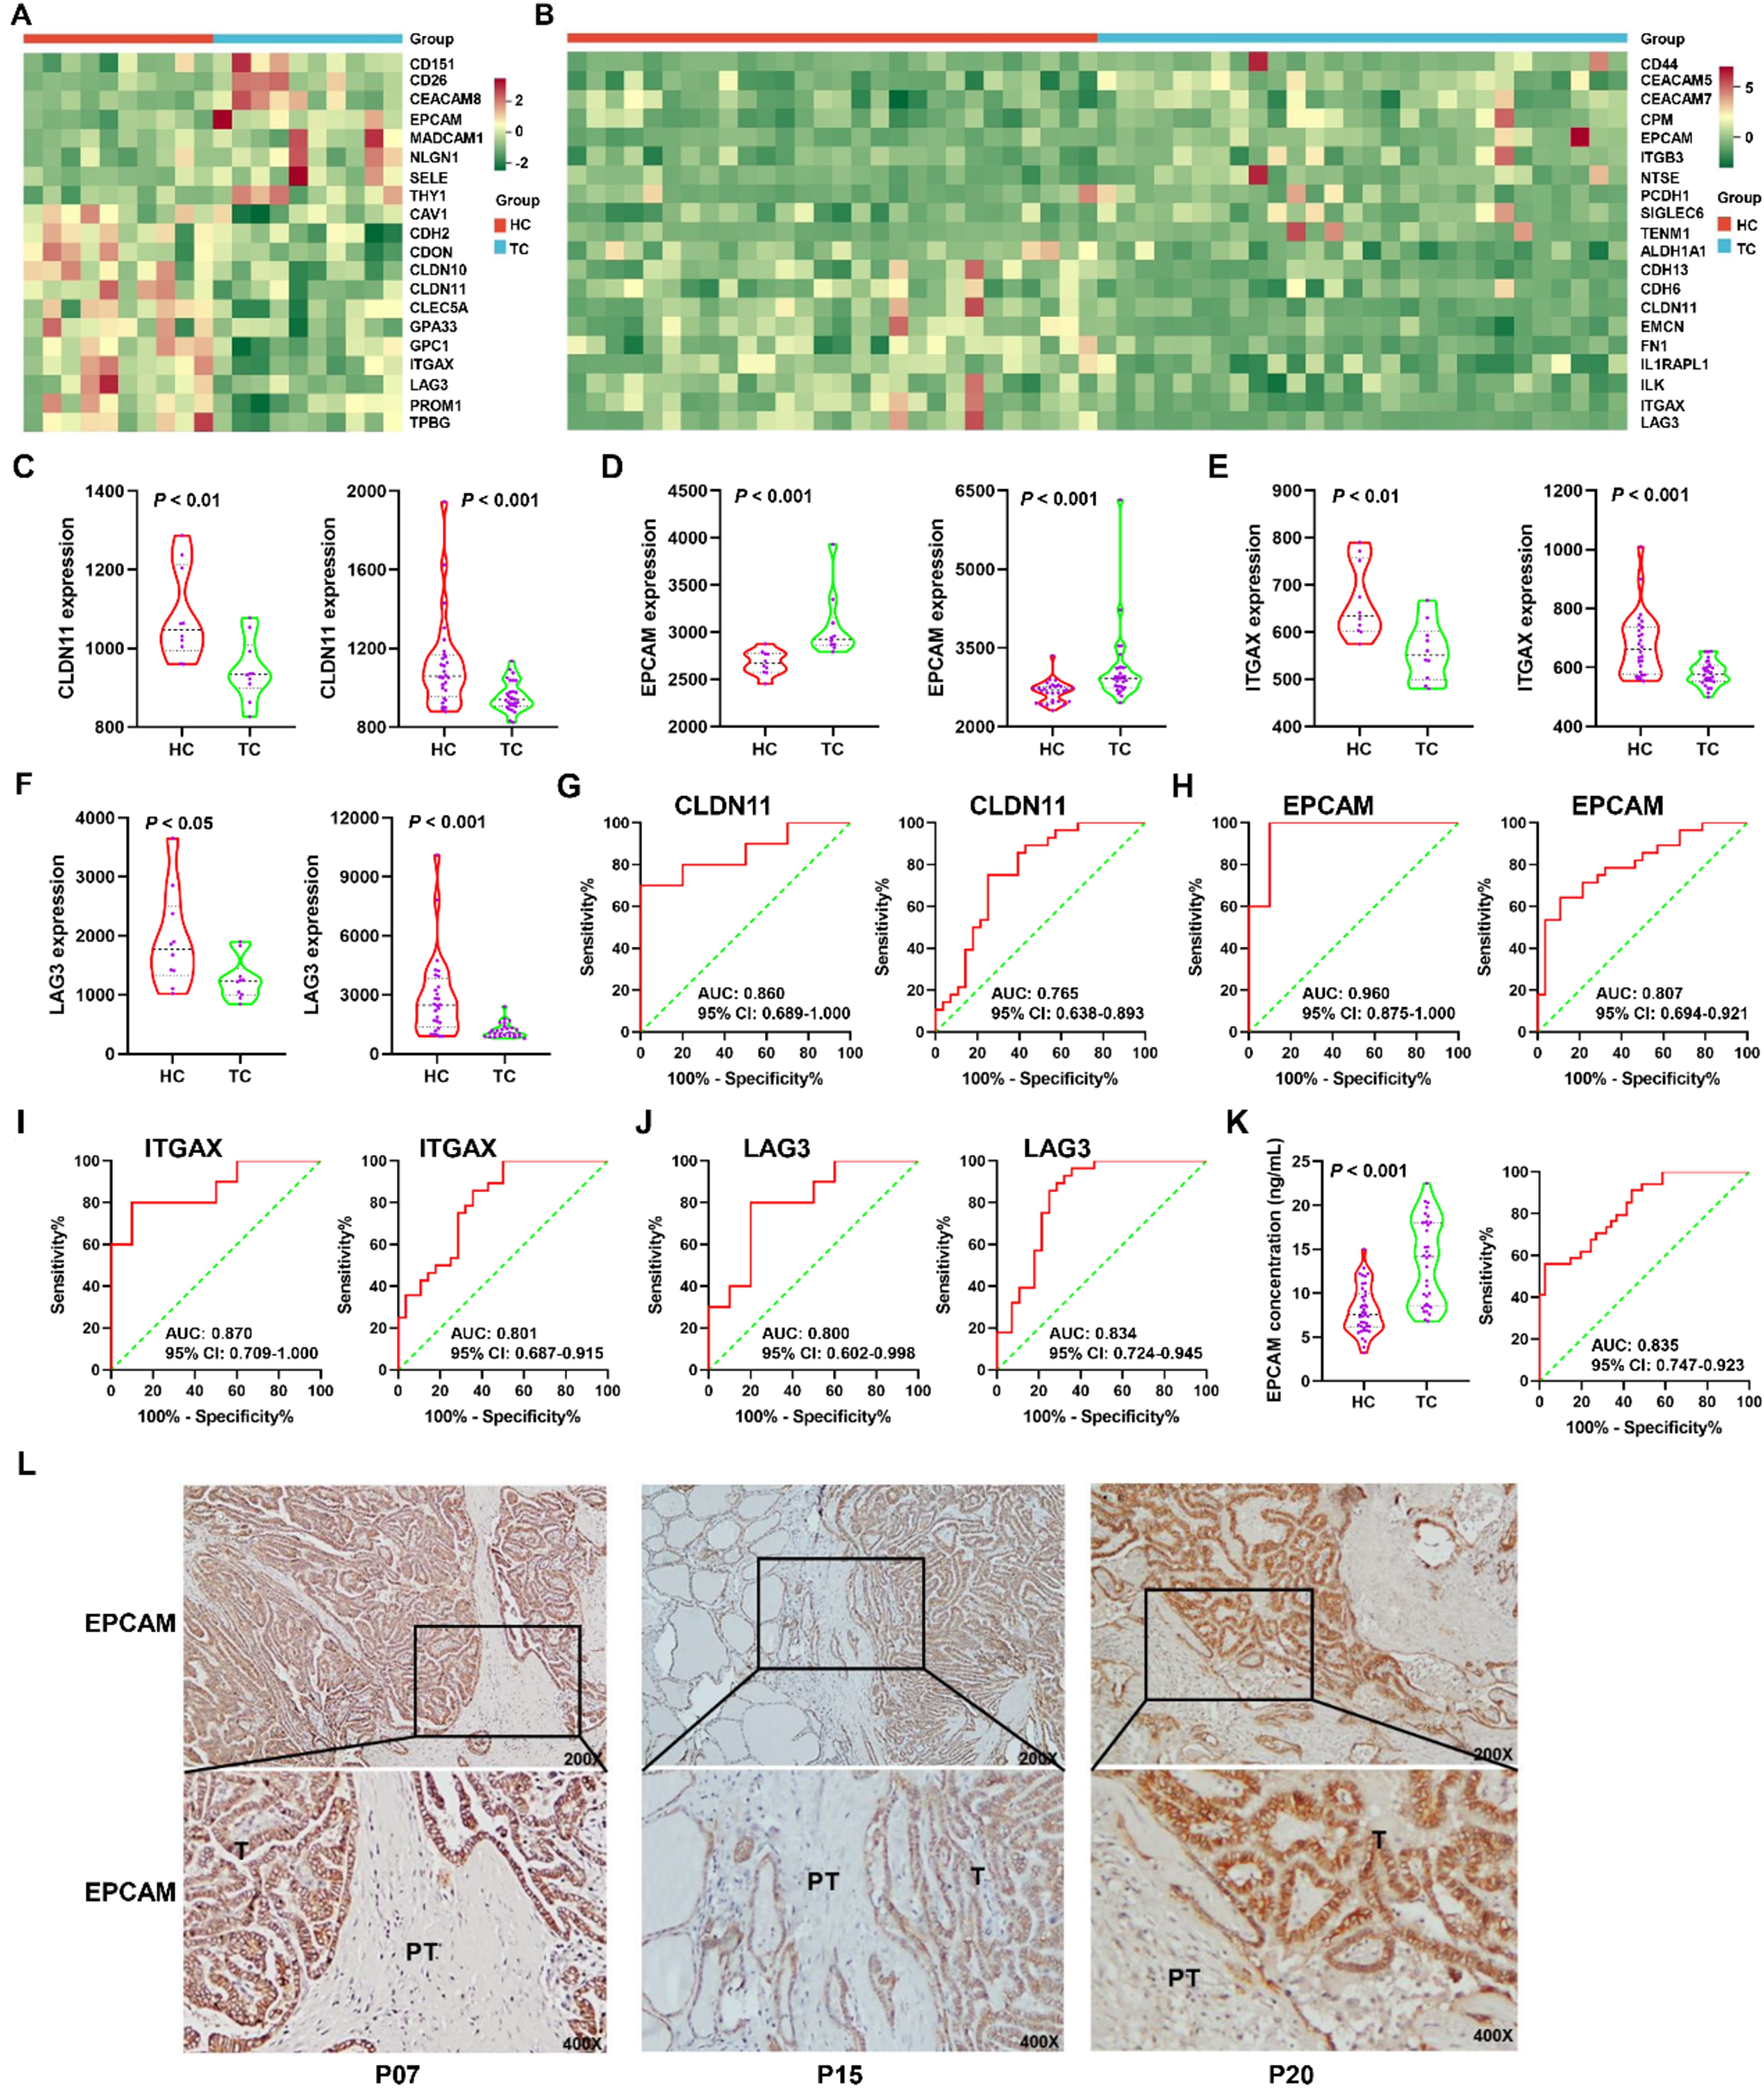
Figure 3. Characterization of sEV surface protein biomarkers for early diagnosis of TC via PBA. The heatmaps displayed the top 20 differentially expressed sEV proteins between HC and TC in Cohort 1 (A) and 2 (B); The differential expression of CLDN11 (C), EPCAM (D), ITGAX (E), and LAG3 (F) between HC and TC in Cohort 1 (left panel) and 2 (right panel). The data of CLDN11, ITGAX, and LAG3 in Cohort 1 was analyzed using the Student’s t-test while their data in Cohort 2 was analyzed using the Mann‒Whitney U test. The data of EPCAM in both cohorts was analyzed using the Mann‒Whitney U test; ROC curves for CLDN11 (G), EPCAM (H), ITGAX (I), and LAG3 (J) in Cohort 1 (left panel) and 2 (right panel) were plotted; (K) The plasma EPCAM concentrations were analyzed using an ELISA kit in Cohort 3, which included 41 HC and 34 TC patients. The data of plasma EPCAM concentration was analyzed using the Mann‒Whitney U test. The ROC curve was plotted in the right panel; (L) EPCAM expression was assessed by IHC in tissue sections of TC (T) with peritumor tissues (PT) and representative images were exhibited for samples in Cohort 4 (n = 21). sEV: Small extracellular vesicle; TC: thyroid carcinoma; PBA: proximity-dependent barcoding assay; HC: healthy controls; CLDN11: claudin 11; EPCAM: epithelial cell adhesion molecule; ITGAX: integrin alpha X; LAG3: lymphocyte-activating 3; ROC: receiver operating characteristic; ELISA: enzyme-linked immunosorbent assay; IHC: immunohistochemistry; AUC: area under the curve; CI: confidence interval.


