fig5

A single-sEV analysis identifies plasma EPCAM<sup>+</sup> sEVs as a biomarker for early diagnosis and monitoring postoperative remission of thyroid cancer

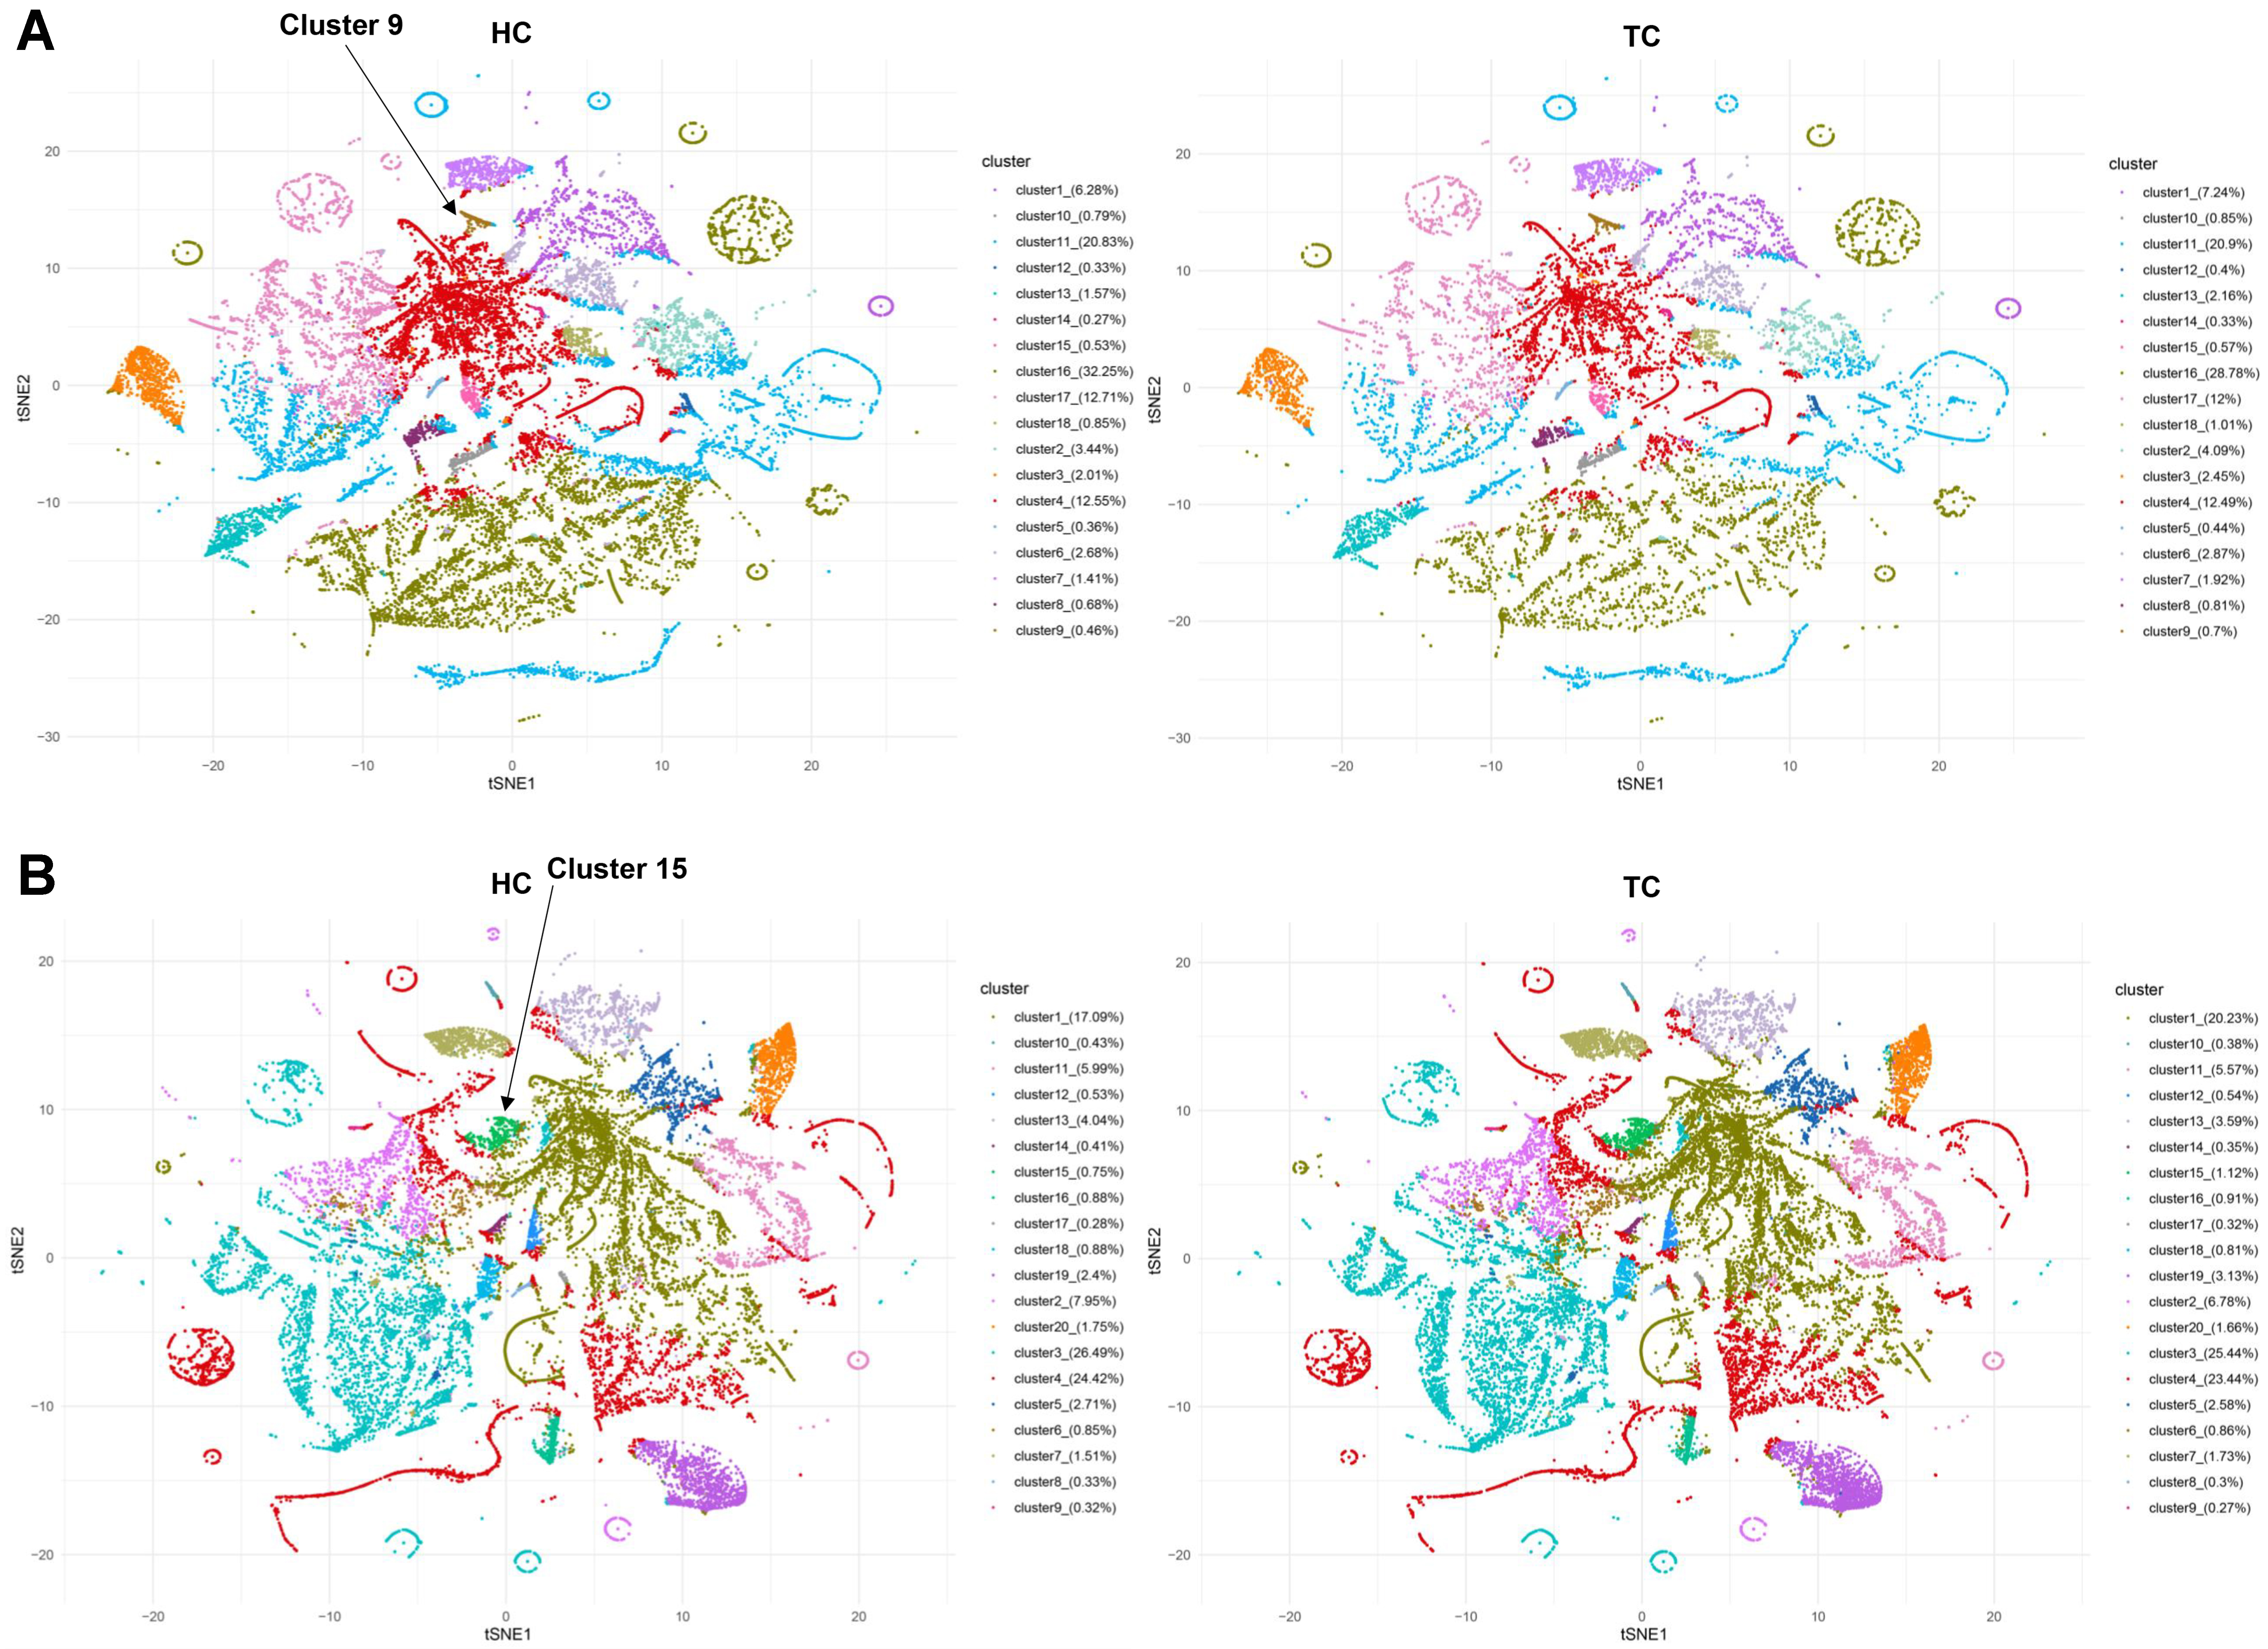
Figure 5. Differences in distribution and population of sEV clusters between HC and TC. The sEV clusters for Cohort 1 (A) and 2 (B) were generated using FlowSOM algorithm. sEV: Small extracellular vesicle; HC: healthy controls; TC: thyroid carcinoma.

Extracellular Vesicles and Circulating Nucleic Acids
ISSN 2767-6641 (Online)
Follow Us

Portico

All published articles are preserved here permanently:

https://www.portico.org/publishers/oae/

Portico

All published articles are preserved here permanently:

https://www.portico.org/publishers/oae/