


fig5
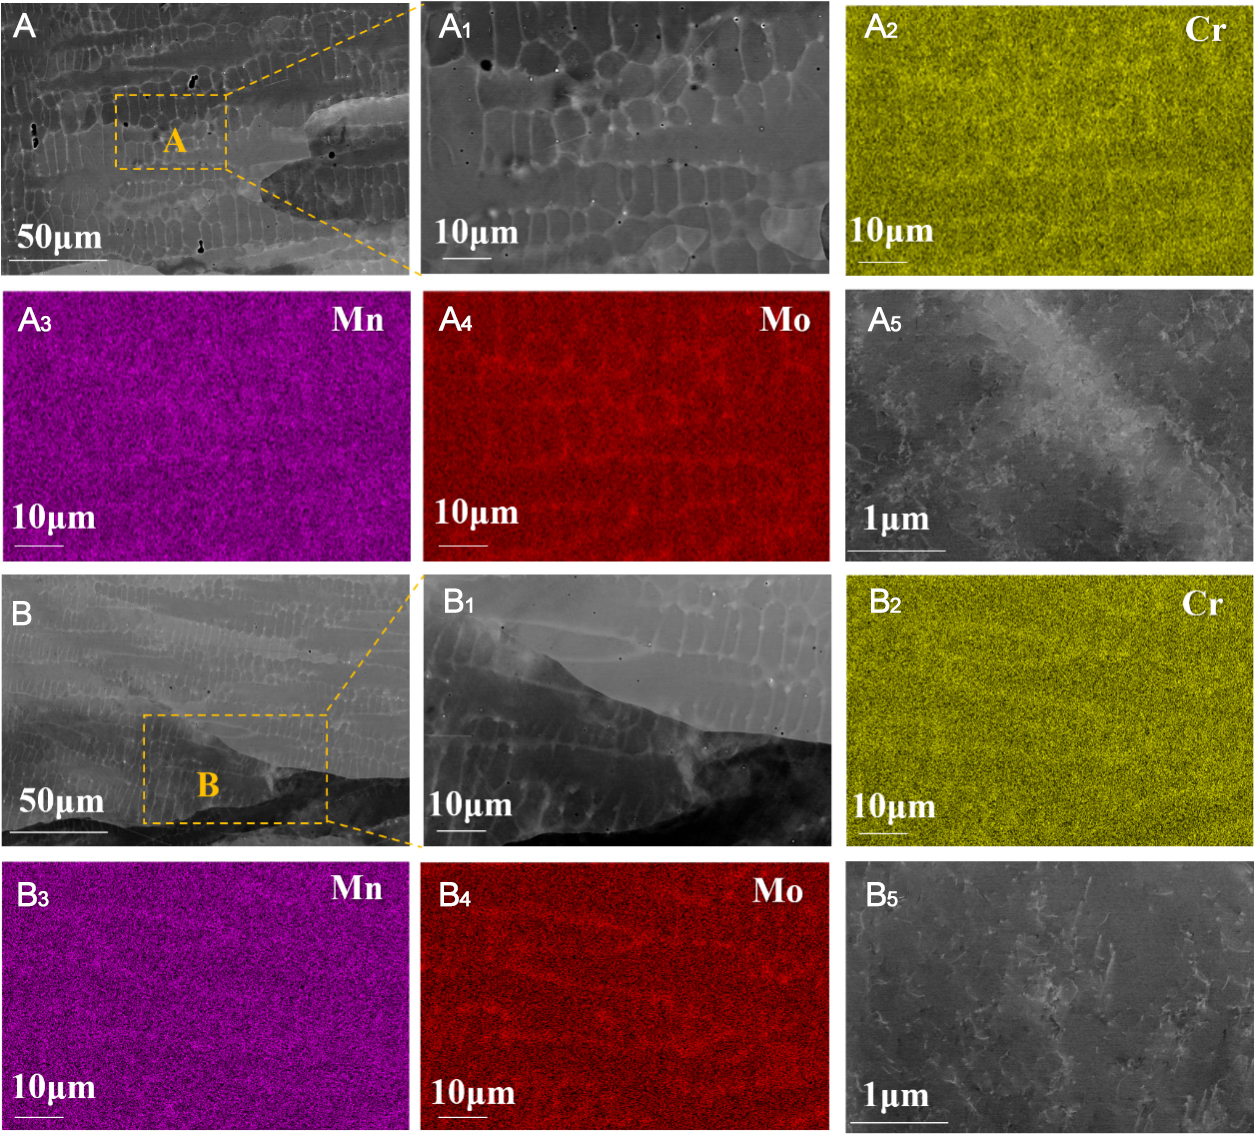
Figure 5. ECCI images and EDS maps of the FZ before and after cyclic loading at 4.2 K: (A) FZ before fatigue, (A1) the magnified image in dash rectangle in (A), (A2) to (A4) the EDS elemental distribution maps corresponding to (A1), (A5) the magnified image in dash rectangle in (A) showing the dislocations, (B) FZ after fatigue, (B1) the magnified image in yellow rectangle in (B), (B2) to (B4) the EDS elemental distribution maps corresponding to (B1), (B5) the magnified image in dash rectangle in (B) showing the dislocations. EDS: Energy dispersive spectroscopy; ECCI: electron channeling contrast imaging; FZ: fusion zone.


