

fig3
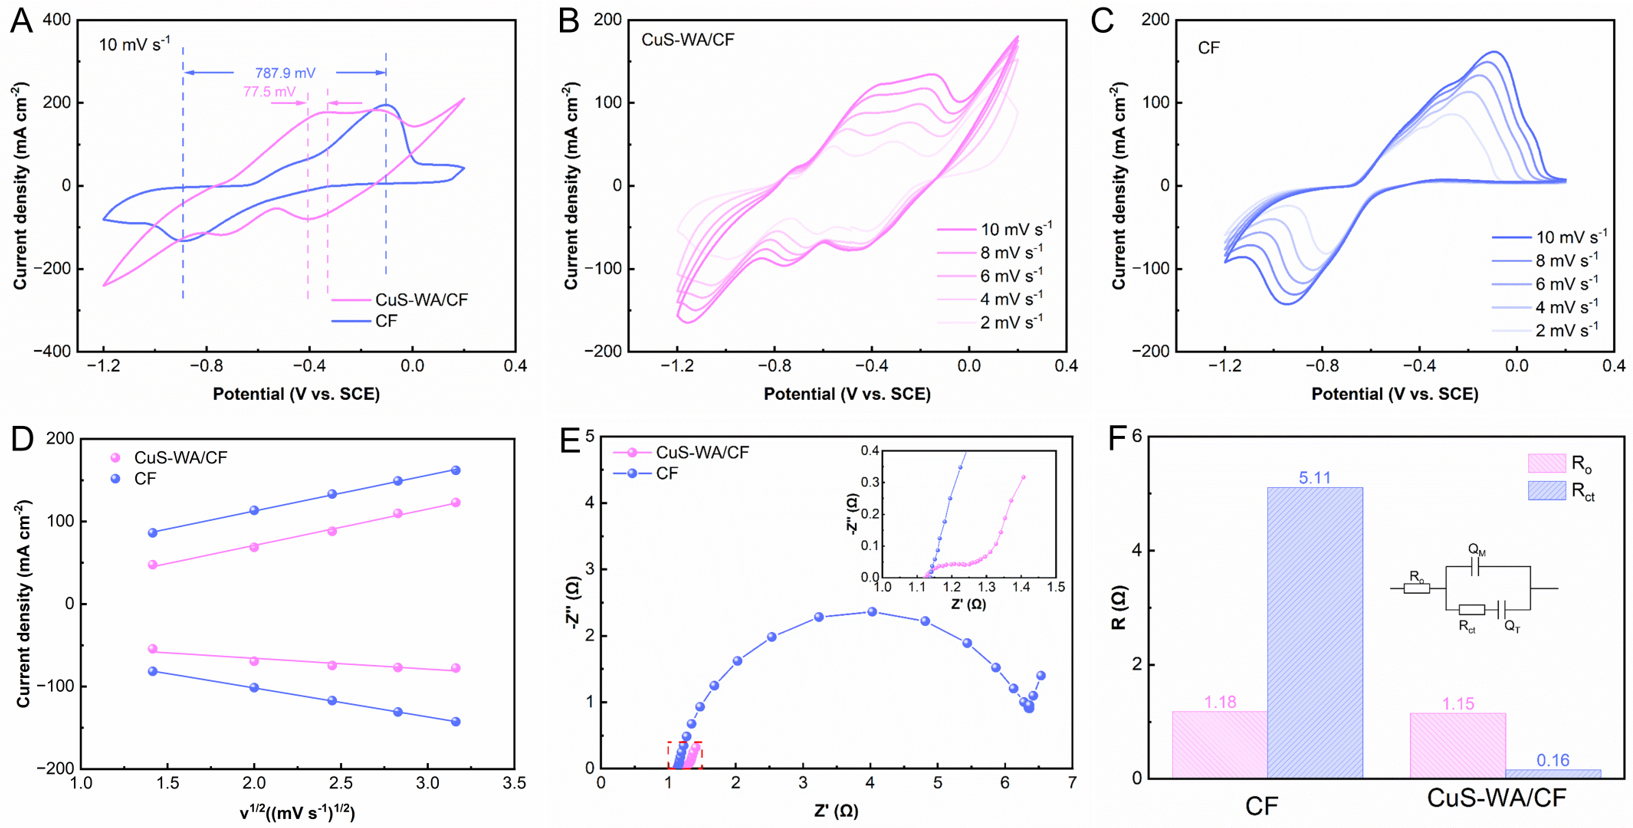
Figure 3. Electrochemical characterization of pristine CF and CuS-WA/CF electrodes in 0.1 M K2S + 1.0 M KOH electrolyte. (A) CV curves at 10 mV s-1. (B and C) CV curves for pristine CF and CuS-WA/CF collected at varying scan rates. (D) Peak current density versus the square root of scan rate. (E) Nyquist plots measured at open-circuit potential. (F) Quantitative comparison of the equivalent circuit resistance values derived from EIS fitting.





