

fig9
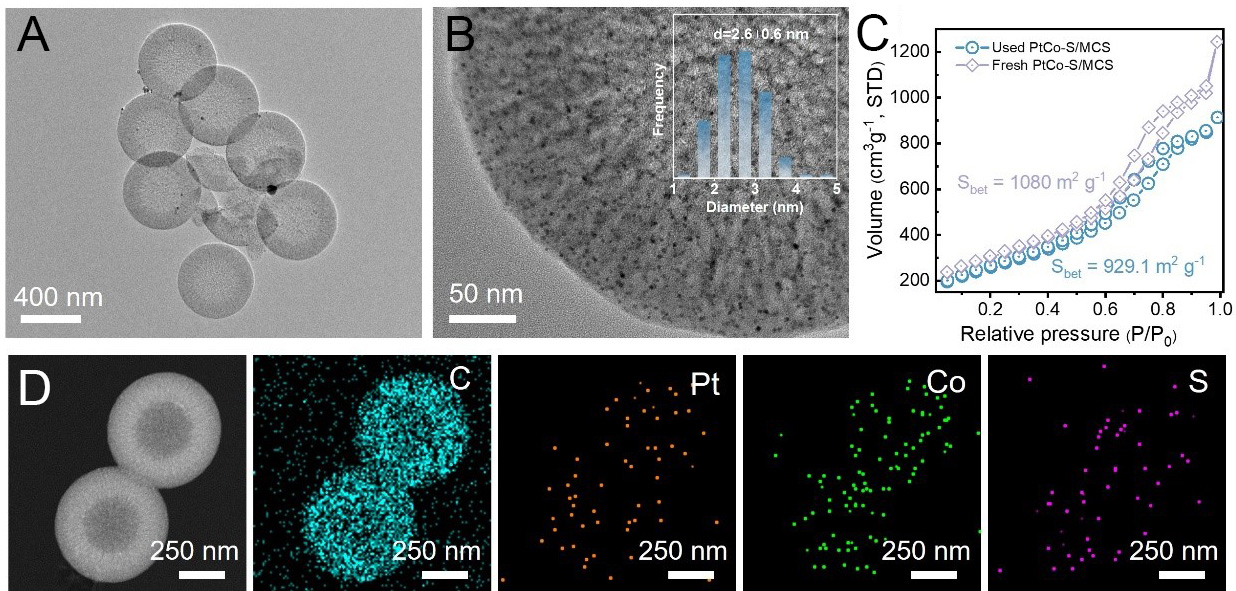
Figure 9. Characterization of the used PtCo–S/MCS catalyst. (A and B) TEM images with the inset showing the size distribution of metal clusters; (C) N2 adsorption-desorption isotherm (the inset shows pore size distribution curve); (D) HAADF-STEM image and the corresponding EDS elemental mappings. STD: Standard temperature and pressure; MCS: mesoporous carbon nanospheres; TEM: transmission electron microscopy; HAADF-STEM: high-angle annular dark-field scanning transmission electron microscopy; EDS: energy-dispersive X-ray spectroscopy.

