


Predicting cardiometabolic multimorbidity in Chinese older adults via machine learning
 0
0 
Abstract
Aim: Cardiometabolic multimorbidity (CMM) is increasingly prevalent in China’s aging population, posing major public health challenges. Developing machine learning (ML) models for early prediction is essential to inform prevention.
Methods: We used data from 16,970 adults aged ≥ 45 years from the China Health and Retirement Longitudinal Study (CHARLS) across four waves (2011-2018). We used 42 predictors from 2013/2015 (demographics, lifestyle factors, physical measures, and blood biomarkers) to train five ML models: generalized linear model (GLM), gradient boosting machine (GBM), distributed random forest (DRF), deep learning (DL), and a Stacked Ensemble model. The primary outcome was CMM in 2018, defined as self-reported diagnoses of ≥ 2 conditions among hypertension, diabetes, heart disease, and stroke. Models were evaluated using the area under the curve (AUC), Brier score, and calibration curves. Synthetic Minority Over-sampling Technique (SMOTE) and 5-fold cross-validation were used to optimize performance.
Results: The Stacked Ensemble model achieved the best internally validated predictive performance (AUC = 0.755), significantly outperforming GLM and DL (both DeLong’s P = 0.03), with comparable performance to GBM and DRF. Calibration analysis confirmed reliable prediction (Brier score = 0.153). Variable importance analysis based on GBM and DRF identified dyslipidemia, age, triglycerides, high-density lipoprotein cholesterol, waist circumference, self-rated health expectations, pain, cooking fuel type, weight change, and cystatin C as the top-ranked predictors common to both algorithms.
Conclusion: ML algorithms, particularly ensemble models, can effectively predict CMM risk in China’s aging population. The integration of diverse health indicators and self-perceived health measures enhances predictive power.
Keywords
INTRODUCTION
The global population is aging at an unprecedented rate, and with it, the burden of chronic diseases is becoming increasingly complex. One of the most pressing challenges in this context is cardiometabolic multimorbidity (CMM) - commonly defined as the co-occurrence of two or more cardiometabolic diseases, such as hypertension, diabetes, heart disease, and stroke[1,2]. These conditions often share overlapping etiologies, risk factors, and pathophysiological pathways, and their co-manifestation significantly exacerbates morbidity, mortality, and healthcare costs compared to single-disease presentations[3]. In China, where demographic transition is particularly rapid, the challenge is even more severe. According to official projections, nearly 28% of China’s population will be over 60 years old by 2040[4]. This demographic shift is paralleled by rising rates of cardiometabolic diseases due to urbanization, sedentary lifestyles, unhealthy diets, and environmental exposures[5,6]. Importantly, the conventional siloed approach to disease prevention and management is poorly equipped to address the interconnected and compounding nature of CMM. Therefore, identifying individuals at high risk of developing CMM before its onset is not only a clinical necessity but also a strategic public health imperative, particularly in countries such as China that are facing the dual pressures of aging and chronic disease epidemics[7].
In recent years, machine learning (ML) has emerged as a transformative tool for disease prediction and risk stratification. It offers clear advantages over traditional statistical models by leveraging high-dimensional data - incorporating clinical, behavioral, and biomarker variables - to capture the complex, non-linear interactions that drive cardiometabolic diseases, including diabetes, hypertension, and cardiovascular events[8-10]. However, studies on predicting multimorbidity, especially CMM, remain sparse. Most studies either focus on Western populations or rely on limited datasets with narrow variable scopes, omitting many of the psychosocial, environmental, and lifestyle dimensions that are increasingly recognized as critical determinants of chronic disease clustering[11]. Moreover, multimorbidity prediction studies are often based on cross-sectional data, limiting their temporal robustness and real-world applicability. In the context of aging Chinese adults, existing ML prediction studies on CMM based on China’s elderly population have largely relied on limited variable sets or single algorithms, with a notable absence of multidimensional predictor integration and systematic application of ensemble models[12]. There is also a lack of ensemble models that integrate multiple ML algorithms for optimal performance and interpretability in a real-world, population-health setting[13].
Against this backdrop, three critical research gaps persist: first, while ML has been applied to predict individual cardiometabolic diseases in Western populations, its use for multimorbidity prediction - particularly in the context of China’s rapidly aging demographic - remains nascent and lacks nationally representative studies; second, existing studies leveraging the China Health and Retirement Longitudinal Study (CHARLS) cohort have largely depended on conventional logistic regression or single-algorithm ML approaches, with ensemble methods that combine multiple learners to improve predictive stability and accuracy remaining unevaluated for CMM prediction; and third, and most critically, prior models have predominantly emphasized clinical and biochemical predictors while systematically omitting psychosocial (e.g., self-rated health expectations), environmental (e.g., cooking fuel type), and subjective health indicators (e.g., pain), which are increasingly recognized as powerful drivers of chronic disease clustering in low- and middle-income settings. To address these gaps, this study aims to: (1) develop and internally validate a stacked ensemble ML model incorporating 42 multidimensional predictors - including clinical biomarkers, physical measurements, lifestyle factors, and, for the first time in CMM prediction, a comprehensive set of psychosocial and environmental variables - using the nationally representative CHARLS cohort; (2) systematically compare the predictive performance of five state-of-the-art algorithms through rigorous internal validation and multiple performance metrics; and (3) identify and rank the most influential determinants of CMM risk, with particular emphasis on quantifying the incremental predictive value of non-traditional, modifiable factors to inform targeted, multi-domain public health interventions in China’s aging population.
METHODS
Study Subjects
The data for this study were derived from the CHARLS, a nationally representative longitudinal survey focusing on Chinese residents aged 45 years and older. CHARLS aims to collect comprehensive information on the social, economic, and health conditions of middle-aged and older adults in China, and it provides a high-quality public database for scientific research supported by the National Development Institute of Peking University. The baseline survey was conducted between 2011 and 2012, with follow-up waves carried out every two years thereafter[14]. The sampling strategy employed a multistage probability proportional to size design, covering 150 counties and 450 communities across all 28 provincial-level regions in mainland China. Households and individuals were randomly selected within sampled communities. For the present analysis, we pooled data from four survey waves (2011, 2013, 2015, and 2018). The initial pool consisted of 25,538 observations. We excluded participants under the age of 45 (n = 5,819) and those with missing data on key CMM diagnoses in 2018 (n = 2,749). After applying these criteria, the final analytical sample comprised 16,970 participants. A flowchart detailing the sample selection process is provided in Supplementary Figure 1A. All CHARLS survey waves received ethical approval from the Peking University Institutional Review Board (IRB). The protocols for the main questionnaire and physical measurements were approved under IRB number IRB00001052-11015, and the biomarker collection was approved under IRB number IRB00001052-11014[15]. All participants provided written informed consent.
Predictors of CMM
Based on established evidence and clinical relevance, a comprehensive set of 42 predictors was selected for training the ML algorithms. These predictors were categorized into three domains for clarity: self-reported questionnaire data, physical examination measurements, and blood-based biomarkers. The self-reported questionnaire encompassed: (1) demographic factors (sex, age, and region)[16]; (2) lifestyle behaviors (night sleep duration, smoking status, and drinking status)[17]; (3) subjective health assessments (presence of pain, recent weight change, recalled health status during childhood, and self-expectations of current health status)[18]; (4) disease history and conditions, including mental health (depression), sensory impairment (hearing and vision), and various chronic conditions (dyslipidemia, liver disease, kidney disease, stomach or other digestive disease, memory-related disease, arthritis or rheumatism, menopause, and prostatic diseases); (5) living environment factors (house structure, primary energy sources for heating and cooking, and subjective assessment of room temperature)[19]; and (6) socioeconomic factors (education level and self-rated standard of living)[20,21]. Objective measurements included: (1) physical examination data: hand grip strength (as a marker of musculoskeletal health), waist circumference, and body mass index (BMI), all indicators of body composition and metabolic risk[22]; and (2) blood biomarker data: a panel of tests capturing inflammation, renal function, and lipid metabolism. This panel included white blood cell count, hemoglobin, platelet count, C-reactive protein (CRP), creatinine, blood urea nitrogen (BUN), uric acid (UA), cystatin C, total cholesterol (TC), triglyceride (TG), high-density lipoprotein cholesterol (HDL-C), and low-density lipoprotein cholesterol (LDL-C)[23,24]. The detailed distribution and measurement methods for all predictor variables are provided in Supplementary Table 1. Except for the self-rated standard of living and weight change variables, which were extracted from the 2013 Wave, all other predictors were derived from the 2015 Wave data to predict the CMM outcomes in the 2018 Wave.
Measurement of CMM
CMM was defined as the presence of two or more of the following cardiometabolic diseases - hypertension, diabetes, heart disease, or stroke - diagnosed by a physician between the 2015 predictor assessment and the 2018 follow-up wave. In this study, CMM status in 2018 was ascertained using self-reported physician-diagnosed disease information collected in the CHARLS questionnaire. The specific conditions considered were: hypertension, diabetes, heart disease (including coronary heart disease, heart failure, or other heart problems), and stroke[25]. The presence of each condition was determined based on affirmative responses to questions such as “Have you been diagnosed with [condition] by a doctor?”. Participants who reported a confirmed diagnosis of two or more of the aforementioned conditions were classified as having CMM. Those who reported none or only one of these conditions were categorized as not having CMM. This operational definition aligns with established approaches for studying multimorbidity in epidemiological research and facilitates the identification of individuals bearing a higher burden of interrelated cardiometabolic conditions.
Statistical analysis
Statistical analyses and predictive modeling were conducted using R version 4.4.2. Continuous variables were summarized as medians with interquartile ranges (IQR), while categorical variables were presented as frequencies and percentages. All predictive modeling was performed using the H2O package (version 3.46.0.6) in R[26]. Additional R packages used included missForest (version 1.5) for imputation, pROC (version 1.18.0) for DeLong’s tests, rms (version 6.7.0) for calibration metrics, and ggplot2 (version 3.4.2) for visualizations. We developed and compared several ML algorithms to predict CMM: the Generalized Linear Model (GLM) with regularization, serving as the benchmark logistic regression model[27]; the Gradient Boosting Machine (GBM), which builds trees sequentially to minimize prediction errors through boosting[28]; the Distributed Random Forest (DRF), an ensemble of decision trees trained on bootstrapped samples to enhance robustness and reduce overfitting[29]; the Deep Learning (DL) model, employing a fully connected multilayer neural network to capture complex nonlinear patterns[30]; and a Stacked Ensemble model (GBM-XGBoost-GLM-DL-DRF) (XGBoost = Extreme Gradient Boosting). The Stacked Ensemble model combined the predictions of the four base learners (GLM, GBM, DRF, DL) using a meta-learner to synthesize their strengths and improve overall predictive performance[31]. Specifically, we employed logistic regression as the meta-learner, using the cross-validated predicted probabilities from the four base models as input features. The meta-learner was trained with 5-fold cross-validation on the training set to optimize its parameters, and the final output was the predicted probability of CMM. The study process is shown in Supplementary Figure 1B. Prior to model development, the dataset underwent several preprocessing steps. Missing values were imputed using the random forest-based multiple imputation algorithm (missForest) with five imputations; the first imputed dataset was used for analysis. Continuous predictor variables were standardized to have a mean of 0 and a standard deviation of 1 based on the means and standard deviations of the training set. Crucially, all preprocessing steps - including imputation, normalization, and over-sampling - were performed using only the training set, and the resulting parameters were then applied to the testing set. To ensure internal evaluation, the data were randomly split into a training set (80%) for model development and a testing set (20%) for final validation. Given the imbalanced distribution of the CMM outcome (ratio approximately 1:3.5), we applied the Synthetic Minority Over-sampling Technique (SMOTE) to the training data to mitigate potential bias and enhance the model’s sensitivity in identifying the minority class (CMM cases)[32]. Hyperparameters for each algorithm were tuned using 5-fold cross-validation on the training set to optimize performance and prevent overfitting[33]. A random search strategy was employed over a pre-specified hyperparameter grid. Model performance was evaluated on the independent testing set. The area under the receiver operating characteristic curve (AUC) served as the primary metric for assessing discriminative ability, interpreted as follows: 0.5-0.7 (poor), 0.7-0.8 (acceptable), 0.8-0.9 (good), and > 0.9 (excellent)[34]. Calibration curves were plotted to visualize the agreement between predicted probabilities and observed outcomes[35]. In addition to graphical assessment, we quantitatively evaluated calibration using the calibration intercept, calibration slope, and the Spiegelhalter Z-test. The Brier score was calculated to quantify the overall prediction error, with scores closer to 0 indicating better calibration[36]. Conventionally, a Brier score below 0.25 is considered indicative of acceptable model performance. Additional performance metrics derived from the confusion matrix - including accuracy, precision, true positive rate (TPR), and F1-score (the harmonic mean of precision and recall) - were reported for a comprehensive assessment. Finally, variable importance analysis was performed for the best-performing models to identify and rank the key predictors contributing most significantly to CMM prediction.
RESULTS
Geographical Distribution of CMM
The geographic distribution of CMM prevalence among middle-aged and older adults across Chinese provinces is presented in Figure 1. Analysis revealed marked regional disparities. The highest prevalence was observed in Tianjin (46/96, 47.9%), Xinjiang Uygur Autonomous Region (30/70, 42.9%), Shanghai (20/49, 40.8%), Inner Mongolia Autonomous Region (305/753, 40.5%), and Heilongjiang (104/281, 37.0%). Conversely, the lowest prevalence was found in Guizhou (18/176, 10.2%), Fujian (60/451, 13.3%), Guangdong (104/796, 13.1%), Guangxi (76/544, 14.0%), and Chongqing (35/254, 13.8%). The remaining provinces exhibited moderate CMM prevalence rates, ranging from approximately 15% to 35%. Detailed prevalence data for each province are provided in Supplementary Table 2.
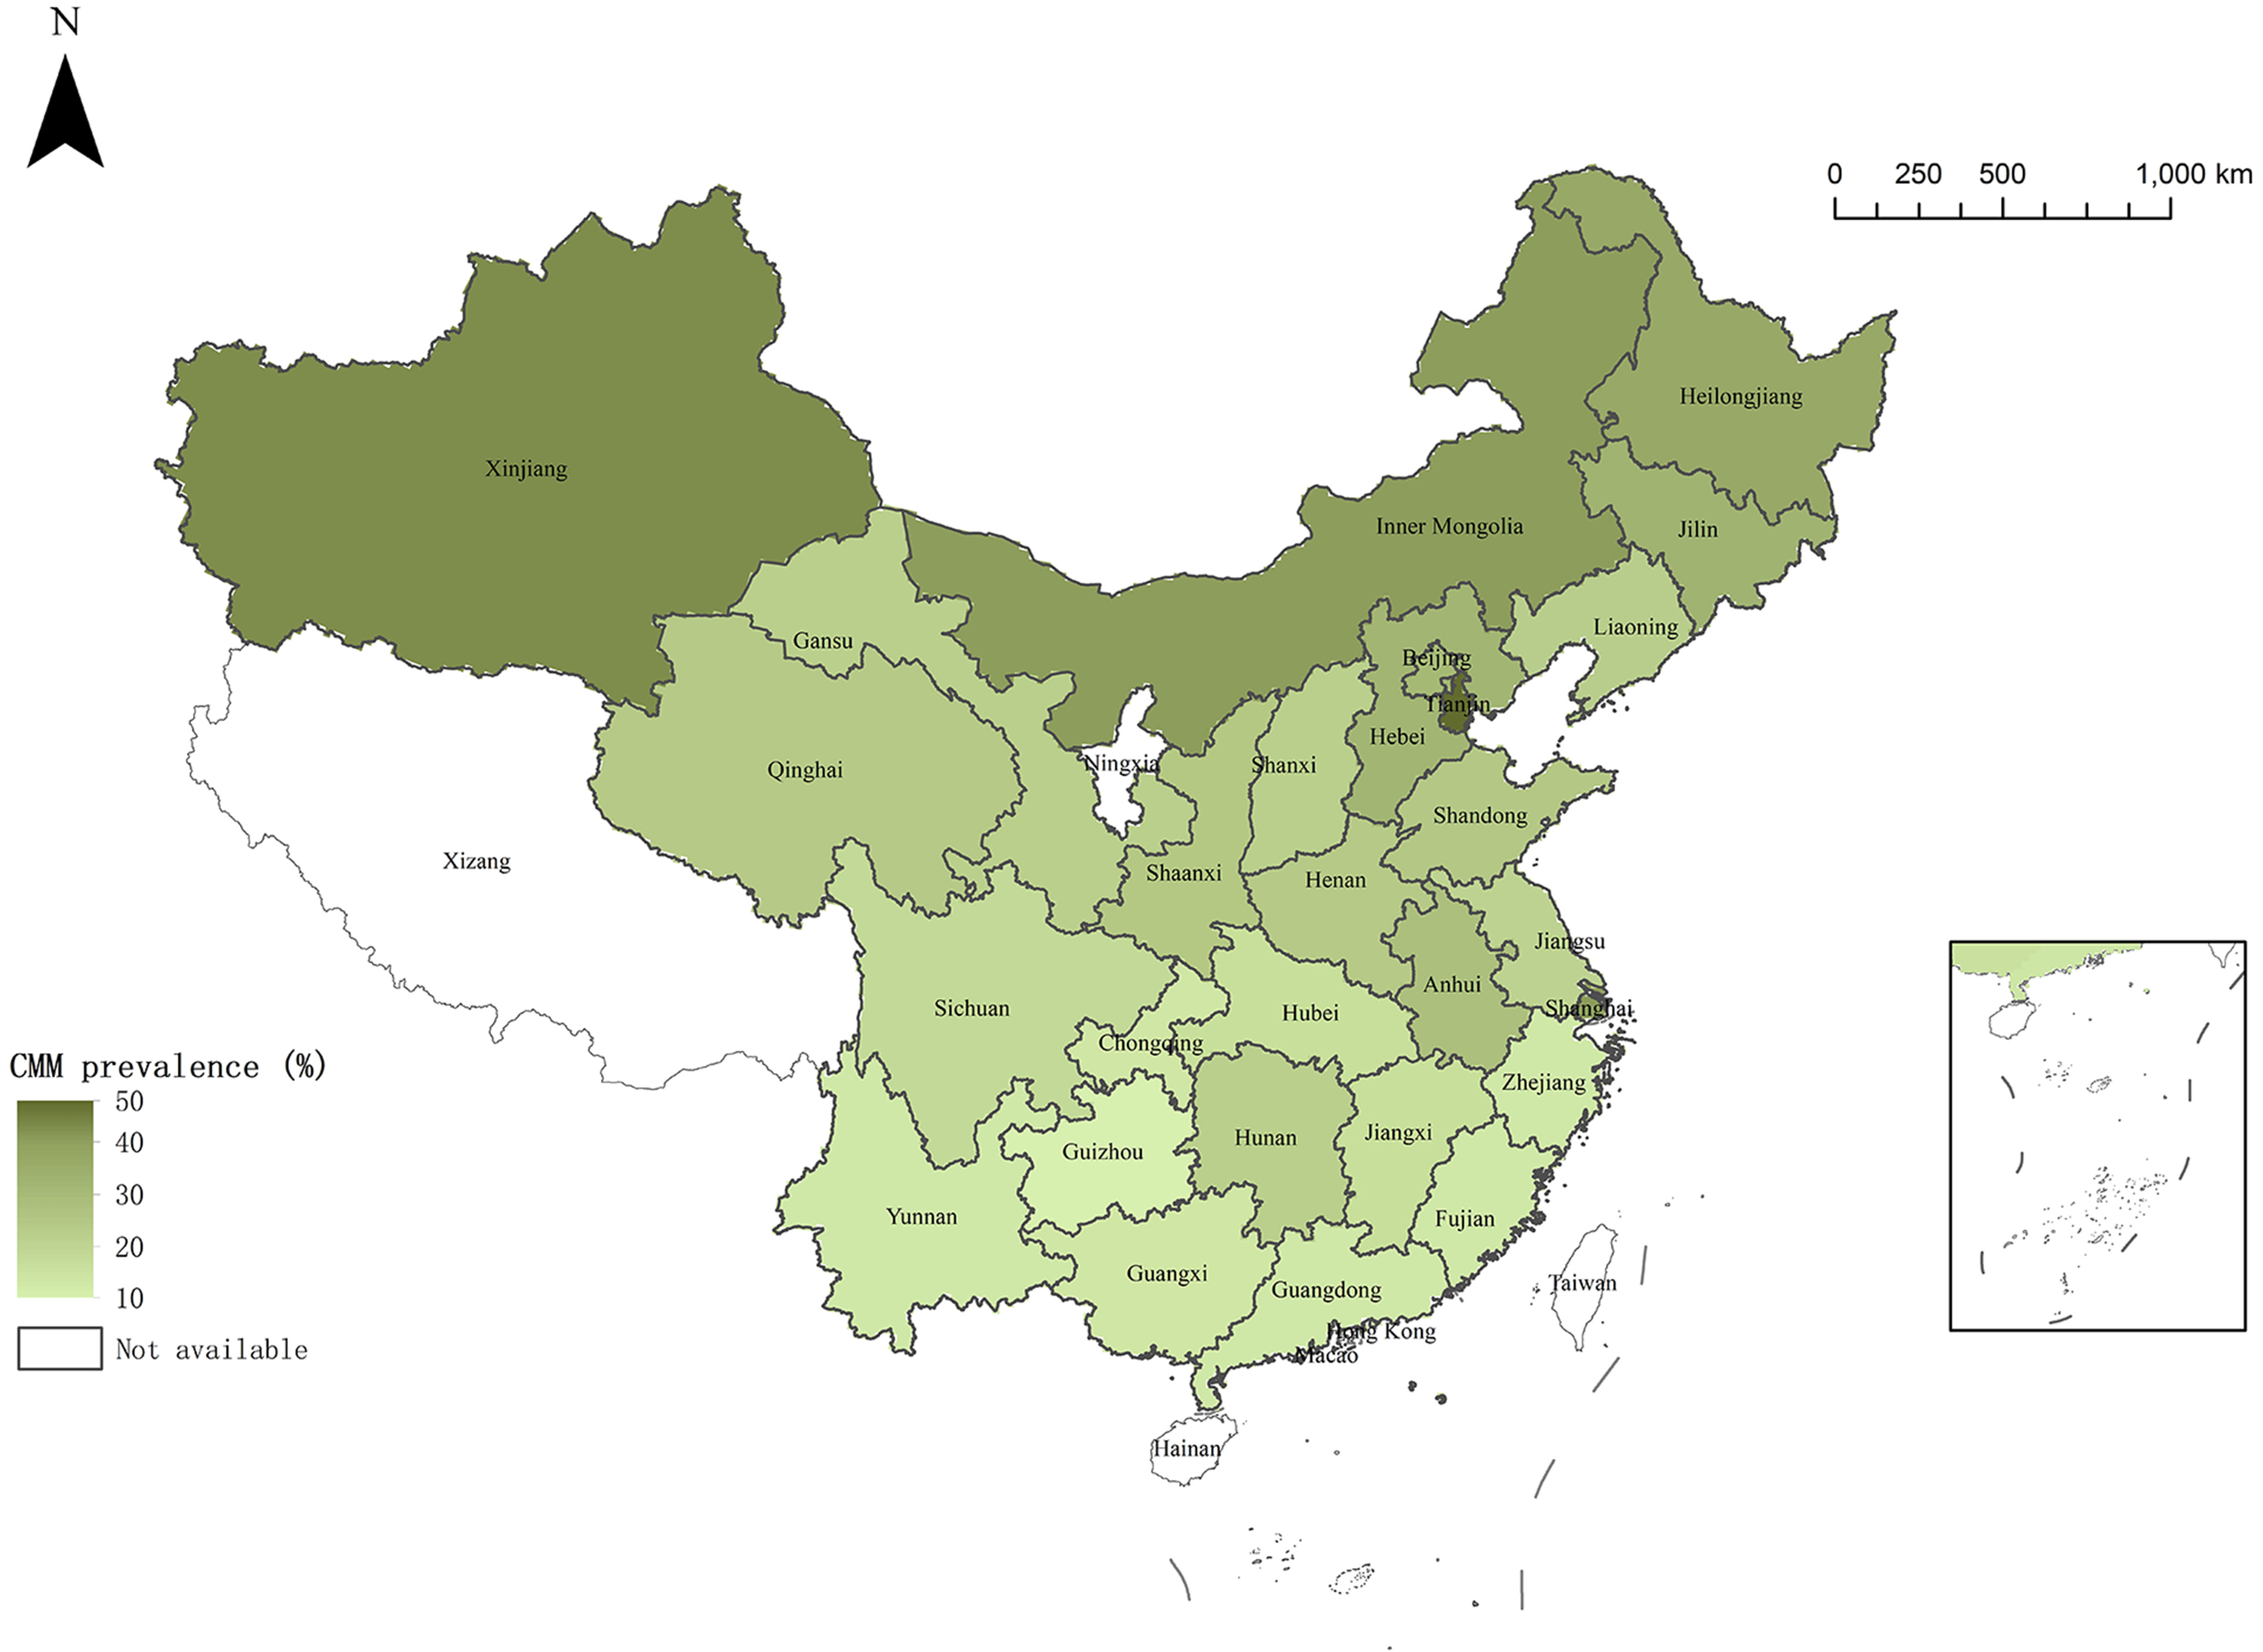
Figure 1. The prevalence of cardiometabolic multimorbidity (CMM) by province in China from the China Health and Retirement Longitudinal Study in 2018. This map was created based on the standard map with the approval number GS(2024)0650 downloaded from the Standard Map Service website of the Ministry of Natural Resources of the People’s Republic of China (http://bzdt.ch.mnr.gov.cn/). The base map has not been modified.
Characteristics of the study participants
The final analytic sample comprised 16,970 individuals aged 45 years and older from the CHARLS. Among them, 22.0% (n = 3,737) were identified as having CMM. The sample was divided into a training set (n = 13,577, 80%) for model development and a testing set (n = 3,393, 20%) for validation. Selected demographic and socioeconomic characteristics of the participants are presented in Table 1. The prevalence of CMM increased significantly with age, from 20.6% in the 45-55 years group to 42.7% in those aged 65 years or older. A higher proportion of females (56.4%) were affected by CMM compared to males (43.6%). Geographically, the central region had the highest proportion of participants with CMM (38.2% of all CMM cases), followed by the eastern and western regions. Participants with lower educational attainment (less than elementary school: 43.4% of CMM cases) and those reporting a poorer standard of living (poor: 14.2% of CMM cases) were more prevalent in the CMM group. The complete distribution of all predictor variables is provided in Supplementary Table 1.
Selected characteristics of the study participants, stratified by cardiometabolic multimorbidity (CMM) status in 2018
| Characteristic | Overall (N = 16,970) | Non-CMM (N = 13,233) | CMM (N = 3,737) | P-value |
| Age | < 0.0001 | |||
| 45-55 | 5,947 (35.04) | 5,177 (39.12) | 770 (20.60) | |
| 55-65 | 5,879 (34.64) | 4,509 (34.07) | 1,370 (36.66) | |
| ≥ 65 | 5,144 (30.31) | 3,547 (26.80) | 1,597 (42.73) | |
| Sex | < 0.0001 | |||
| Male | 8,147 (48.01) | 6,519 (49.26) | 1,628 (43.56) | |
| Female | 8,823 (51.99) | 6,714 (50.74) | 2,109 (56.44) | |
| Regional | < 0.001 | |||
| East | 5,951 (35.07) | 4,661 (35.22) | 1,290 (34.52) | |
| Central | 6,049 (35.65) | 4,620 (34.91) | 1,429 (38.24) | |
| West | 4,970 (29.29) | 3,952 (29.86) | 1,018 (27.24) | |
| Education level | < 0.001 | |||
| Less than elementary school | 7,130 (42.02) | 5,508 (41.62) | 1,622 (43.40) | |
| Elementary school | 4,663 (27.48) | 3,721 (28.12) | 942 (25.21) | |
| Middle school | 3,312 (19.52) | 2,602 (19.66) | 710 (19.00) | |
| High school or above | 1,865 (10.99) | 1,402 (10.59) | 463 (12.39) | |
| Standard of living | < 0.0001 | |||
| Poor | 1,984 (11.69) | 1,455 (11.00) | 529 (14.16) | |
| Relatively poor | 3,009 (17.73) | 2,350 (17.76) | 659 (17.63) | |
| Average | 11,137 (65.63) | 8,784 (66.38) | 2,353 (62.96) | |
| Relatively high | 736 (4.34) | 560 (4.23) | 176 (4.71) | |
| Very high | 104 (0.61) | 84 (0.63) | 20 (0.54) | |
CMM prediction
The performance of the trained models was evaluated on the independent testing dataset. The distribution of predictor variables across the training and testing sets is provided in Supplementary Table 3. The Stacked Ensemble model demonstrated the highest discriminative ability in internal validation, with an AUC of
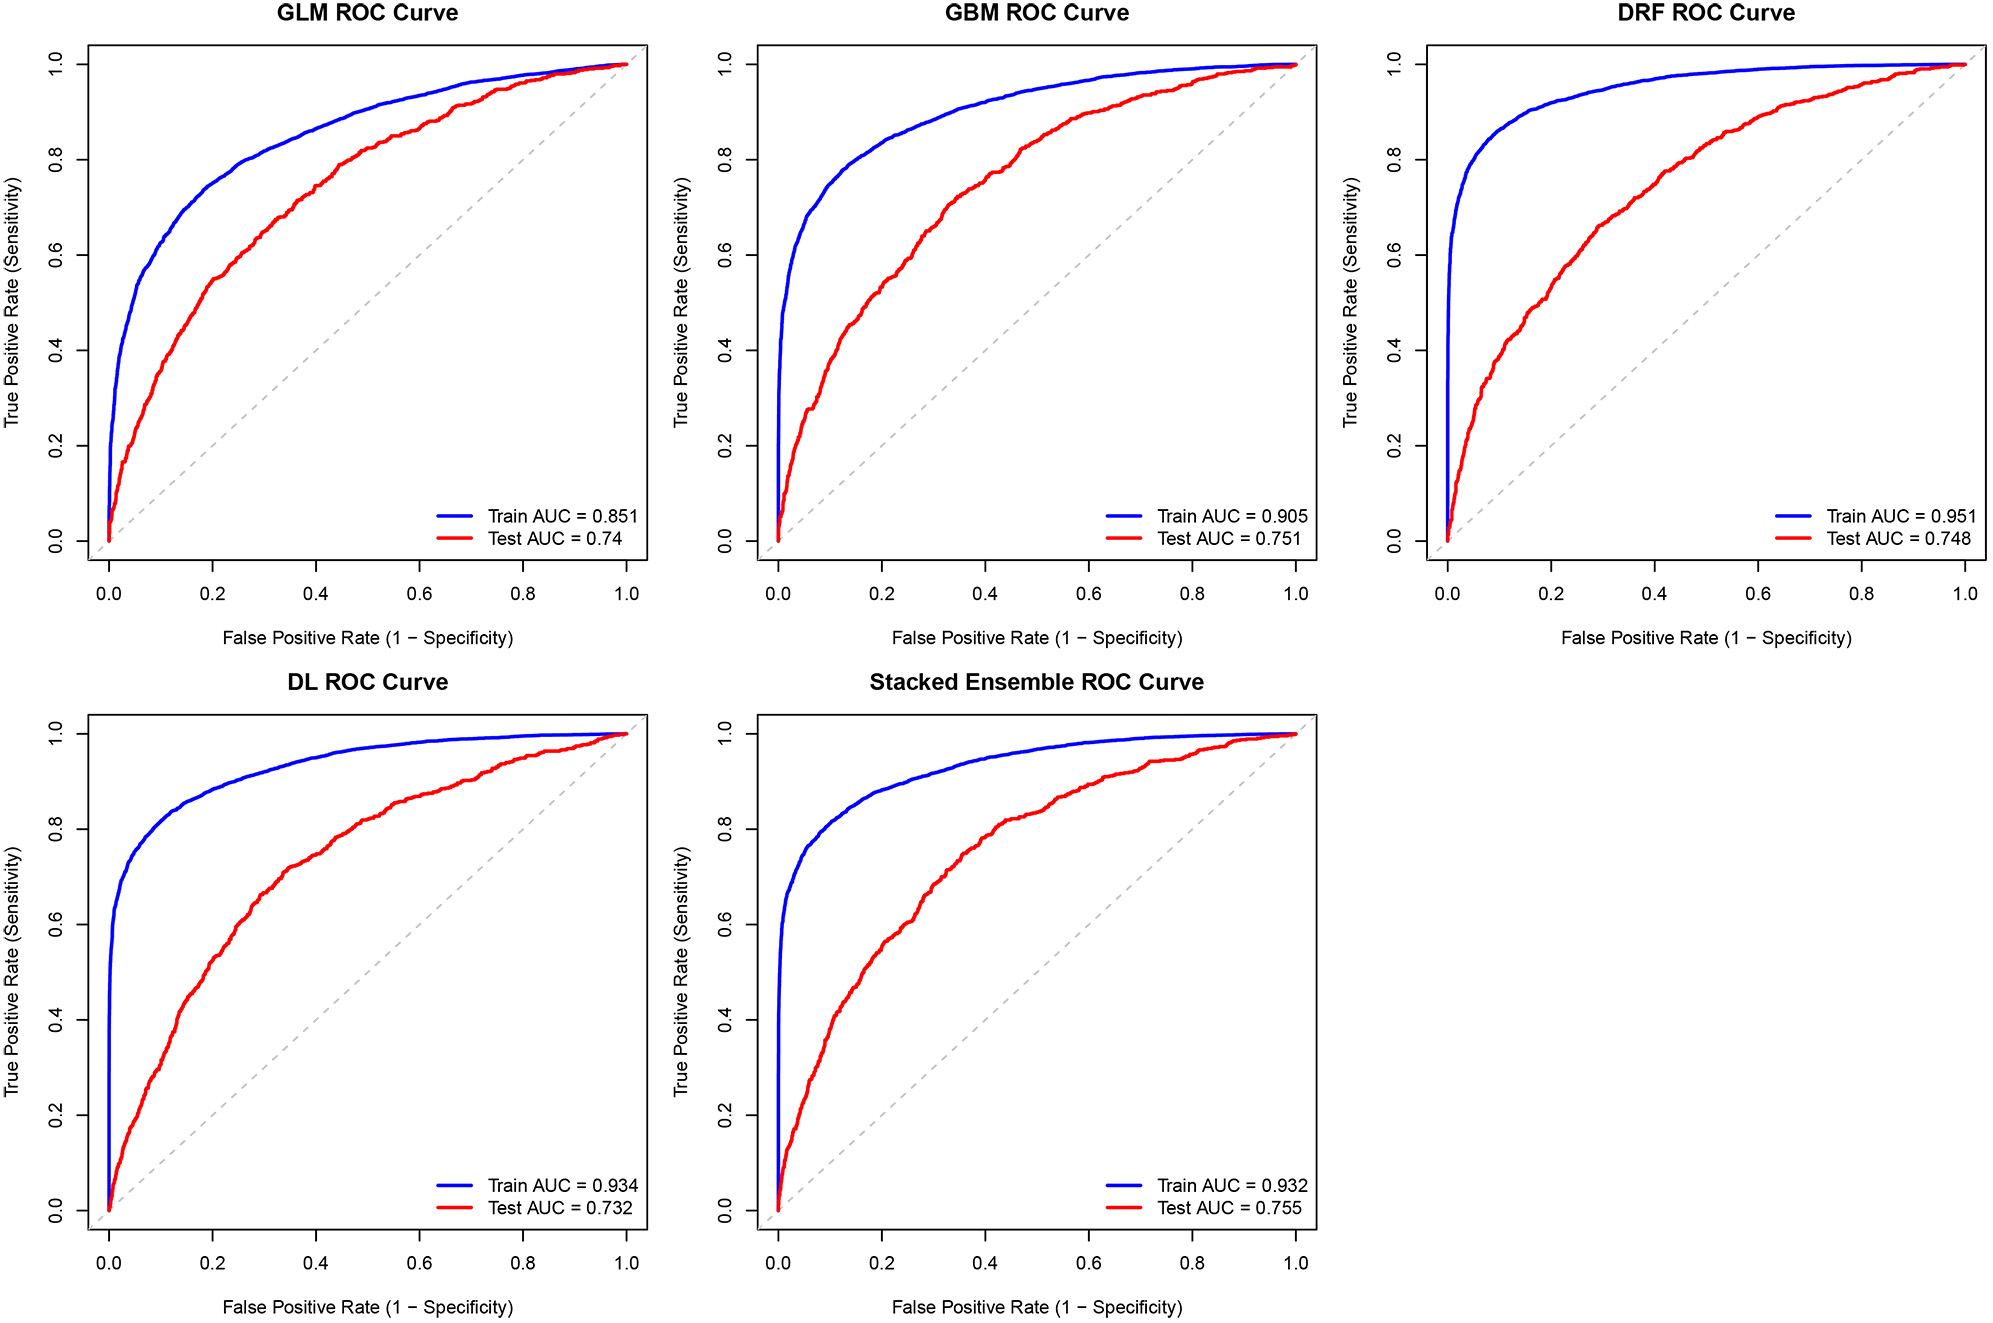
Figure 2. Receiver operating characteristic curves of all cardiometabolic multimorbidity (CMM) prediction models on the training and testing datasets. AUC: Area under the curve; DL: deep learning; DRF: distributed random forest; GBM: gradient boosting machine; GLM: generalized linear model; ROC: receiver operating characteristic; Stacked Ensemble: GBM-XGBoost-GLM-DL-DRF.
Assessing the efficacy of ML models for CMM prediction
The calibration curves for all models, which plot predicted probabilities against the observed frequencies of CMM in the testing dataset, are presented in Figure 3. These curves visually assess the agreement between the models’ predictions and the actual outcomes. The search space and the final selected hyperparameters for each model are detailed in Supplementary Table 5. Quantitative calibration metrics are summarized in Supplementary Table 6 and displayed on each calibration curve facet. The Stacked Ensemble model demonstrated excellent calibration, with an intercept of -0.02 [95% confidence interval (CI): -0.15, 0.11], a slope of 0.96 (95%CI: 0.88, 1.04), and a non-significant Spiegelhalter Z-test (Z = 0.74, P = 0.46), indicating no evidence of systematic miscalibration. To quantify this calibration performance, the Brier score was calculated for each model. As shown, all models achieved Brier scores well below 0.25, confirming their good reliability in predicting CMM risk. The Stacked Ensemble, GBM, and DRF models demonstrated the best calibration, both with a Brier score of 0.153.
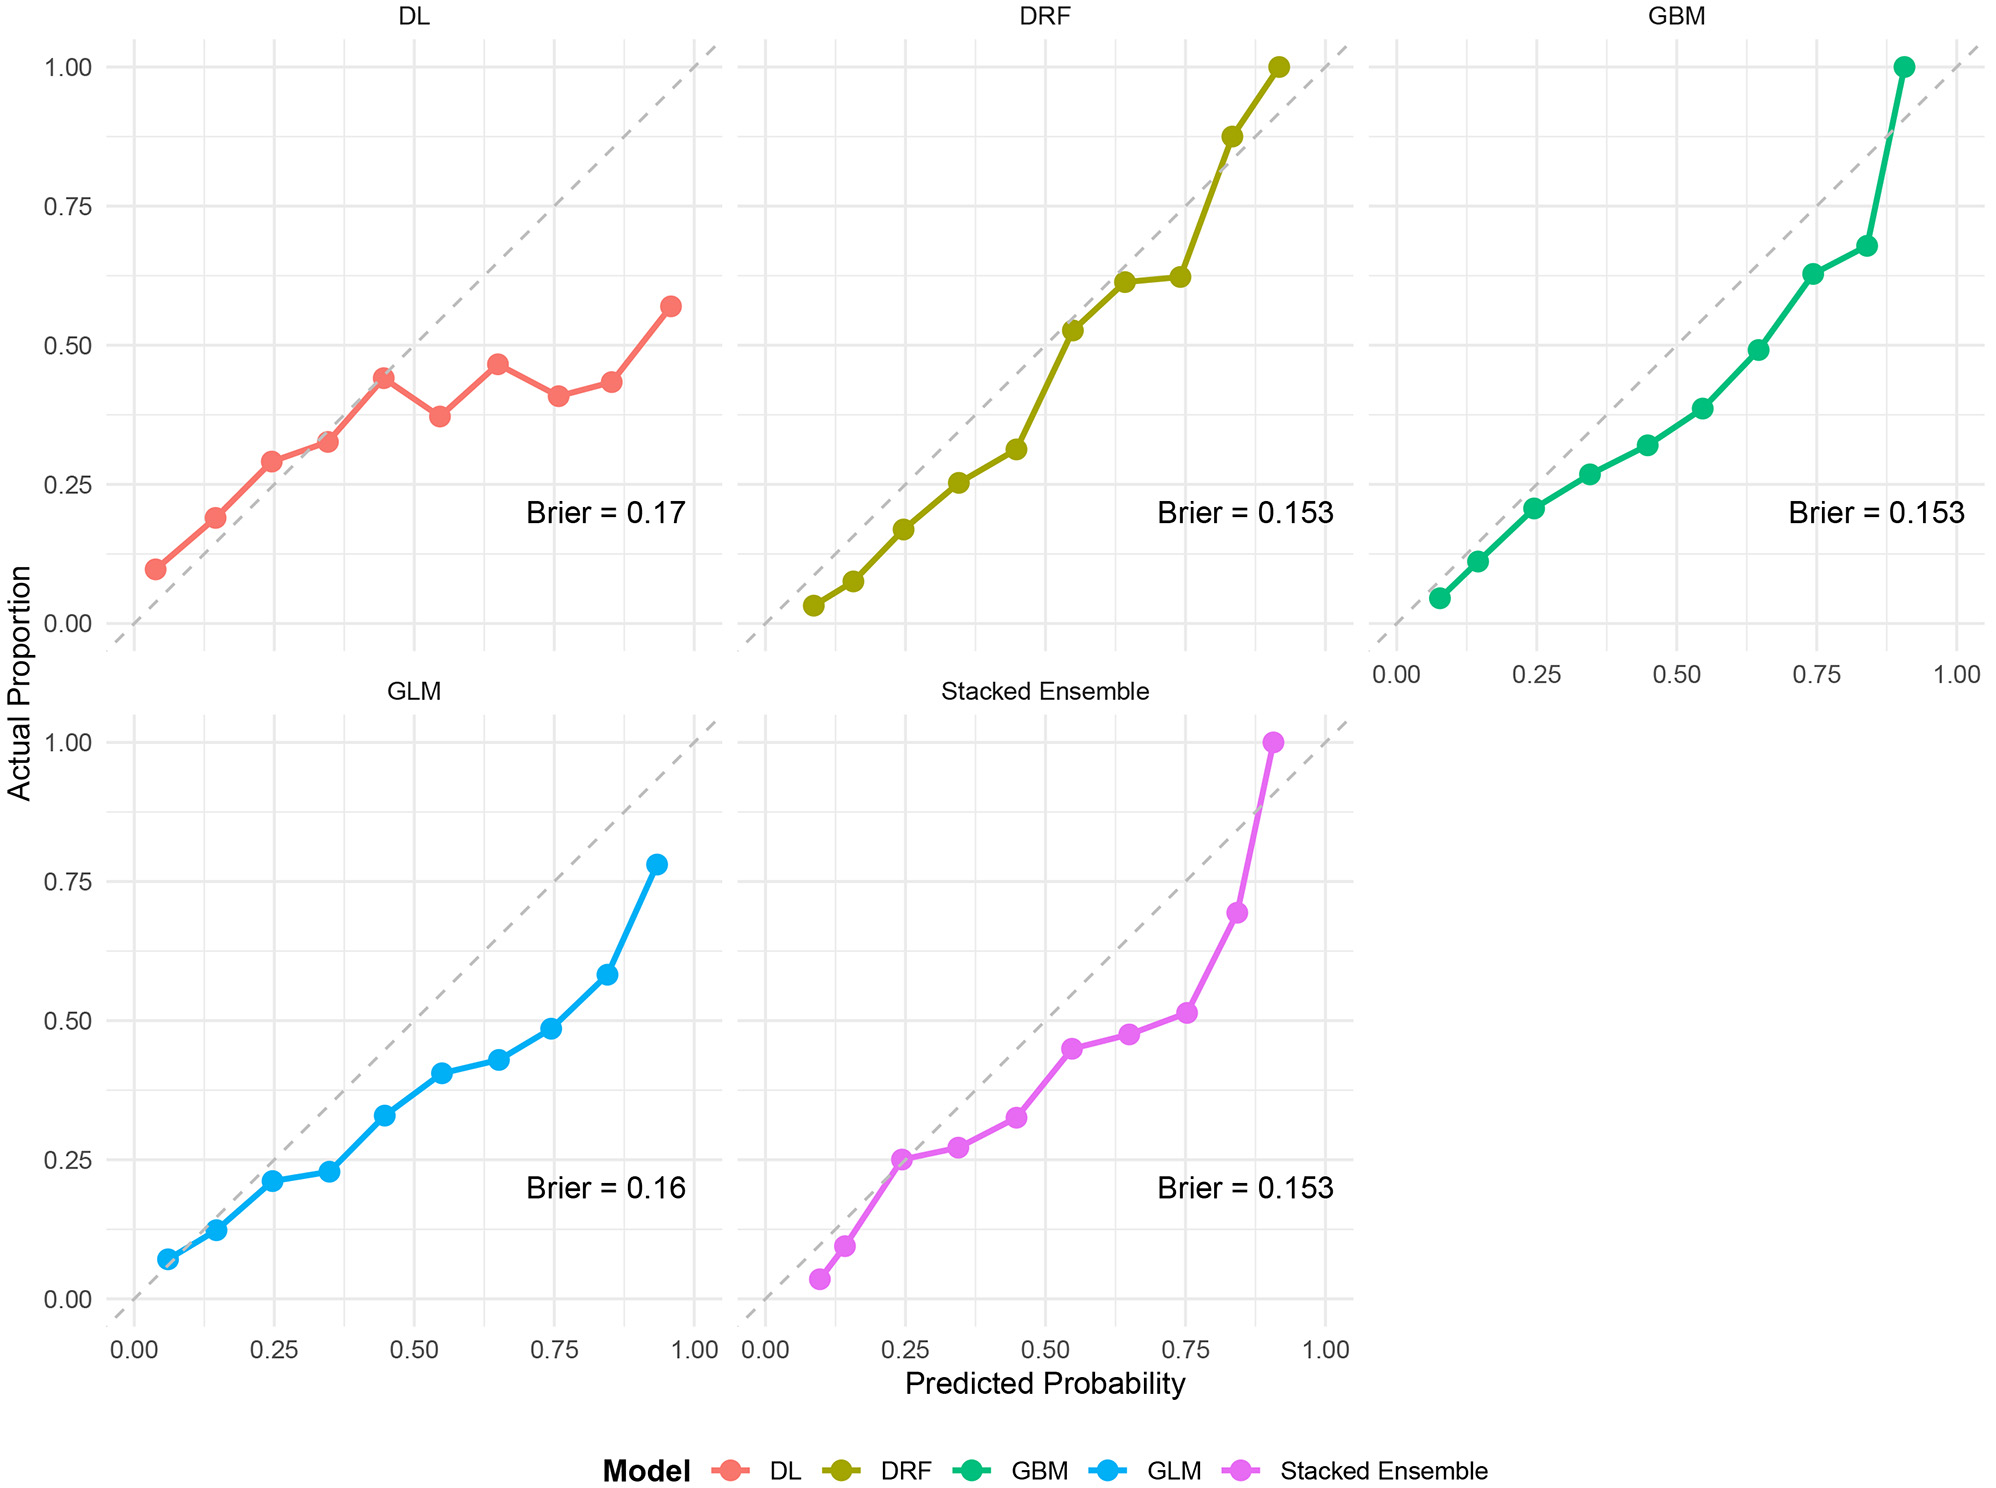
Figure 3. The calibration curves of all cardiometabolic multimorbidity (CMM) prediction models on the testing dataset. DL: Deep learning; DRF: distributed random forest; GBM: gradient boosting machine; GLM: generalized linear model; Stacked Ensemble: GBM-XGBoost-GLM-DL-DRF.
Determinants of CMM
The GBM and DRF models, which demonstrated the highest predictive performance among the single models, identified a consistent set of predictors for CMM in the variable importance analysis [Figure 4]. Dyslipidemia was the most important predictor in both models. Age, TG, HDL-C, waist circumference, self-expectations of health status, pain, cooking energy type, weight change, and cystatin C were also identified as key factors in both algorithms. The prominence of self-rated health expectations and pain suggests that patients’ subjective experiences and perceptions capture important dimensions of risk not fully reflected in objective clinical measures, highlighting the potential value of incorporating patient-reported outcomes into routine CMM screening. The inclusion of cooking energy type - a proxy for indoor air pollution - underscores the role of environmental exposures in cardiometabolic risk and points to potential interventions beyond the healthcare setting. These results highlight the central role of metabolic health, body composition, lifestyle factors, and self-perceived health in the development of CMM among aging adults in China.
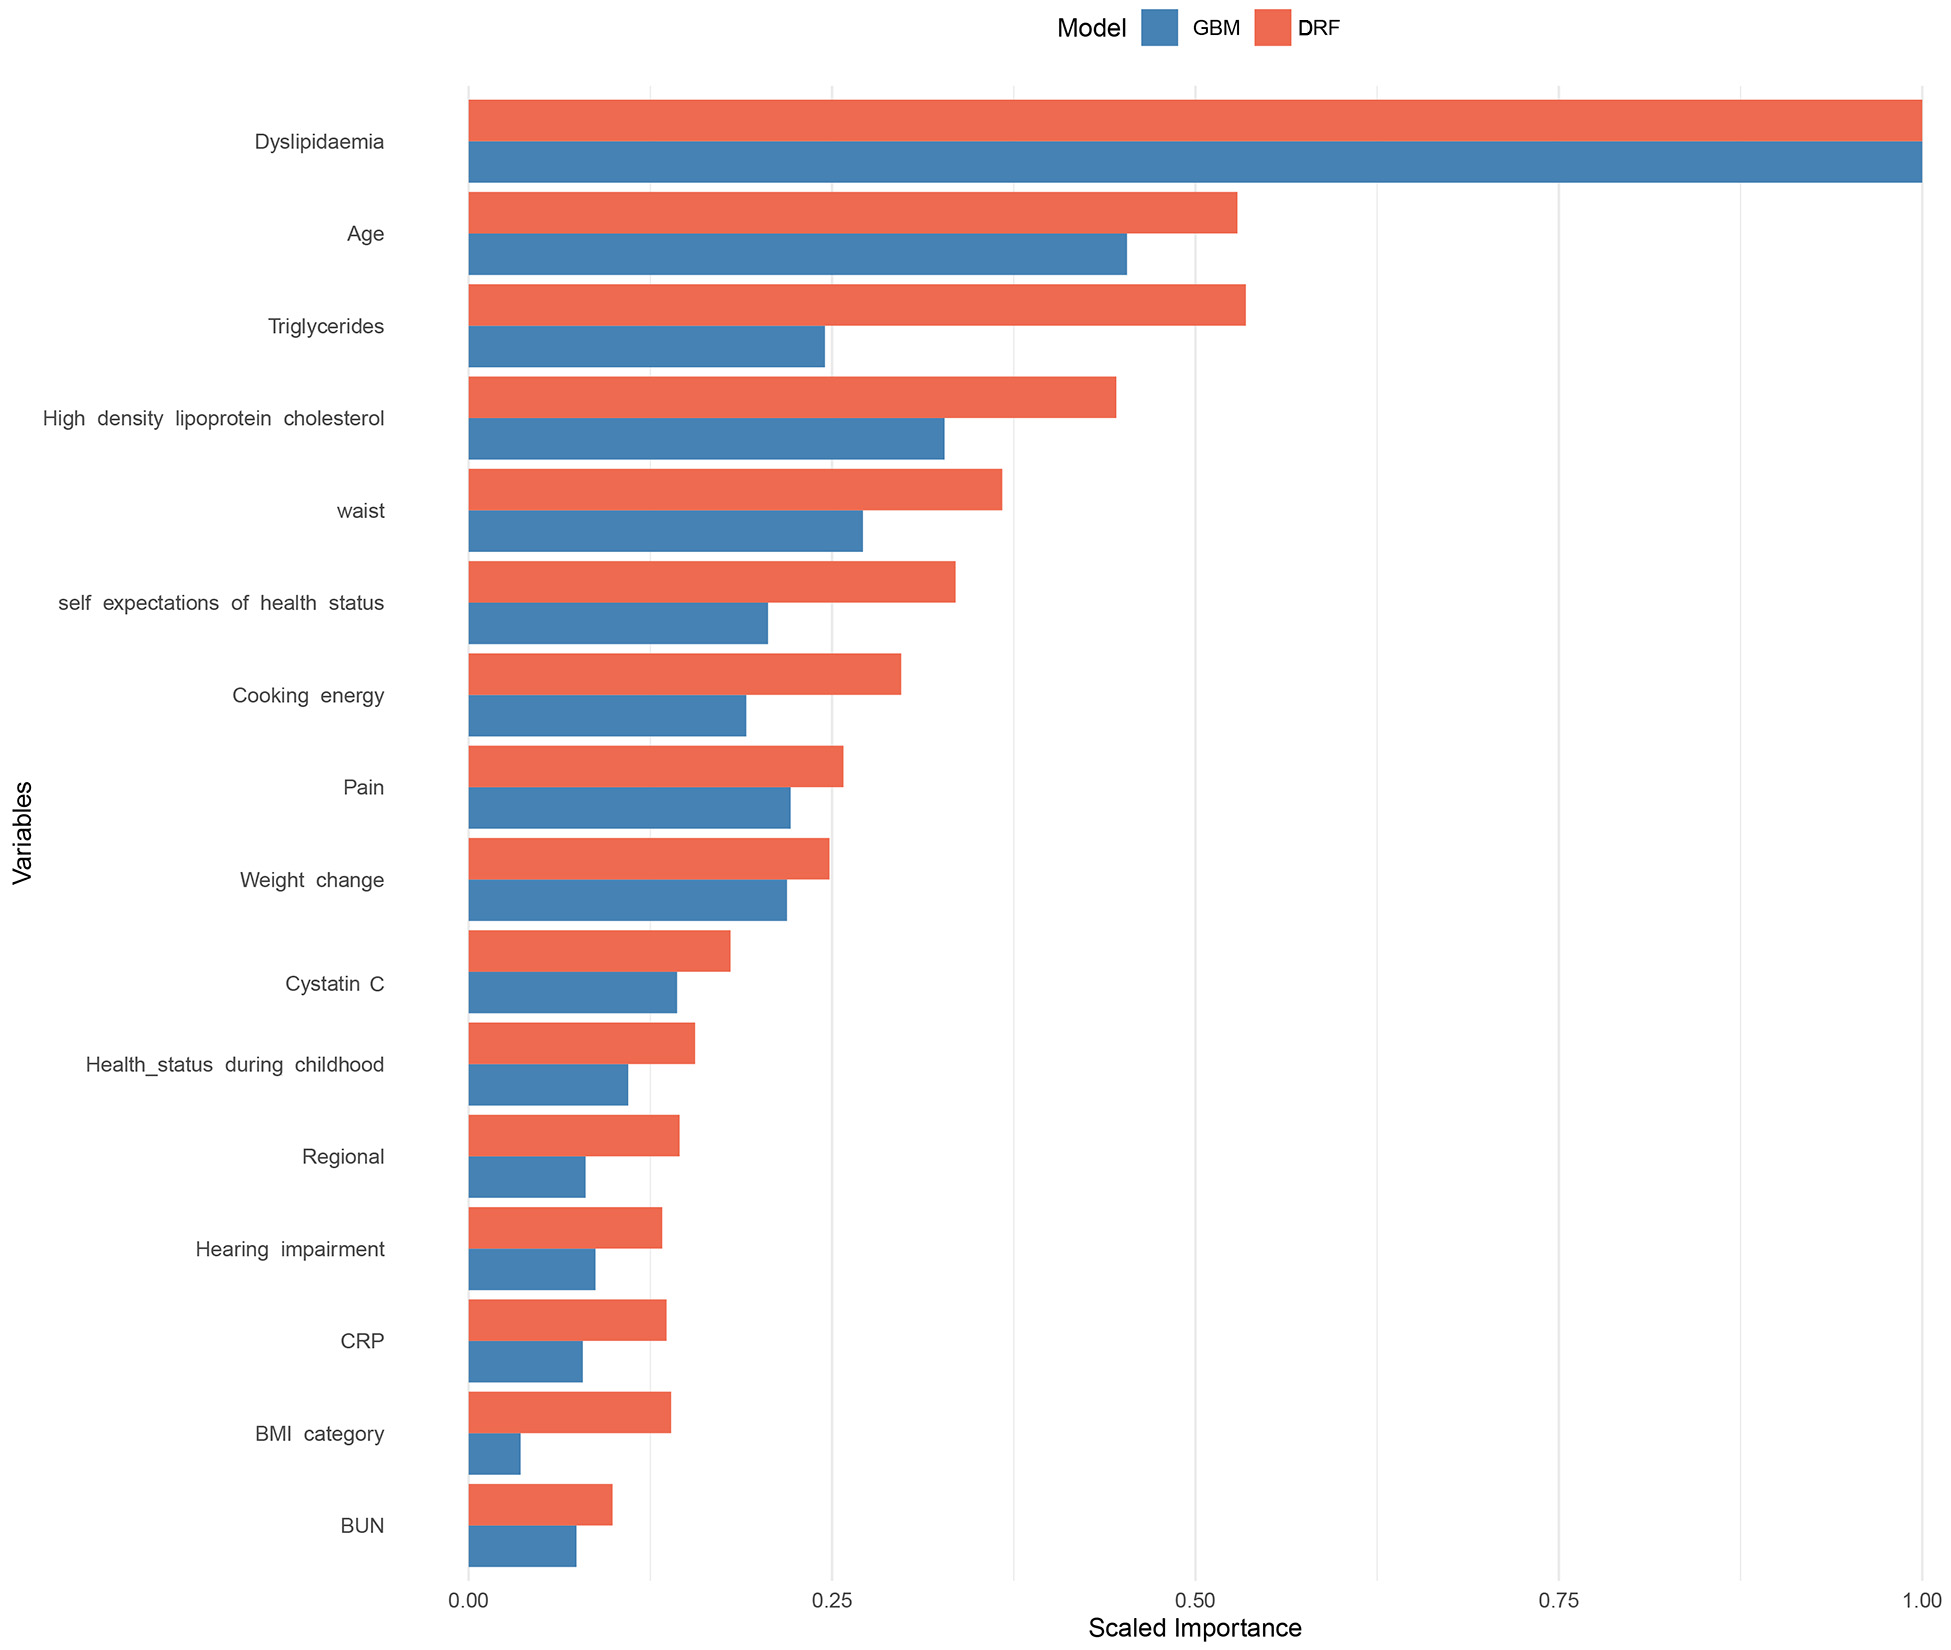
Figure 4. Variable importance analysis performed by the distributed random forest (DRF) and gradient boosting machine (GBM) model. BMI: Body mass index; CRP: C-reactive protein; BUN: blood urea nitrogen.
DISCUSSION
Comparison with existing research results
Our stacked ensemble model achieved an AUC of 0.755, which falls within the acceptable range (0.7-0.8) and outperforms most prior CMM prediction models based on similar populations. For example, Zhu et al. employed ML algorithms - including logistic regression and Gaussian Naive Bayes - on both the CHARLS and Health and Retirement Study (HRS) cohorts to predict CMM and achieved an AUC of approximately 0.70[12]. While informative, their models relied primarily on conventional algorithms and demonstrated limited improvement over baseline methods. In contrast, our ensemble model - leveraging gradient boosting, random forests, and other learners - achieved higher predictive accuracy while maintaining interpretability. Moreover, our model exhibited improved calibration, as evidenced by a lower Brier score (0.153), indicating a better match between predicted risks and observed outcomes. In another recent study, Mao et al. applied a network-based ML approach to cross-sectional National Health and Nutrition Examination Survey (NHANES) data and reported an exceptionally high AUC of 0.988[11]. While this result appears impressive, it is important to note that their model was trained and tested on cross-sectional data, which may overestimate performance due to a lack of temporal separation between predictors and outcomes. Additionally, network-based models often entail high model complexity and reduced generalizability, especially when deployed in longitudinal or real-world clinical settings. In comparison, our model was trained on temporally structured, longitudinal data and validated on a temporally distinct test set, which more closely mirrors practical deployment scenarios.
Importantly, our model confirms and extends existing evidence regarding key risk factors for CMM. Consistent with prior studies, age, dyslipidemia, and central obesity (as measured by waist circumference) emerged as dominant predictors[12,37]. However, our inclusion of TG, HDL-C, and cystatin C - biomarkers often underrepresented in traditional risk models - highlighted the potential utility of expanded biochemical profiling in improving prediction accuracy. For instance, the identification of cystatin C, a marker of renal function, as a top contributor aligns with recent studies suggesting its role in systemic inflammation and cardiovascular-renal metabolic syndromes (Li et al.), indicating a shared pathophysiological pathway across organ systems[38]. Furthermore, our study uniquely emphasizes the predictive value of self-rated expectations of health, subjective pain reports, and cooking fuel types. These variables are often overlooked in clinical or epidemiological risk models yet showed high importance in our GBM and DRF models. This finding echoes insights (Ji et al.)[39], while chronic pain reflects low-grade systemic inflammation, a known contributor to cardiometabolic risk (Xu et al.)[40]. The inclusion of indoor air pollution proxies - such as cooking energy type - is especially relevant in the Chinese context, where solid fuel use remains prevalent in rural and peri-urban areas and has been linked to hypertension and metabolic disorders through oxidative stress pathways (Smith et al.)[41]. The significance of such environmental factors underscores the importance of tailoring prediction models to local contexts.
Notably, our study found a relatively modest AUC for DL (AUC = 0.732) compared to ensemble methods. This aligns with the broader literature, which has highlighted that in tabular health data with limited sample sizes and strong domain-specific structure, traditional ensemble learners often outperform deep neural networks (Miletic et al.)[42]. Our ensemble strategy, which synthesized the strengths of diverse learners, ultimately enhanced predictive performance while maintaining interpretability through feature importance analyses. Another novel aspect of our work is the regional heterogeneity in CMM prevalence. While regional variation in chronic disease burden has been previously reported in China (Su et al.)[43], our data-driven visualization reveals specific provinces - such as Tianjin, Inner Mongolia, and Xinjiang - with disproportionately high CMM prevalence. This spatial pattern may reflect differences in healthcare access, urbanization level, lifestyle, air pollution, and ethnic diversity, suggesting that region-specific risk models or public health strategies may be warranted[44]. While most Western studies rely on electronic health records or clinical trial cohorts, our use of CHARLS - a community-based, longitudinal dataset - provides greater population-level generalizability. Moreover, by incorporating socioeconomic and environmental dimensions (e.g., education, heating fuels), we bridge the gap between clinical risk modeling and social determinants of health, which are particularly salient in aging societies facing urban-rural disparities such as China[45].
Beyond these comparisons, our study offers three distinct and substantive advances. First, we provide the first empirical quantification of the incremental predictive value of psychosocial, environmental, and subjective health indicators for CMM in a large, nationally representative Chinese cohort. Second, this study represents the first systematic benchmarking of five diverse ML algorithms - including stacked ensemble - for CMM prediction in China’s aging population, establishing ensemble tree-based methods as the current optimal approach for this task. Third, we present the first province-level prevalence map of CMM among middle-aged and older Chinese adults, revealing marked geographic disparities and providing an actionable evidence base for regionally targeted public health interventions. Collectively, these contributions move beyond incremental application of ML to fundamentally expand the conceptual scope of CMM risk prediction by integrating psychosocial, environmental, and geospatial dimensions.
Strengths and limitations
A major strength of our study is the integration of rich multidimensional data from CHARLS, allowing us to examine not only biological and clinical predictors but also behavioral, psychosocial, and environmental factors. The use of ML approaches enabled the capture of complex, nonlinear interactions among predictors, which traditional regression models may fail to uncover. The ensemble model’s superior performance highlights the value of combining diverse learning strategies for robust risk prediction. Additionally, our study addresses the issue of class imbalance through SMOTE, ensuring that minority-class instances (CMM cases) are adequately learned by the model. This step is crucial given the typically lower prevalence of multimorbidity relative to non-cases, and it enhances the model’s practical utility in identifying high-risk individuals.
Nonetheless, some limitations merit attention. First, the CMM outcome was based on self-reported physician diagnoses, which may be affected by recall or reporting bias. Although previous CHARLS-based validation studies support the accuracy of self-reported chronic conditions, the absence of objective clinical or laboratory confirmation limits the precision of the outcome definition. Second, most predictors were obtained from a single time point (2013 or 2015), while CMM status was assessed in 2018. This cross-sectional approach precludes capturing time-varying risk dynamics. Future work should explore longitudinal modeling frameworks that incorporate changes in risk profiles over time. Third, although we addressed class imbalance through SMOTE and used internal testing for validation, the model has not yet been externally validated in independent cohorts - either in China or internationally. Without such external testing, the generalizability and transportability of our prediction tool remain uncertain. Fourth, while some interpretability was introduced via variable importance ranking, ML models - especially ensemble and DL methods - are often criticized for their “black box” nature. Clinicians may require further interpretive tools or simplified models before real-world adoption. Fifth, potential residual confounding may persist due to unmeasured variables such as dietary patterns, environmental toxins, social support networks, or medication use. These were not captured in the CHARLS dataset and should be considered in future iterations. Sixth, we also note that the AUCs on the training set were higher than those on the test set, which is partly attributable to the application of SMOTE on the training data; nevertheless, the test set AUCs remained at an acceptable level and the relative performance of the models was consistent. Finally, the observational design of our study prevents any causal inference. While associations were identified, they should not be construed as evidence of causality without further mechanistic or interventional studies.
Implications for practice and research
Future efforts integrating the demonstrated predictive value of non-traditional factors - such as self-rated health expectations, chronic pain, and household air pollution proxies - highlight the need to adopt a more holistic approach to chronic disease risk assessment in primary care and public health settings. These findings suggest that effective CMM prevention must extend beyond clinical risk factor modification to address psychosocial well-being and environmental exposures. For example, interventions could combine routine screening for depression and chronic pain with referral pathways to mental health and pain management services, while simultaneously promoting access to clean cooking fuels through community-level programs or policy initiatives. Incorporating psychosocial and environmental factors into screening tools may improve early detection of individuals at risk of CMM. Second, the successful application of ML models in a nationally representative sample suggests that such tools could be feasibly integrated into digital health platforms or community screening programs in China. By identifying individuals at highest risk and the specific drivers of that risk, these models could enable truly personalized, multi-domain intervention packages that address medical, psychological, and environmental needs concurrently - moving beyond the concept of “systemic lifestyle intervention” to a more precise and actionable framework of “multi-level risk‐tailored prevention”. With appropriate validation and refinement, our model could support resource allocation by identifying high-risk groups for targeted interventions, particularly in underserved or high-prevalence regions identified by our geographic analysis. Third, our results underscore the importance of intersectoral collaboration in addressing multimorbidity. Given the influence of living conditions and health perceptions on disease risk, interventions that combine medical care with social support, environmental regulation, and health education may yield greater effectiveness than siloed clinical approaches. Fourth, we acknowledge that some predictors (e.g., dyslipidemia, kidney and liver disease) are conceptually linked to CMM components. However, our goal was risk prediction - not causal inference. Their inclusion is justified by temporal precedence (measured 3 years prior) and their value in short-term risk stratification. The model is intended for individuals with existing metabolic or renal abnormalities, rather than for lifelong primary prevention. Fifth, a key limitation is our reliance on internal validation only. Given the cultural, environmental, and genetic heterogeneity across Chinese regions - as reflected in the regional disparities in CMM prevalence - the model’s generalizability remains uncertain. Future studies must validate it in independent, geographically diverse populations. We also acknowledge that some predictors may capture overlapping physiological constructs; however, the ensemble tree-based algorithms used in this study are inherently robust to multicollinearity, and our primary focus is on predictive accuracy rather than estimation of independent effects. Finally, our study opens avenues for future mechanistic research. Additionally, investigating gene-environment interactions or integrating imaging/genomic data into ML models could further enhance prediction. Given the global trend of population aging, international comparative studies using similar modeling frameworks could elucidate cross-cultural patterns and determinants of multimorbidity.
In conclusion, in this study, we developed and validated a robust ML model to predict CMM among China’s aging population using data from the nationally representative CHARLS cohort. By integrating multidimensional predictors - including clinical biomarkers, physical measurements, self-reported health status, and environmental factors - our ensemble learning approach achieved favorable predictive performance and highlighted both established and novel determinants of CMM risk. The findings emphasize the critical roles of metabolic, renal, and other factors in chronic disease risk prediction and provide actionable insights for public health screening, early prevention, and resource allocation in aging societies. Future studies should focus on external validation across diverse populations, particularly in southern and western China, incorporation of dynamic longitudinal data, and integration into digital health tools for real-world clinical application.
DECLARATIONS
Acknowledgments
This analysis uses data or information from the Harmonized CHARLS dataset and Codebook, Version D as of June 2021. The Harmonized CHARLS was funded by the National Institute on Aging (R01AG030153, RC2AG036619, R03AG043052). For more information, please refer to https://g2aging.org/. We also thank the China Center for Economic Research, the National School of Development of Peking University, for providing the data. Additionally, we sincerely appreciate the YIWANDOU team for their invaluable contribution to data cleaning and processing.
Authors’ contributions
Conceptualization: Li Z, Lü A
Methodology: Li Z, Ren W, Wang W
Software: Li Z, Lü A, An B
Validation: Li Z, Ren W, Fan X
Formal analysis: Li Z, Lü A, Yan Y
Investigation: Bai Y
Resources: Zhao A
Data curation: Li Z, Duan R
Writing - original draft preparation: Li Z, Ren W
Writing - review and editing: Liu S
Visualization: Li Z, Lü A, Wang W
Supervision: Liu S
Project administration: Liu S
Funding acquisition: Liu S
Li Z and Lü A contributed equally to this work and share first authorship.
All authors have read and agreed to the published version of the manuscript.
Availability of data and materials
The dataset supporting the conclusions of this article is available in the CHARLS repository, https://charls.pku.edu.cn/. The Harmonized CHARLS dataset used for variable harmonization is available via the Gateway to Global Aging Data: https://g2aging.org/. All data generated or analyzed during this study are available from the corresponding author upon reasonable request.
AI and AI-assisted tools statement
Not applicable.
Financial support and sponsorship
This work was supported by Collaborative Traditional Chinese and Modern Medicine for Chronic Disease Management Research Project (No. CXZH2024085); Shanxi Province Metabolic Disease (Type 1 Diabetes) Clinical Medical Research Center (No. 20240410501001); Shanxi Province Science and Technology Achievements Transformation Guidance Special Fund (No. 202304021301066); Shanxi Province Science and Technology Innovation Talent Team Special Plan (No. 202204051002029); Shanxi Province Research Funding for Returned Overseas Scholars (No. 2024-143); Shanxi Province Basic Research Program (No. 202303021212330); Shanxi Province Key Laboratory of Endocrine and Metabolic Diseases (No. 202404010920011).
Conflicts of interest
Liu S is the Guest Editor of the Special Issue entitled “Emerging Mechanisms and Therapeutic Strategies in Diabetic Cardiovascular Disease” in the journal Metabolism and Target Organ Damage. Liu S was not involved in any steps of the editorial process, notably including reviewers’ selection, manuscript handling, or decision-making. The other authors declare that there are no conflicts of interest.
Ethical approval and consent to participate
The data used in this study were obtained from the open-access China Health and Retirement Longitudinal Study (CHARLS). As this is a secondary analysis of de-identified publicly available data, no additional ethical approval was required.
Consent for publication
Not applicable.
Copyright
© The Author(s) 2026.
Supplementary Materials
REFERENCES
1. Chen Y, Yang H, Li D, et al. Association of cardiorespiratory fitness with the incidence and progression trajectory of cardiometabolic multimorbidity. Br J Sports Med. 2025;59:306-15.
2. Fan J, Sun Z, Yu C, et al.; China Kadoorie Biobank Collaborative Group. Multimorbidity patterns and association with mortality in 0.5 million Chinese adults. Chin Med J. 2022;135:648-57.
3. Petrie JR, Guzik TJ, Touyz RM. Diabetes, hypertension, and cardiovascular disease: clinical insights and vascular mechanisms. Can J Cardiol. 2018;34:575-84.
4. Beard JR, Officer AM, Cassels AK. The World Report on Ageing and Health. Gerontologist. 2016;56 Suppl 2:S163-6.
5. Su B, Liu C, Chen L, Wu Y, Li J, Zheng X. Long-term exposure to PM2.5 and O3 with cardiometabolic multimorbidity: evidence among Chinese elderly population from 462 cities. Ecotoxicol Environ Saf. 2023;255:114790.
6. Ding L, Liang Y, Tan ECK, et al. Smoking, heavy drinking, physical inactivity, and obesity among middle-aged and older adults in China: cross-sectional findings from the baseline survey of CHARLS 2011-2012. BMC Public Health. 2020;20:1062.
7. Krentz A, Jacob S, Heiss C, et al.; International Cardiometabolic Working Group. Rising to the challenge of cardio-renal-metabolic disease in the 21st century: translating evidence into best clinical practice to prevent and manage atherosclerosis. Atherosclerosis. 2024;396:118528.
8. He C, Wu F, Fu L, et al. Improving cardiovascular risk prediction with machine learning: a focus on perivascular adipose tissue characteristics. Biomed Eng Online. 2024;23:77.
9. Subramani S, Varshney N, Anand MV, et al. Cardiovascular diseases prediction by machine learning incorporation with deep learning. Front Med. 2023;10:1150933.
10. Krittanawong C, Virk HUH, Bangalore S, et al. Machine learning prediction in cardiovascular diseases: a meta-analysis. Sci Rep. 2020;10:16057.
11. Mao D, Mu J, Li Y, et al. Network-based machine learning reveals cardiometabolic multimorbidity patterns and modifiable lifestyle factors: a community-focused analysis of NHANES 2015-2018. BMC Public Health. 2025;25:2297.
12. Zhu J, Shi Z, Ge Z, et al. Comparative analysis of cardiometabolic multimorbidity predictors in China and the USA: a machine learning approach. Diabetes Res Clin Pract. 2025;229:112938.
13. Mukherjee M, Mukherjee S, Thokala HR, Ali RH. Classifying complex multimorbidity using latent class analysis and machine learning to generate insights into clustering of mental and cardiometabolic conditions. PLoS One. 2025;20:e0335676.
14. Zhao Y, Hu Y, Smith JP, Strauss J, Yang G. Cohort profile: the China Health and Retirement Longitudinal Study (CHARLS). Int J Epidemiol. 2014;43:61-8.
15. Chen X, Crimmins E, Hu PP, et al. Venous blood-based biomarkers in the China Health and Retirement Longitudinal Study: rationale, design, and results from the 2015 wave. Am J Epidemiol. 2019;188:1871-7.
16. Cui Z, Yi X, Huang Y, et al. Effects of socioeconomic status and regional inequality on the association between PM2.5 and its components and cardiometabolic multimorbidity: a multicenter population-based survey in eastern China. Sci Total Environ. 2024;946:174453.
17. Li D, Lin J, Yang H, et al. Causal association of modifiable factors with cardiometabolic multimorbidity: an exposome-wide Mendelian randomization investigation. Cardiovasc Diabetol. 2025;24:241.
18. Yin X, Chen Y, Zhou L, Yang H, Wang Y. Association between chronic pain and risk of cardiometabolic multimorbidity: a prospective cohort study. Reg Anesth Pain Med. 2025;50:858-64.
19. Mou P, Qu H, Guan J, Yao Y, Zhang Z, Dong J. Extreme temperature events, functional dependency, and cardiometabolic multimorbidity: Insights from a national cohort study in China. Ecotoxicol Environ Saf. 2024;284:117013.
20. Li J, Lei L, Wang W, et al. Social risk profile and cardiovascular-kidney-metabolic syndrome in US adults. J Am Heart Assoc. 2024;13:e034996.
21. Li D, Wang L, Zhou Z, et al. Role of socioeconomic, lifestyle, and clinical factors in the progression of cardiometabolic multimorbidity in China: a 10-year prospective cohort study. Nutr Metab Cardiovasc Dis. 2022;32:2383-91.
22. Liu J, Liu W, Wang L, et al. Association of visceral adiposity index and handgrip strength with cardiometabolic multimorbidity among middle-aged and older adults: findings from Charls 2011-2020. Nutrients. 2024:16.
23. Sun H, Wu Z, Wang G, Liu J. Normalized creatinine-to-cystatin C ratio and risk of cardiometabolic multimorbidity in middle-aged and older adults: insights from the China Health and Retirement Longitudinal Study. Diabetes Metab J. 2025;49:448-61.
24. Lai H, Tu Y, Liao C, Zhang S, He L, Li J. Joint assessment of abdominal obesity and non-traditional lipid parameters for primary prevention of cardiometabolic multimorbidity: insights from the China health and retirement longitudinal study 2011-2018. Cardiovasc Diabetol. 2025;24:109.
25. He L, Lin C, Tu Y, et al. Correlation of cardiometabolic index and sarcopenia with cardiometabolic multimorbidity in middle-aged and older adult: a prospective study. Front Endocrinol. 2024;15:1387374.
26. Wang K, Adjeroh DA, Fang W, et al. Comparison of deep learning and traditional machine learning models for predicting mild cognitive impairment using plasma proteomic biomarkers. Int J Mol Sci. 2025:26.
27. Blough DK, Madden CW, Hornbrook MC. Modeling risk using generalized linear models. J Health Econ. 1999;18:153-71.
30. Esteva A, Robicquet A, Ramsundar B, et al. A guide to deep learning in healthcare. Nat Med. 2019;25:24-9.
31. Miao N, Yang M, Han P, et al. A new ensemble learning method stratified sampling blending optimizes conventional blending and improves prediction performance. Bioinform Adv. 2025;5:vbaf002.
32. Bunkhumpornpat C, Boonchieng E, Chouvatut V, Lipsky D. FLEX-SMOTE: Synthetic over-sampling technique that flexibly adjusts to different minority class distributions. Patterns. 2024;5:101073.
33. Dunias ZS, Van Calster B, Timmerman D, Boulesteix AL, van Smeden M. A comparison of hyperparameter tuning procedures for clinical prediction models: a simulation study. Stat Med. 2024;43:1119-34.
34. Mandrekar JN. Receiver operating characteristic curve in diagnostic test assessment. J Thorac Oncol. 2010;5:1315-6.
35. Alba AC, Agoritsas T, Walsh M, et al. Discrimination and calibration of clinical prediction models: users’ guides to the medical literature. JAMA. 2017;318:1377-84.
36. Brier GW. Verification of forecasts expressed in terms of probability. Mon Weather Rev. 1950;78:1-3.
37. Ruan X, Ling Y, Chen J, et al. Joint effects of triglyceride glucose index and its obesity-related derivatives with estimated glucose disposal rate on cardiometabolic multimorbidity in middle-aged and older Chinese adults: a nationwide cohort study. Cardiovasc Diabetol. 2025;24:382.
38. Li X, Zhao L, Zhao W, Sun T, Pan H, Wang D. The difference between cystatin C- and creatinine-based estimated glomerular filtration rate and all-cause and cardiovascular mortality in populations with cardiovascular-kidney-metabolic syndrome stages 0-3: a prospective cohort study. Am J Nephrol. 2025;:1-15.
39. Ji RR, Nackley A, Huh Y, Terrando N, Maixner W. Neuroinflammation and central sensitization in chronic and widespread pain. Anesthesiology. 2018;129:343-66.
40. Xu B, Wu Q, La R, et al. Is systemic inflammation a missing link between cardiometabolic index with mortality? Cardiovasc Diabetol. 2024;23:212.
41. Smith L, López Sánchez GF, Soysal P, Tully MA, Koyanagi A. Unclean cooking fuel use and health outcomes in older adults: potential mechanisms, public health implications, and future directions. J Gerontol A Biol Sci Med Sci. 2023;78:2342-7.
42. Miletic M, Sariyar M. Utility-based analysis of statistical approaches and deep learning models for synthetic data generation with focus on correlation structures: algorithm development and validation. JMIR AI. 2025;4:e65729.
43. Su B, Li D, Xie J, et al. Chronic disease in China: geographic and socioeconomic determinants among persons aged 60 and older. J Am Med Dir Assoc. 2023;24:206-212.e5.
44. Chen J, Zhang F, Zhang Y, et al. Trajectories network analysis of chronic diseases among middle-aged and older adults: evidence from the China Health and Retirement Longitudinal Study (CHARLS). BMC Public Health. 2024;24:559.
Cite This Article
How to Cite
Download Citation
Export Citation File:
Type of Import
Tips on Downloading Citation
Citation Manager File Format
Type of Import
Direct Import: When the Direct Import option is selected (the default state), a dialogue box will give you the option to Save or Open the downloaded citation data. Choosing Open will either launch your citation manager or give you a choice of applications with which to use the metadata. The Save option saves the file locally for later use.
Indirect Import: When the Indirect Import option is selected, the metadata is displayed and may be copied and pasted as needed.
About This Article
Special Topic
Copyright

Data & Comments
Data
0


Comments
Comments must be written in English. Spam, offensive content, impersonation, and private information will not be permitted. If any comment is reported and identified as inappropriate content by OAE staff, the comment will be removed without notice. If you have any queries or need any help, please contact us at [email protected].