


fig2
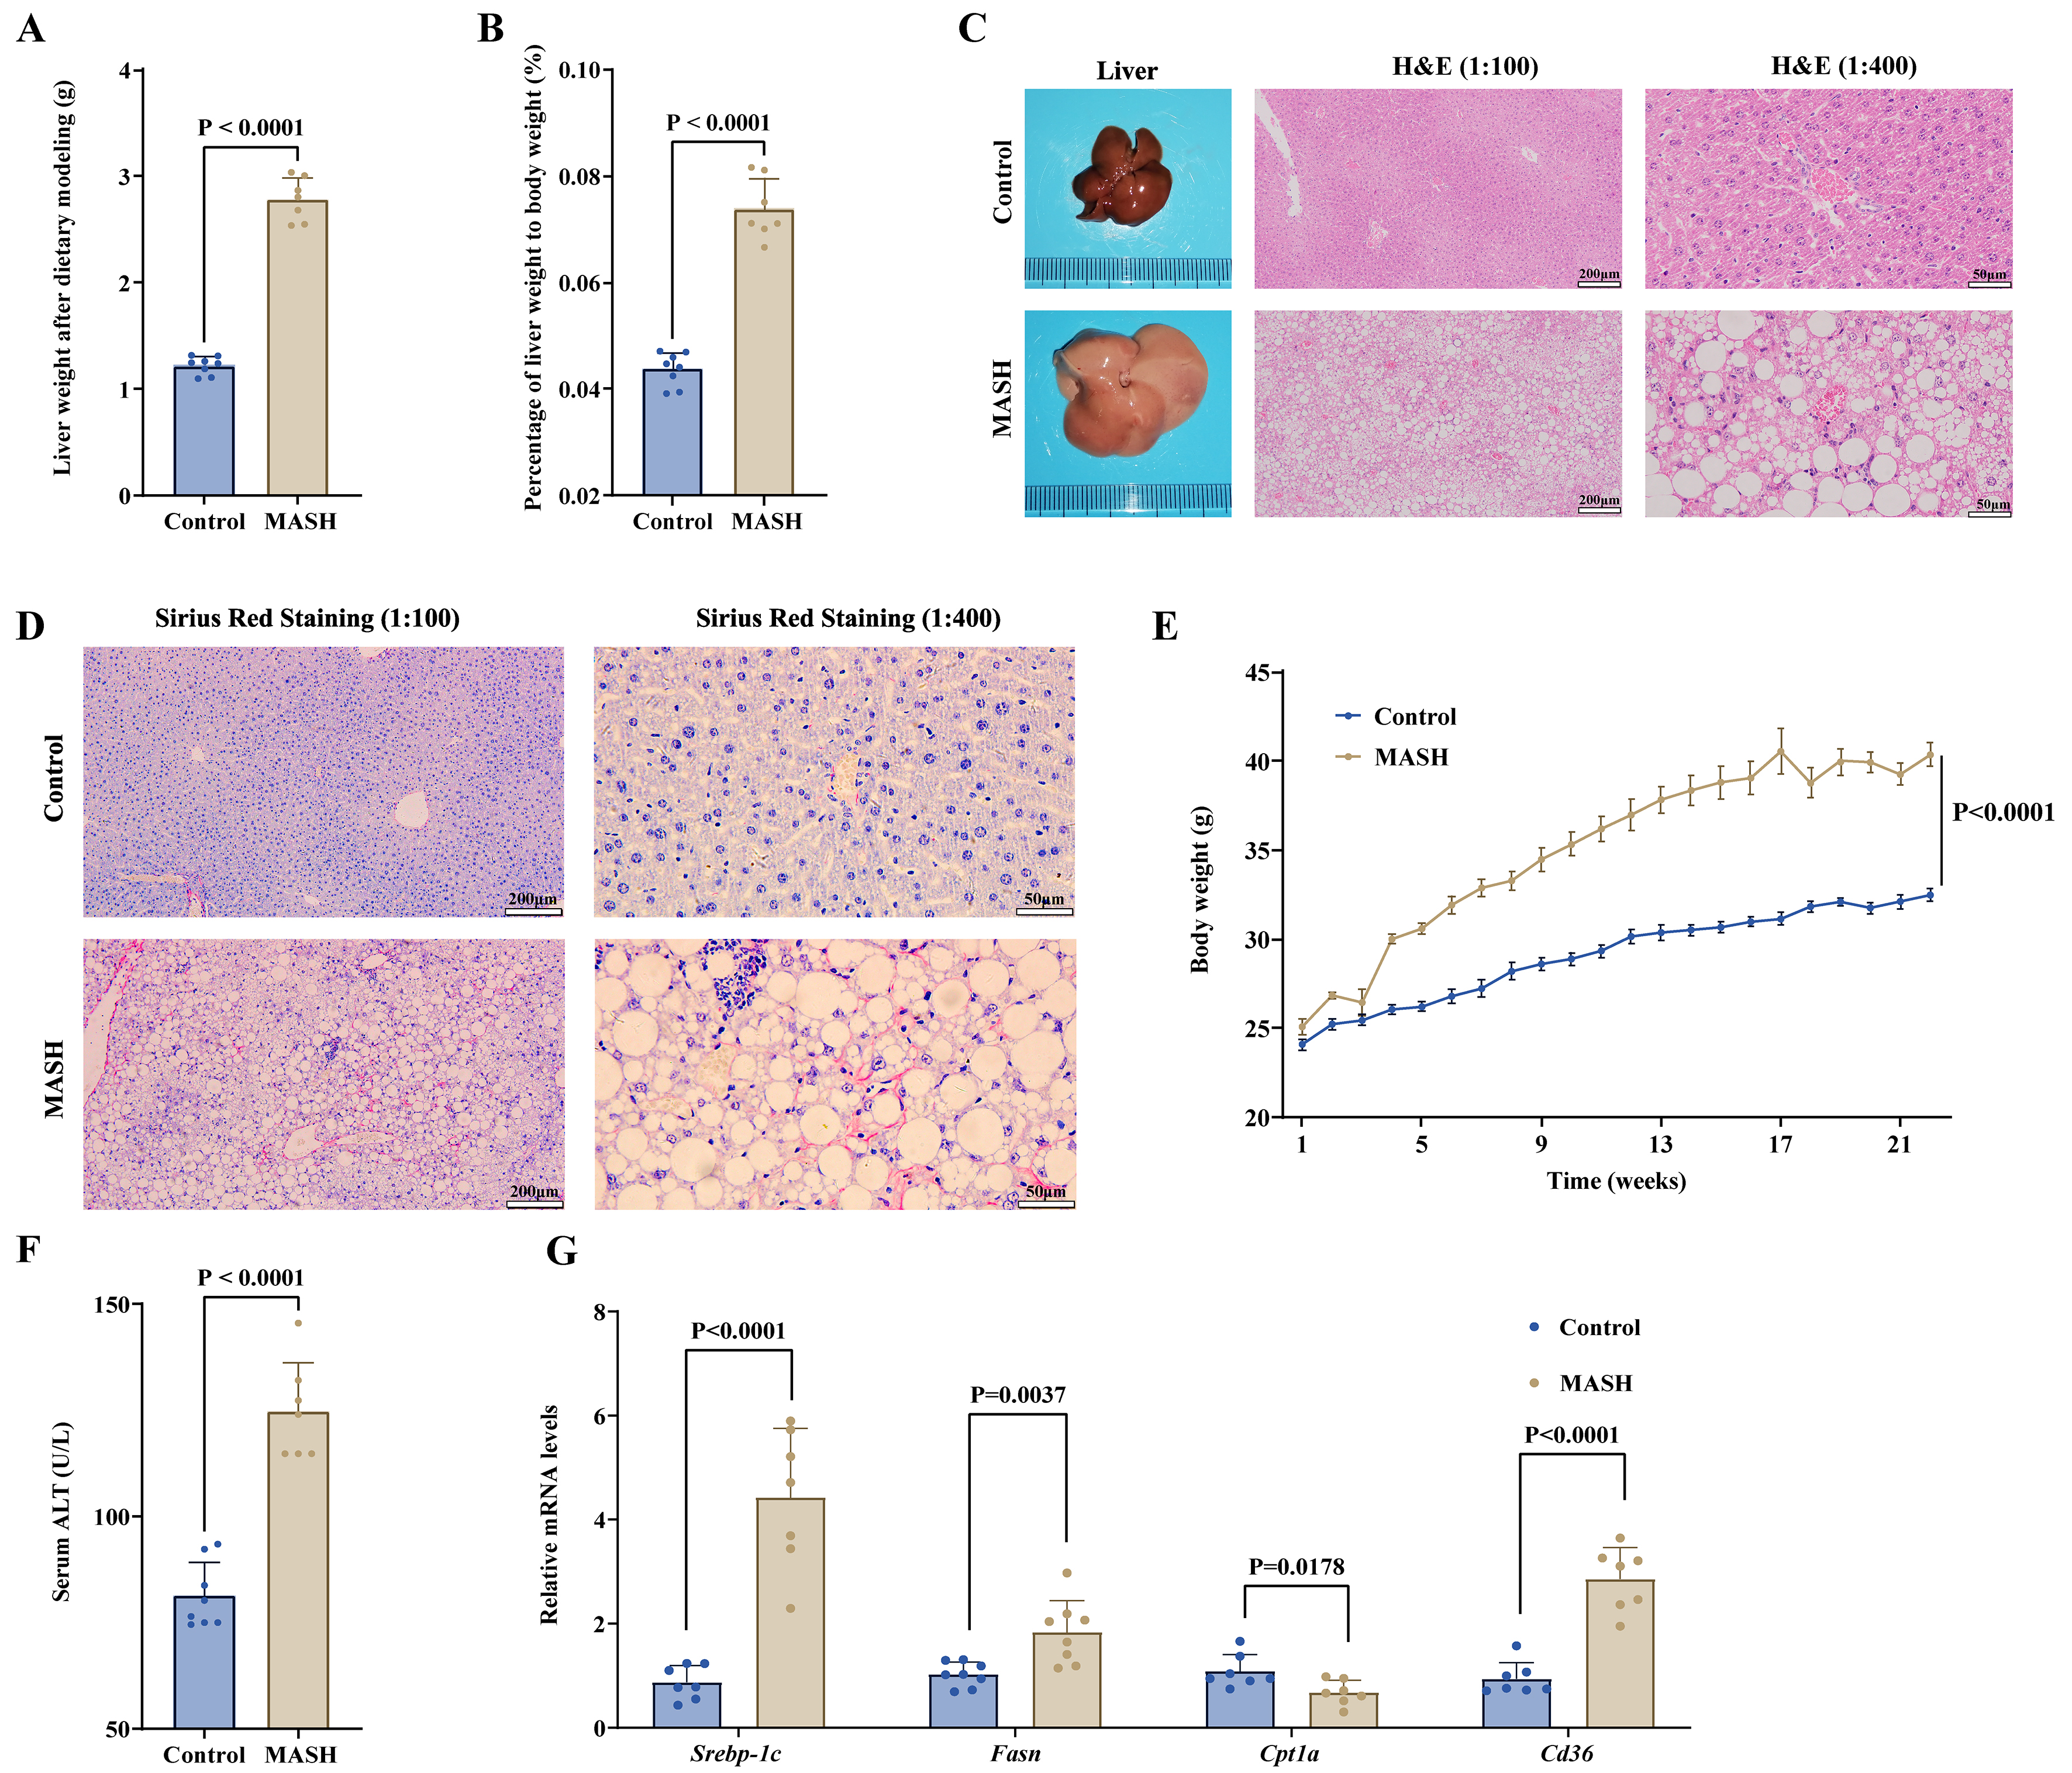
Figure 2. Long-term administration of a Western diet and fructose solution to mice induces a MASH model. (A and B) Increased liver weight and liver:body weight ratio in MASH; (C and D) Representative gross liver morphology, H&E staining (scale bars = 200 μm for 1:100 and 50 μm for 1:400), and Sirius Red staining (scale bars = 200 μm for 1:100 and 50 μm for 1:400) of both the control and MASH groups; (E) The body weight trends of the control and MASH groups were monitored over a period of 22 weeks; (F) The mice in the MASH group exhibited notably elevated serum ALT levels in comparison to those in the control group; (G) Comparative analysis of the relative expression levels of lipid synthesis- and metabolism-related mRNAs between the control and the MASH groups. Data are presented as mean ± SD. Statistical significance was evaluated using two-tailed Student’s t-test. P < 0.05 was considered statistically significant. For animal experiments, n = 8 mice per group were initially included; after outlier exclusion using ROUT (Q = 5%), 7-8 samples per group were used for statistical analysis. ALT: Alanine aminotransferase; H&E: hematoxylin and eosin; MASH: metabolic dysfunction-associated steatohepatitis; mRNA: messenger RNA; ROUT: robust regression and outlier removal; SD: standard deviation; Srebp-1c: sterol regulatory element-binding protein-1c; Fasn: fatty acid synthase; Cpt1a: carnitine palmitoyltransferase 1a; Cd36: cluster of differentiation 36.


