


fig1
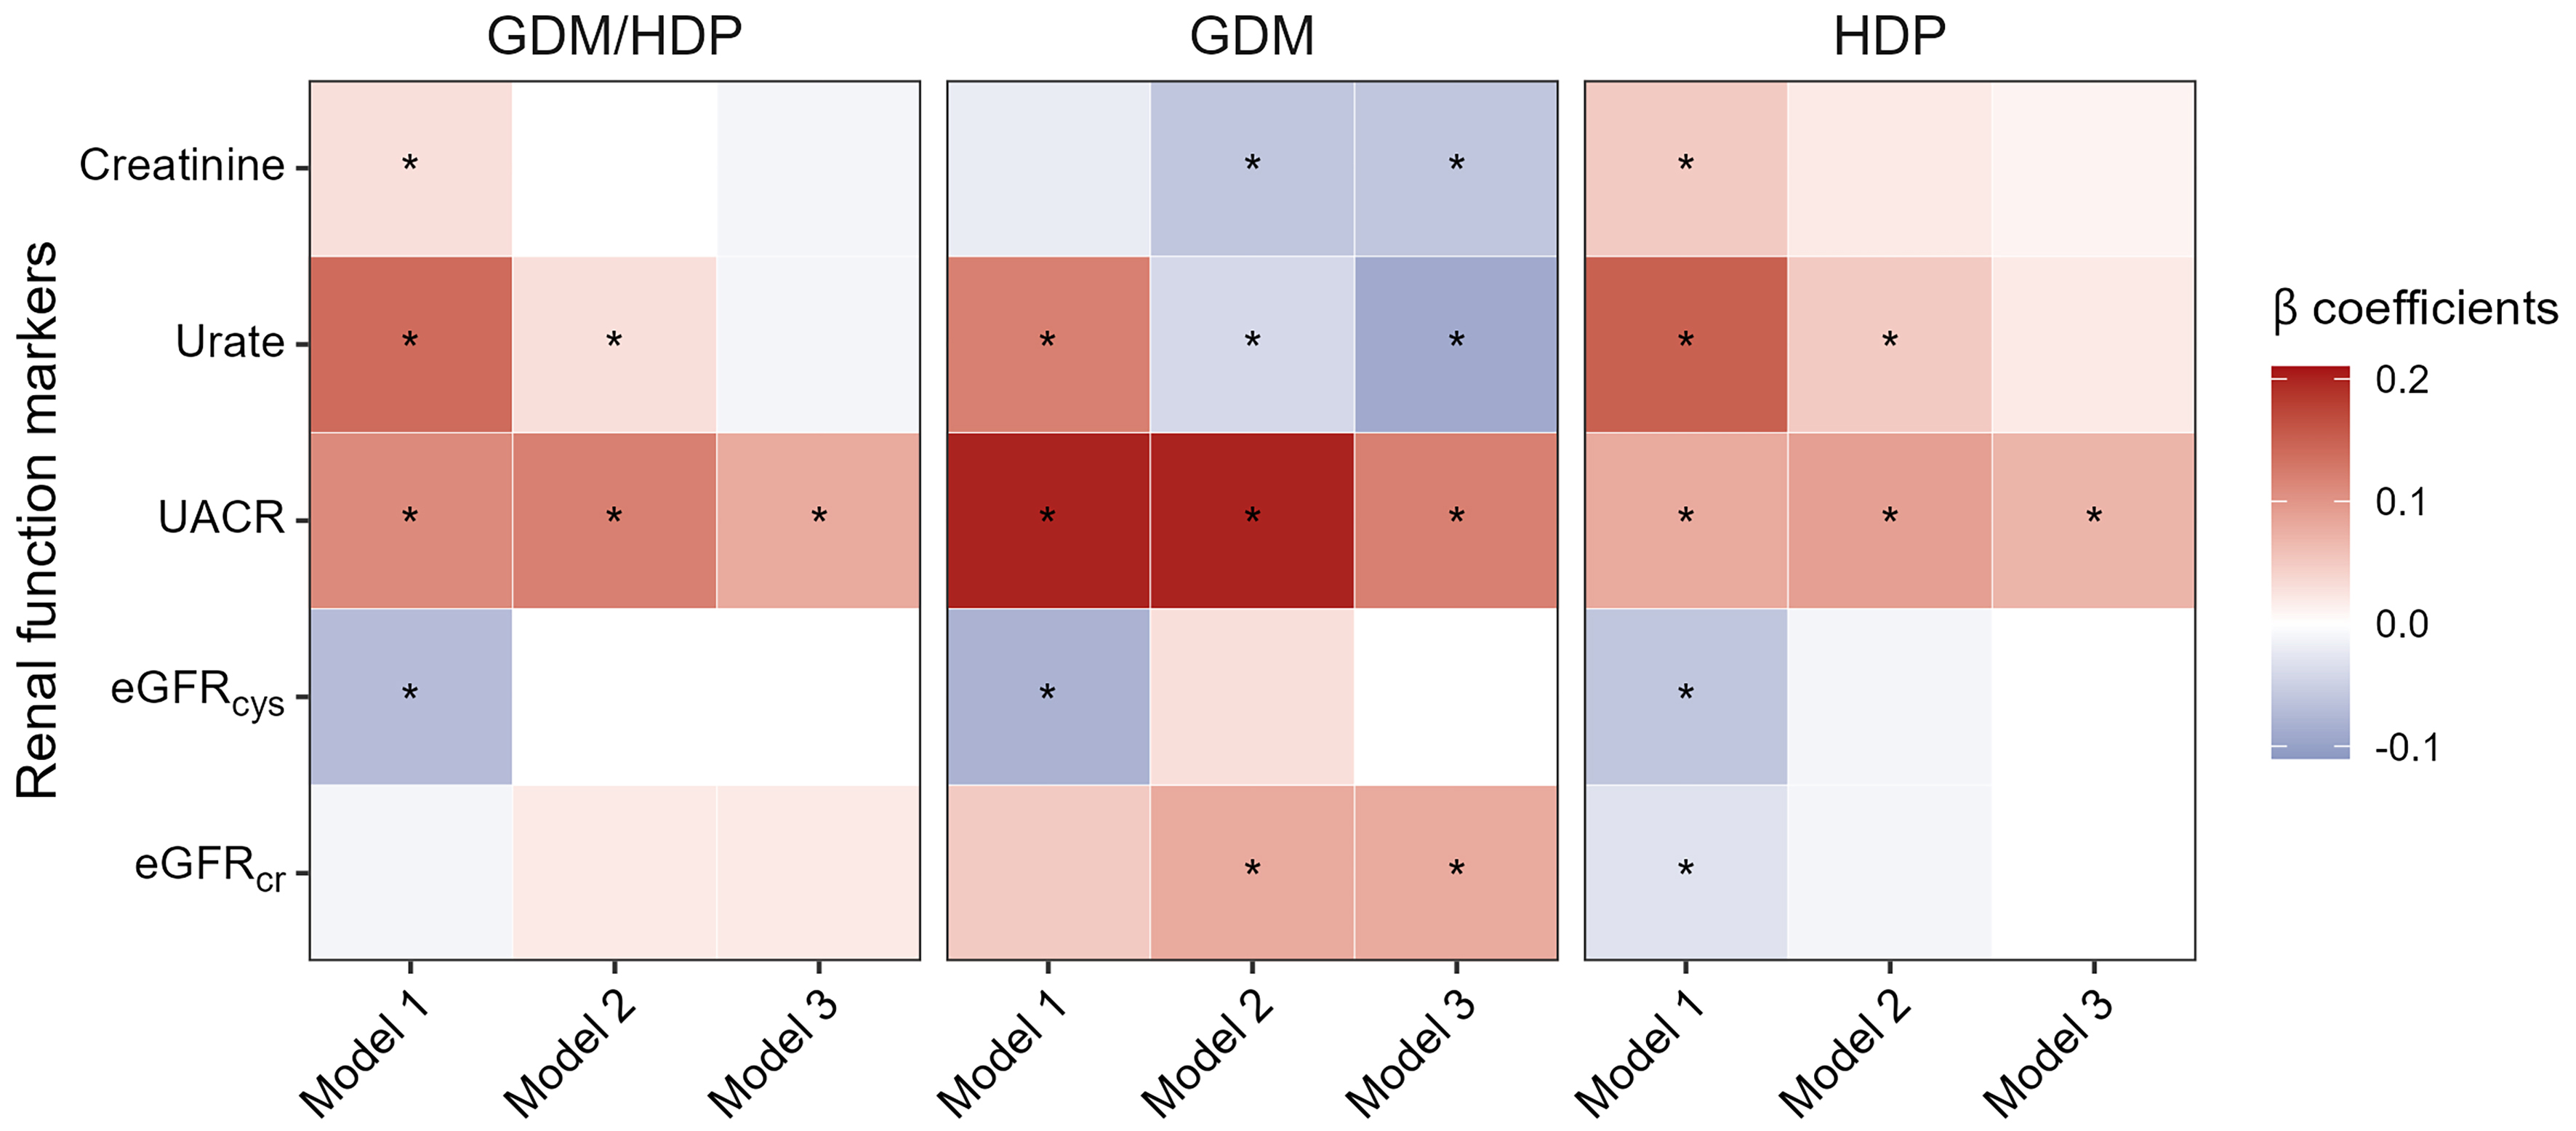
Figure 1. Associations between GDM/HDP and renal function markers in the UK Biobank in the cross-sectional analysis. Colors represent standardized β coefficients from linear regression models, with positive and negative associations highlighted in red and blue, respectively. All continuous variables were log2-transformed and standardized to z-scores before analysis. Asterisks within cells indicate statistical significance: *P < 0.05 after adjustment in Model 3. Model 1: adjusted for age, ethnicity, education, and Townsend deprivation index; Model 2: additionally adjusted for body mass index, smoking status, and alcohol consumption; Model 3: further adjusted for triglycerides, low-density lipoprotein cholesterol, high-density lipoprotein cholesterol, blood glucose, C-reactive protein, and medication use. eGFRcr: Estimated glomerular filtration rate using creatinine; eGFRcys: estimated glomerular filtration rate using cystatin C; GDM: gestational diabetes mellitus; HDP: hypertensive disorders of pregnancy; UACR: urine albumin-to-creatinine ratio.


