


fig7
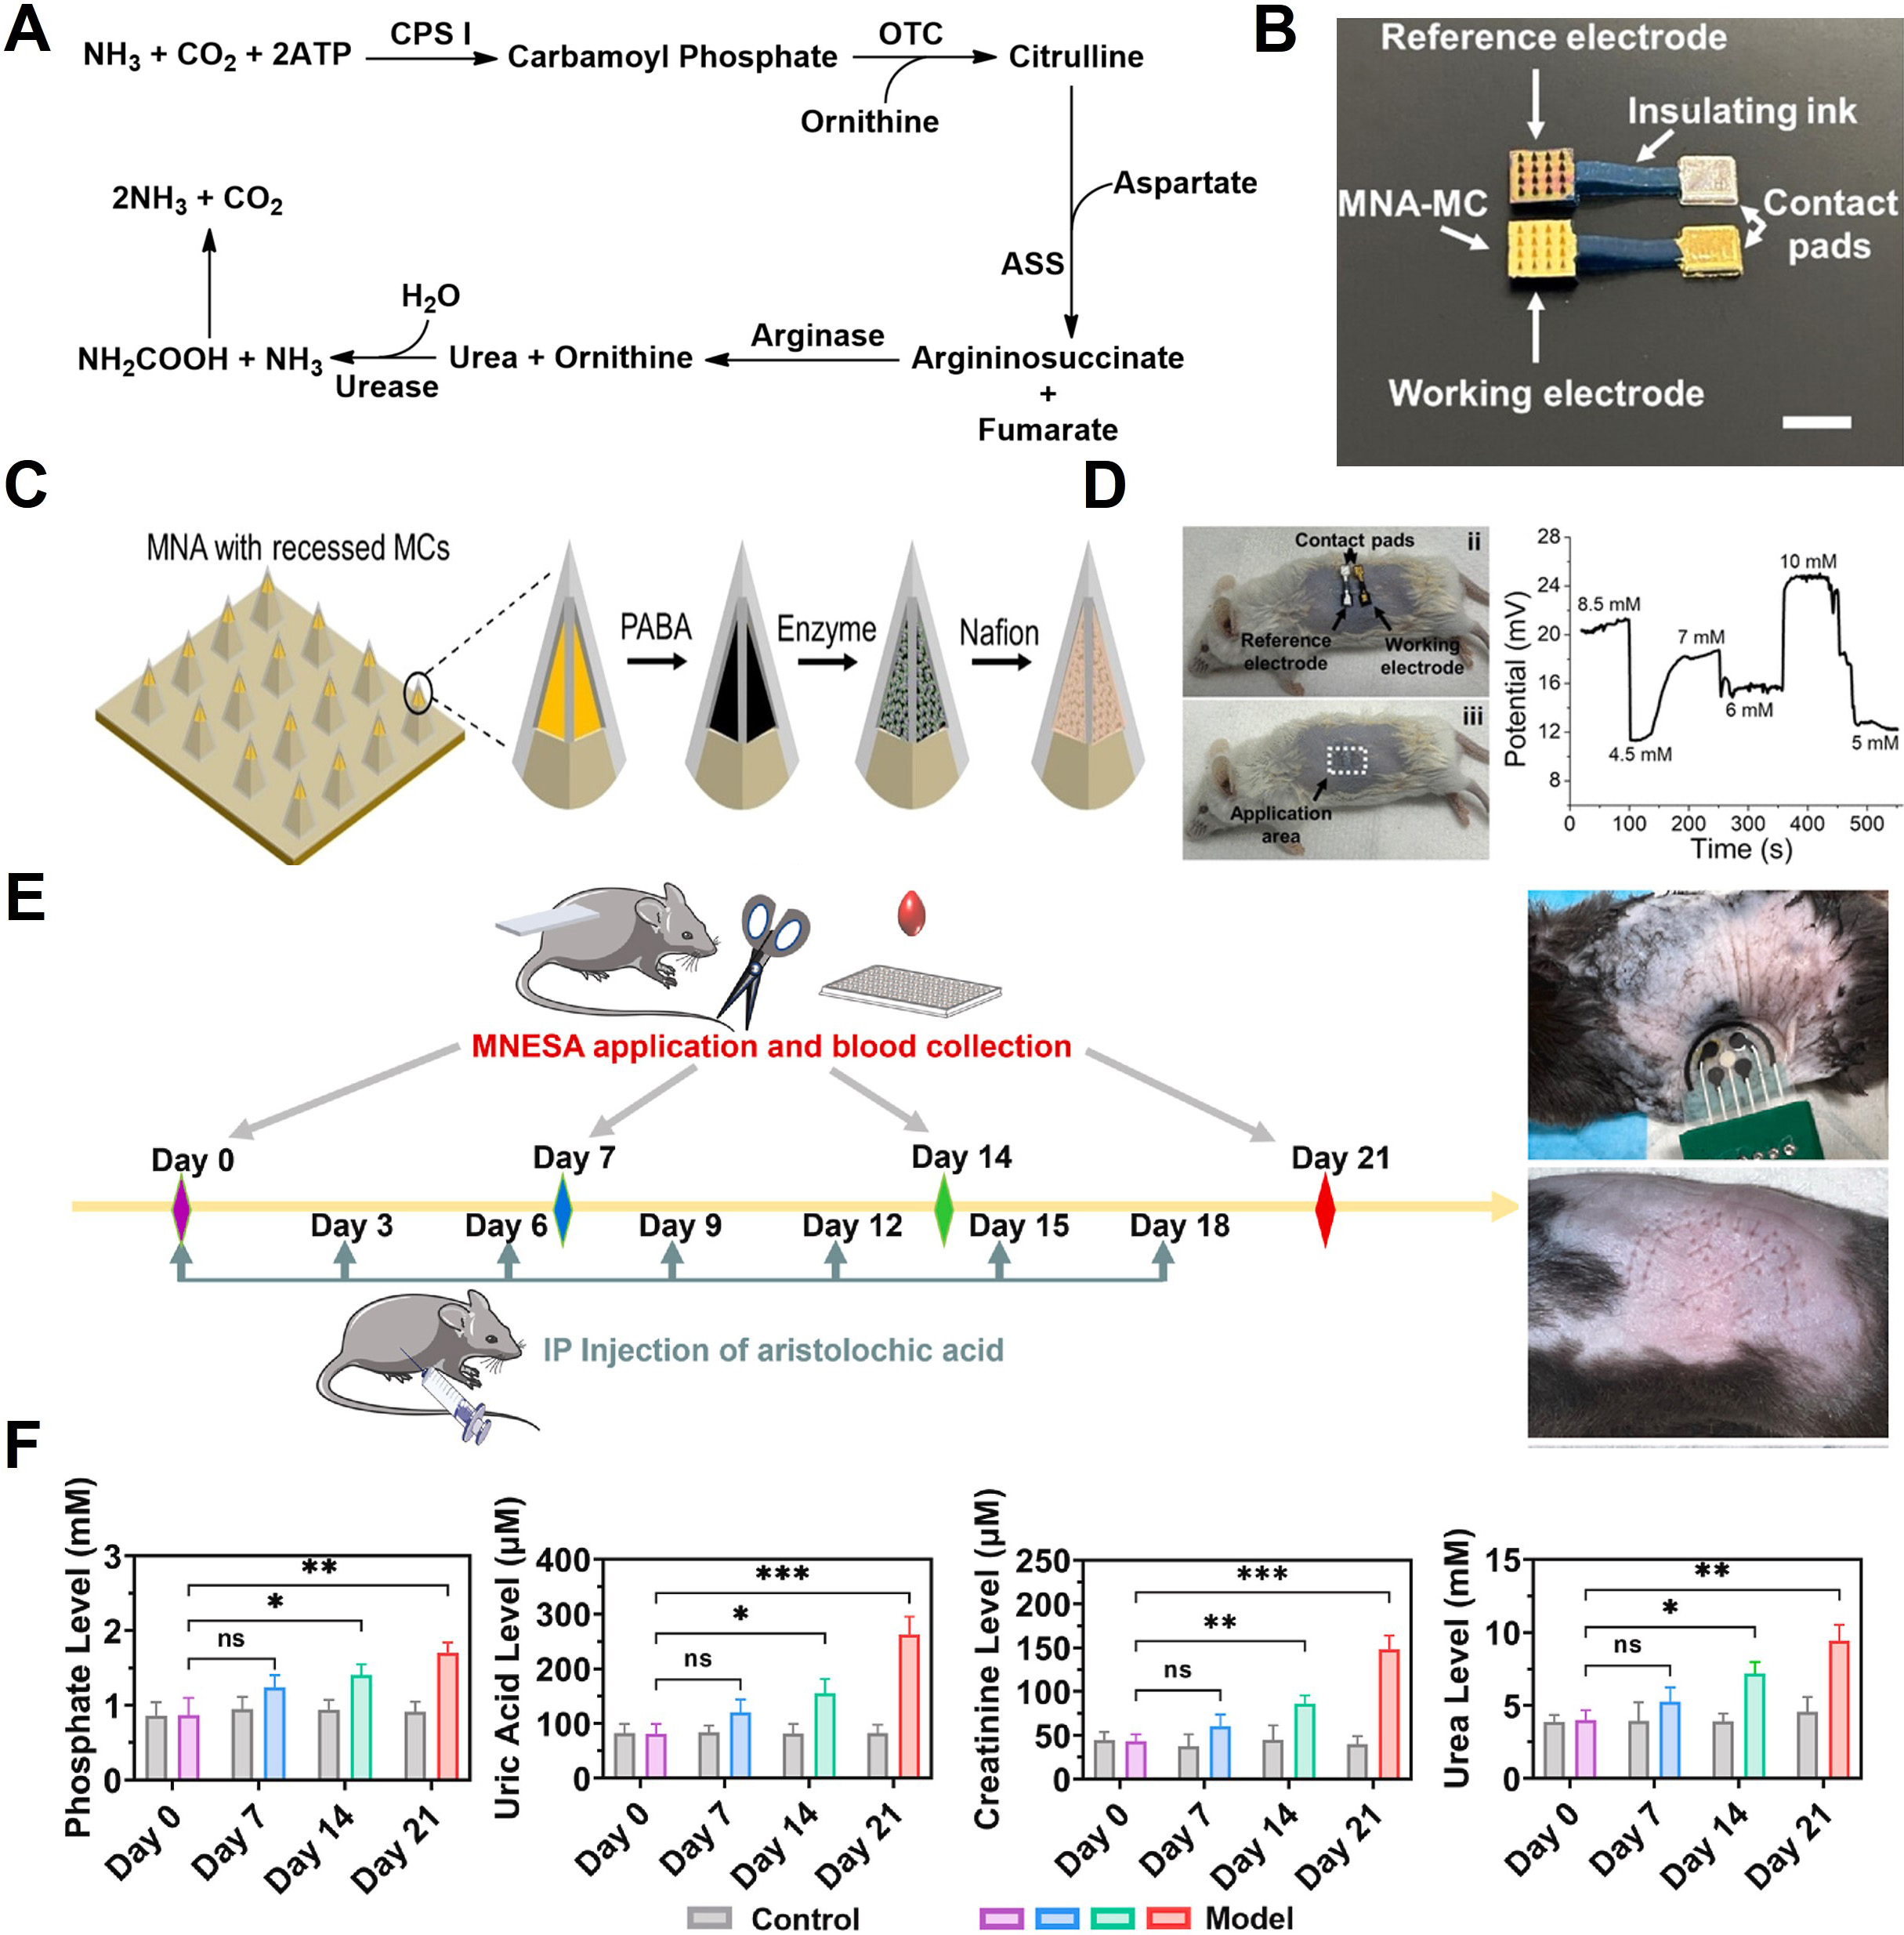
Figure 7. Urea metabolic pathway and sensing mechanisms. (A) Flow map of enzyme-based detection strategies for urea generated through the urea cycle; (B) Schematic of a solid MN designed for urea sensing. The MN incorporates an embedded microcavity architecture composed of a PABA/enzyme/Nafion stack; (C) Optical images of ex-vivo tests; (D) Experimental protocol for in vivo evaluation of an integrated sensor capable of measuring phosphate, uric acid, creatinine, and urea; (E) Temporal concentration profiles of each metabolite before (grey) and after administration of aristolochic acid (pink, blue, green, red); (F) Phosphate, uric acid, creatinine, and urea levels in ISF of control and comparison mouse. Each data point represents the mean and standard error of three measurements taken for a single mouse model. All concentration values were calibrated against in-vitro measurements. The error bar in (F) shows the standard deviation. (B-D) Reproduced with permission Copyright 2024, ACS Sensors[199]. (E and F) Reproduced with permission Copyright 2023, Biosensors and Bioelectronics[124]. *P < 0.05, **P < 0.01, ***P < 0.001. MN: Microneedle; PABA: polyaniline-boronic acid; ATP: adenosine triphosphate; CPS I: carbamoyl phosphate synthetase I; OTC: ornithine transcarbamylase; ASS: argininosuccinate synthase; MNA: microneedle array; MC: microcavity; MCs: microcavities; MNESA: MN electrical sensor array; IP: intraperitoneal; ns: not significant.


