


fig3
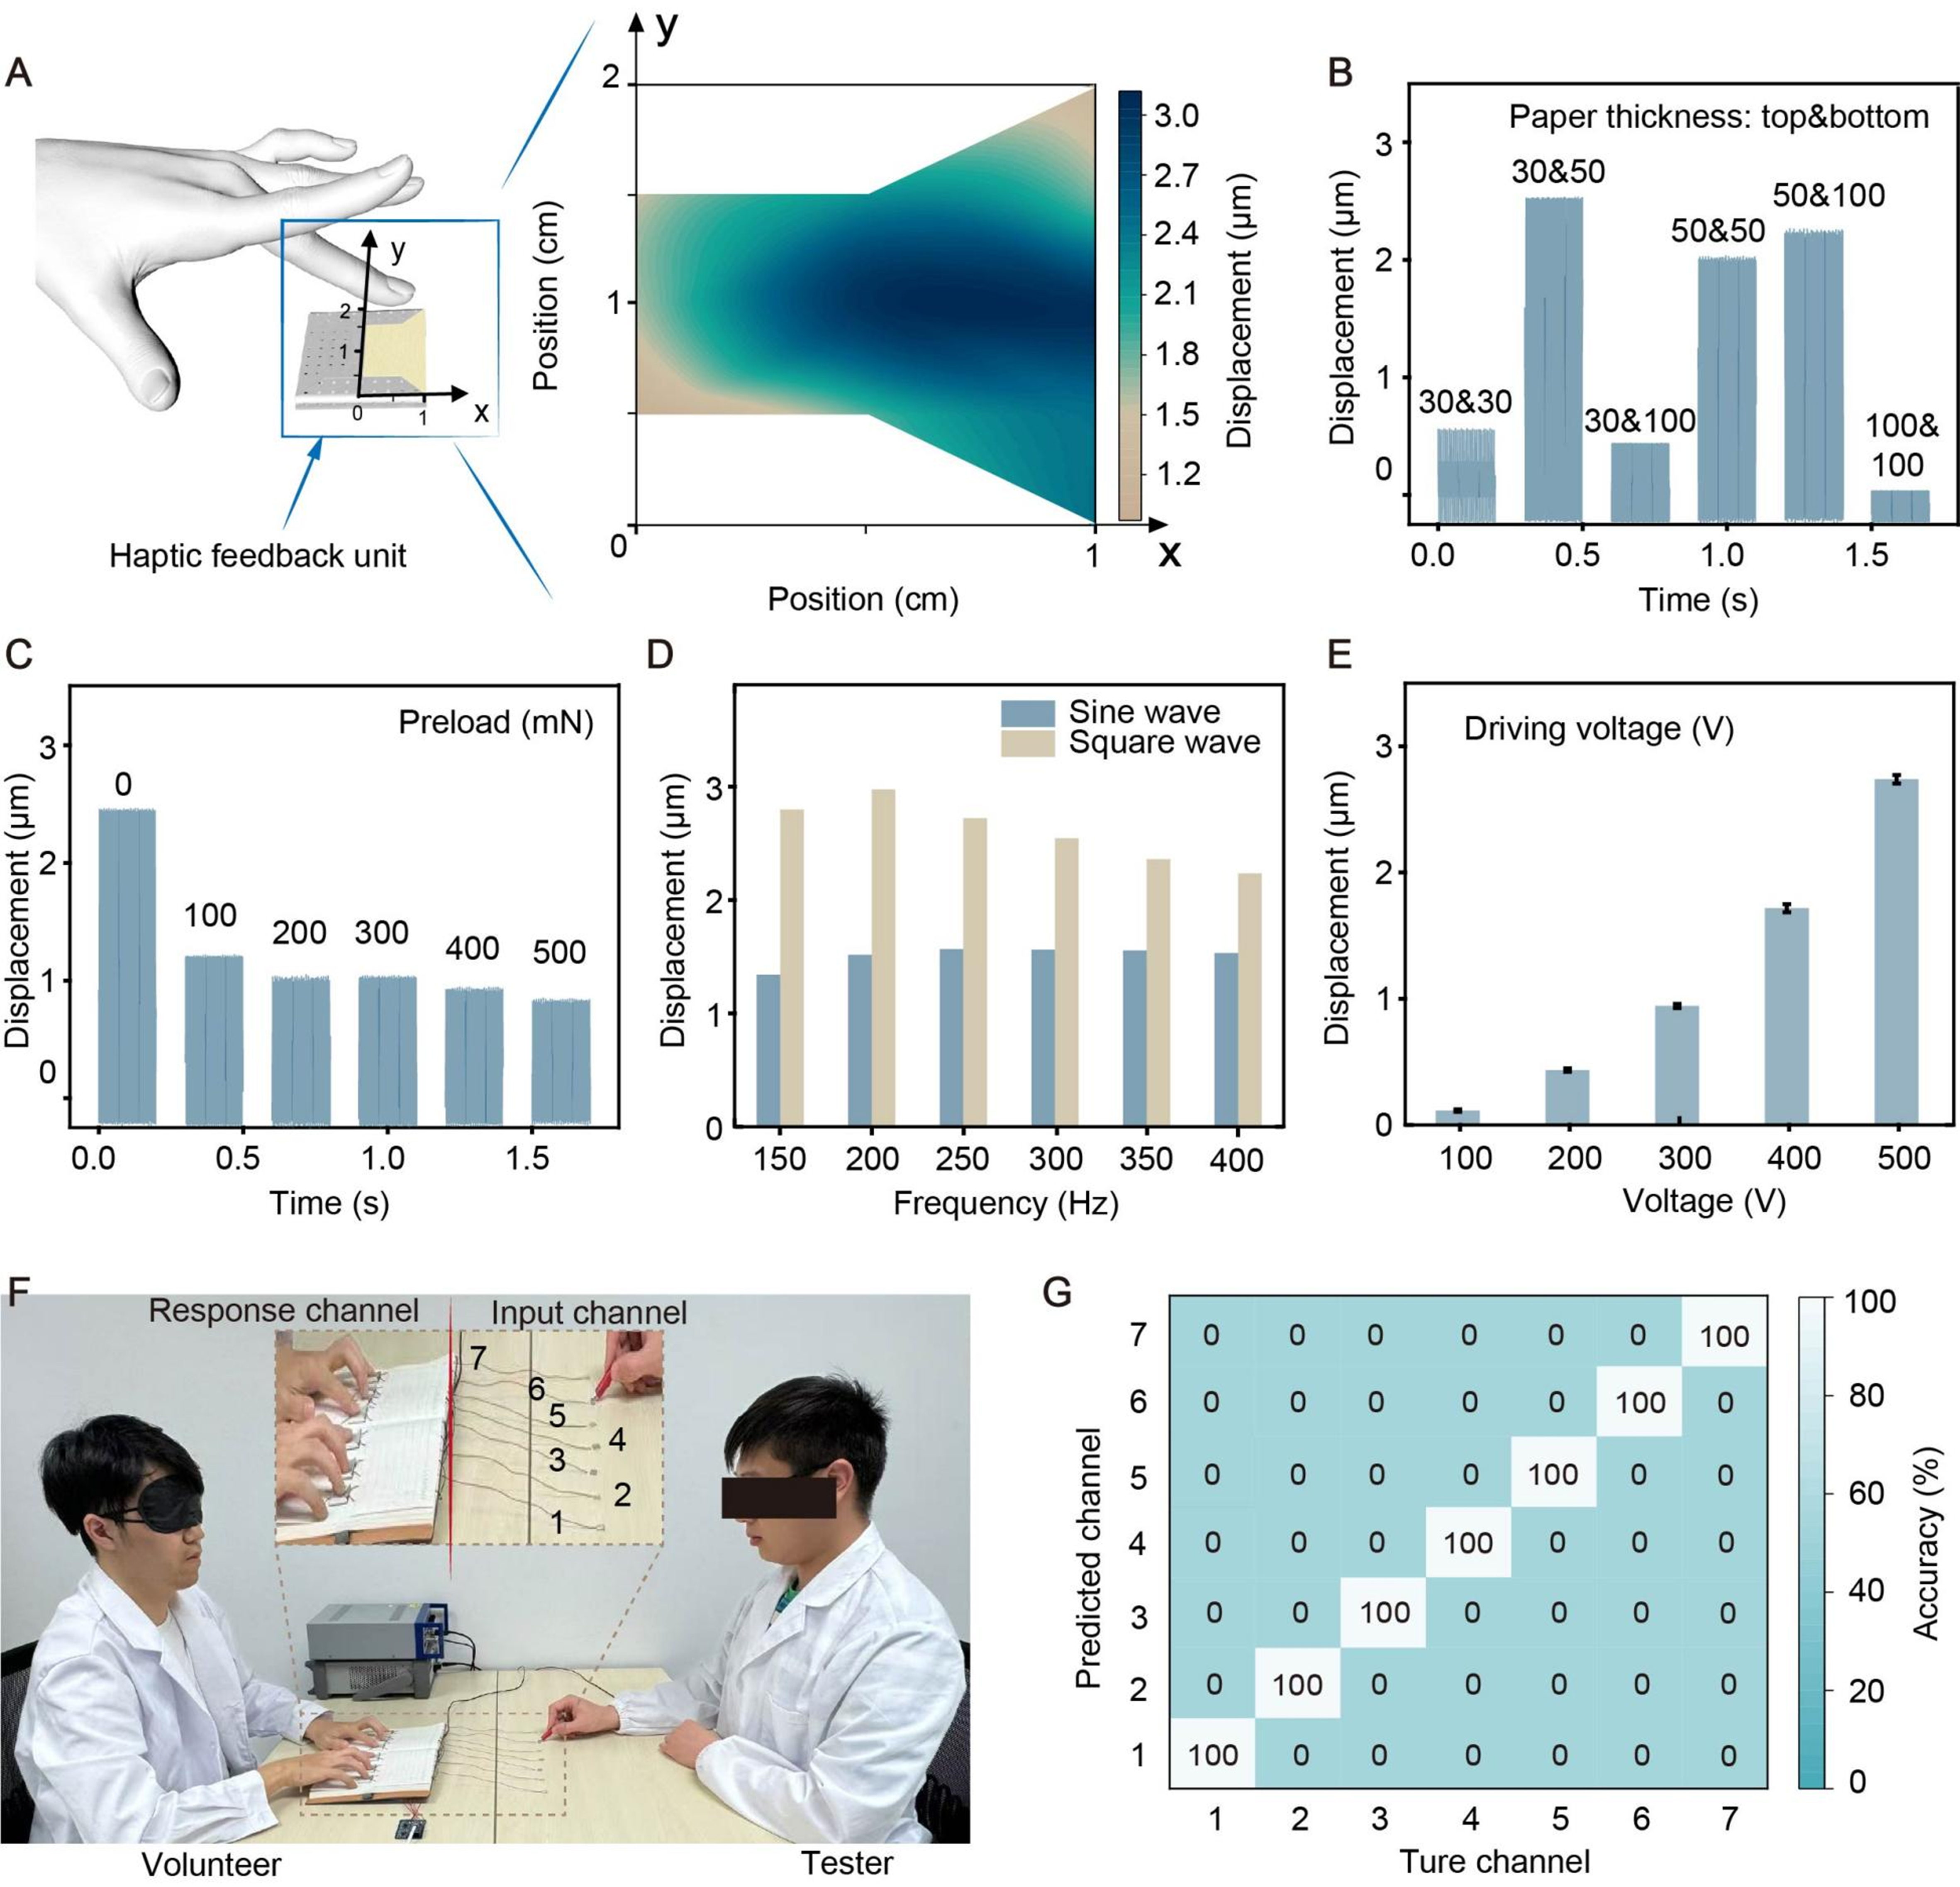
Figure 3. Parameter optimization of haptic feedback unit. (A) Vibration displacement distribution of the haptic feedback unit, showing that the vibration displacement is highly dependent on the test position; (B) Response curve of displacement to different configurations of the haptic feedback unit. The configurations include the combination of different thicknesses of the top and bottom paper substrates; (C) Relationship between vibration displacement and preload; (D) Frequency response of the haptic feedback unit when driven by sine wave and square wave; (E) Measured displacement as a function of driving voltage; (F) A photo exhibiting the detail of the user perception experiment (author team members shown; photographed by the authors); (G) Recognition accuracy of the paper-based device for each channel. Unless stated otherwise, the test conditions were a driving voltage of 500 V, an excitation frequency of 200 Hz, and a square wave input. The error bars in the figures represent the standard deviation, with an experimental sample size of three.


