




fig3
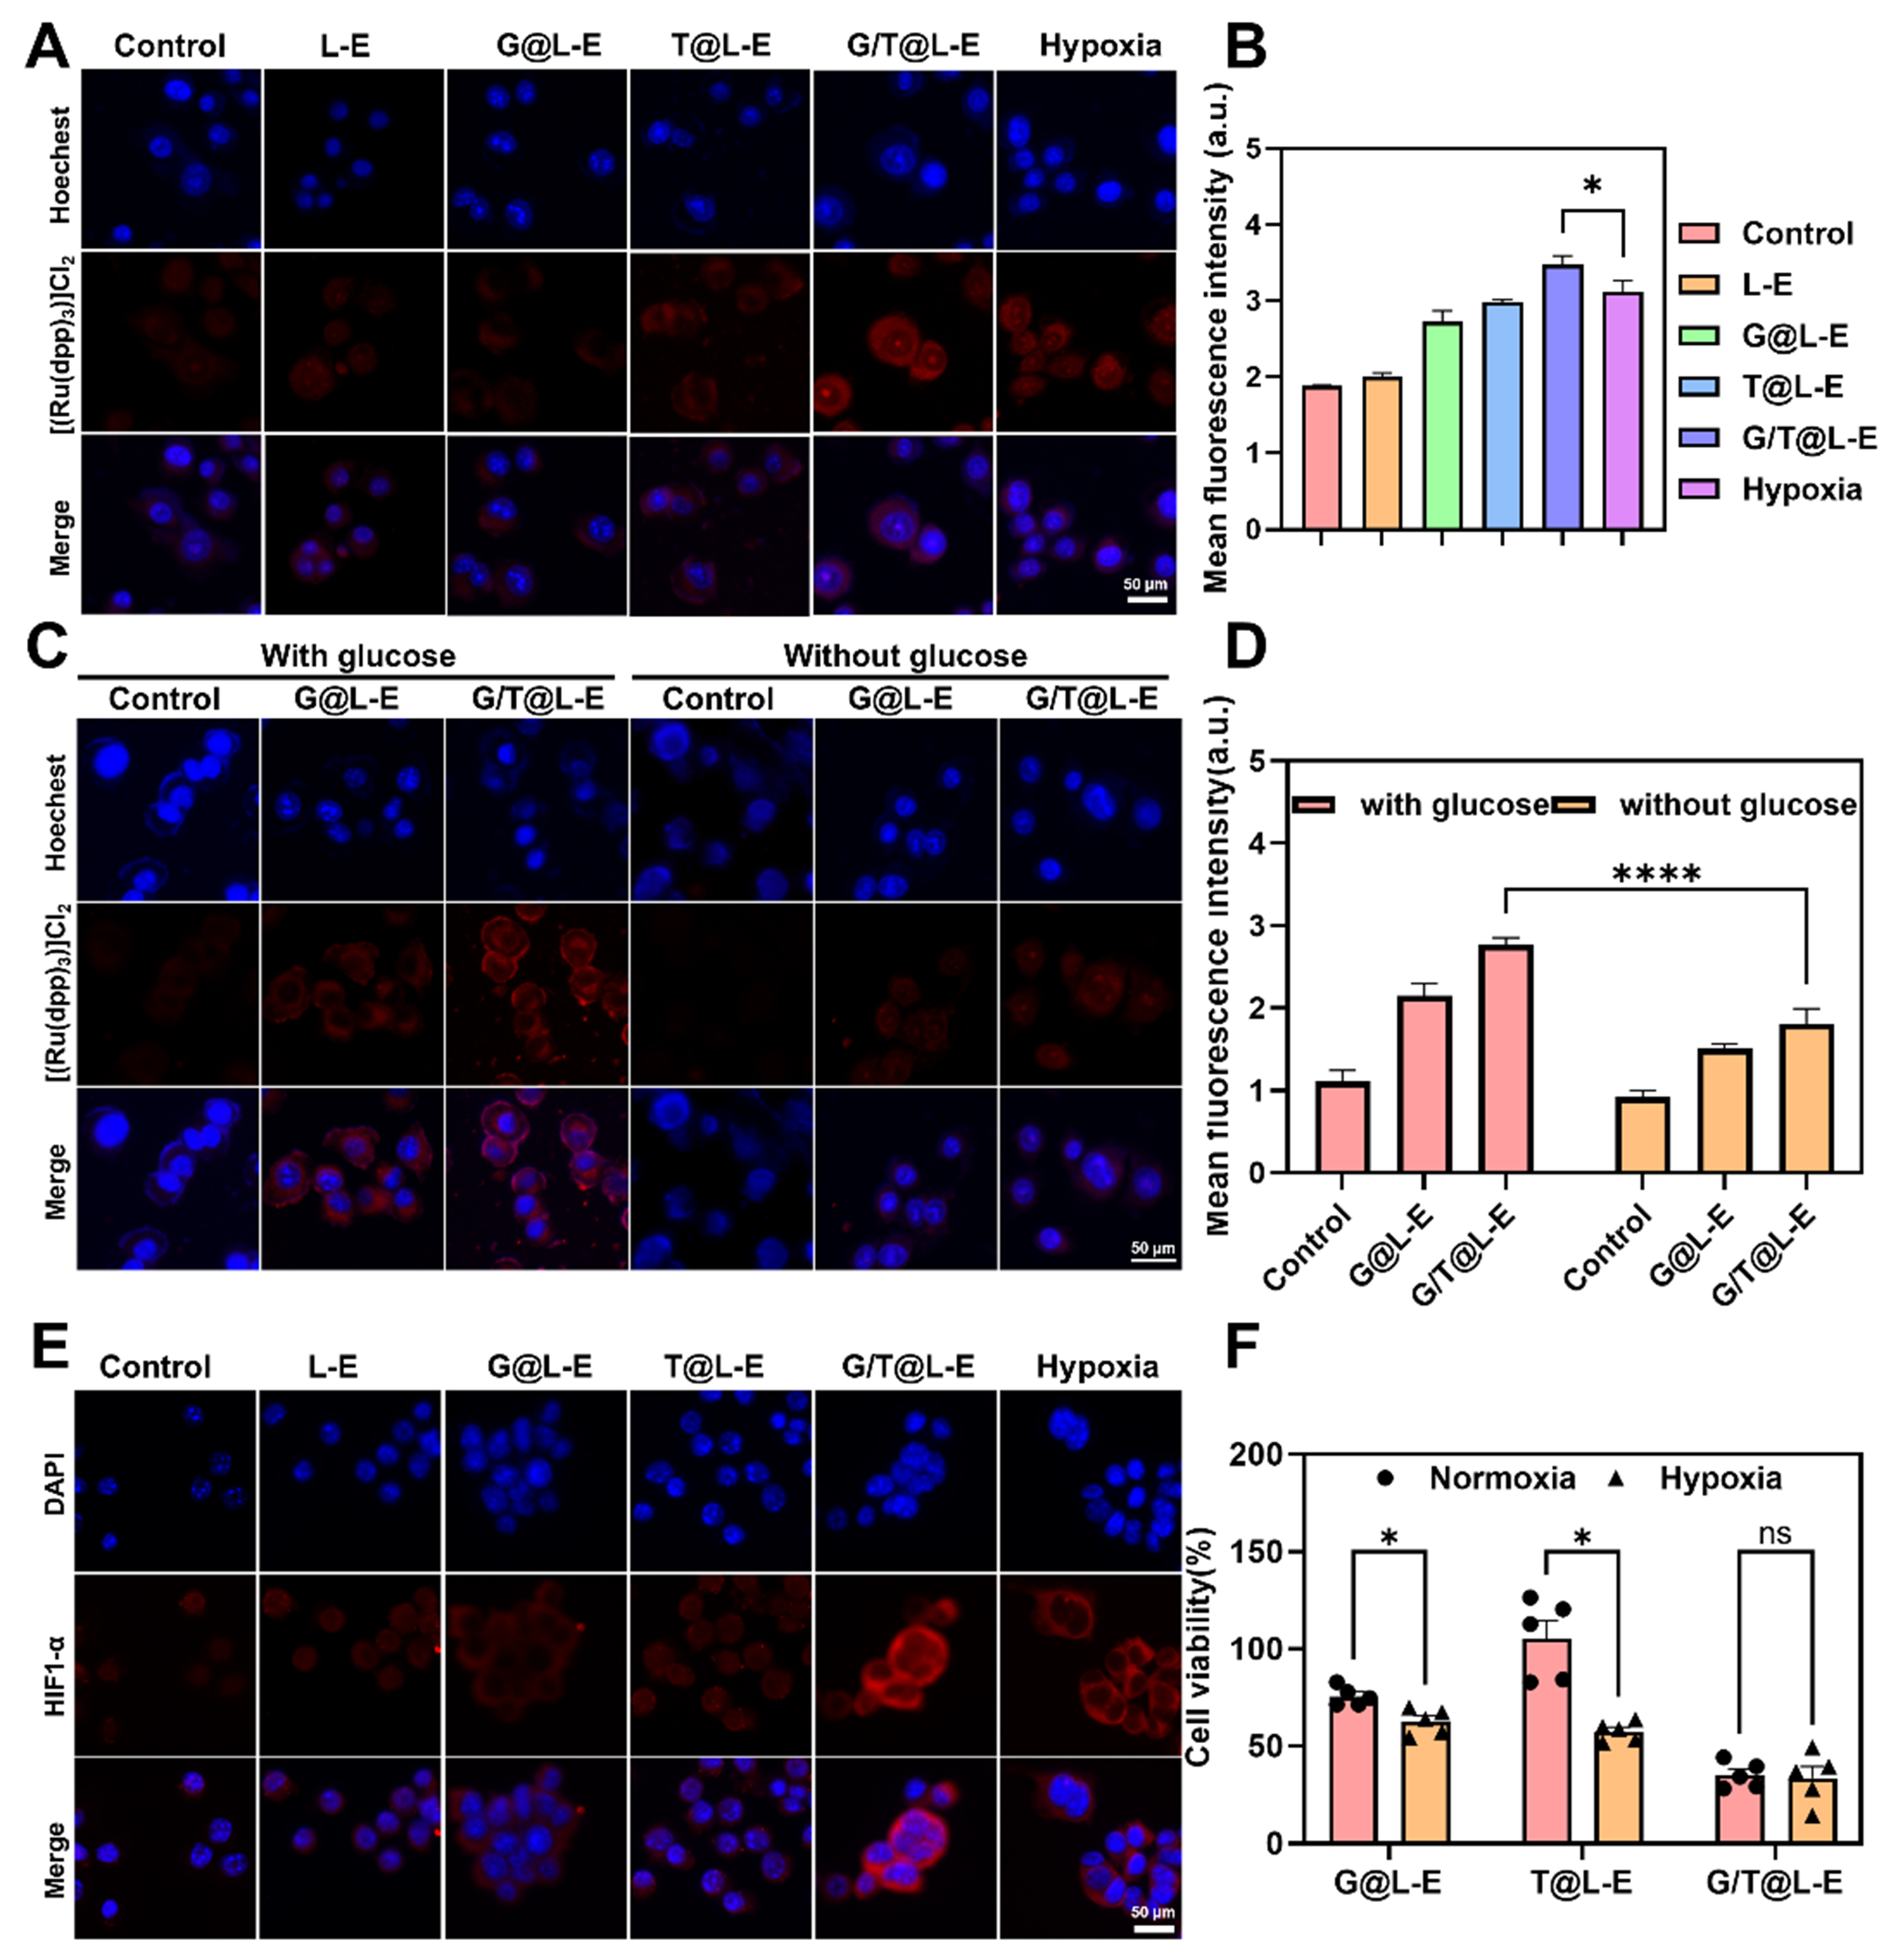
Figure 3. In vitro hypoxia amplification of G/T@L-E against 4T1 cells. (A) Confocal fluorescence images of the hypoxia level in 4T1 cells with various treatments. Scale bar = 50 µm; (B) The corresponding fluorescence intensities of the hypoxia level in 4T1 cells with various treatments quantified by ImageJ software. n = 3; (C) Confocal fluorescence images of the hypoxia level in 4T1 cells cocultured with or without glucose. Scale bar = 50 µm; (D) The corresponding fluorescence intensities of the hypoxia level in 4T1 cells cocultured with various treatments quantified by ImageJ software. n = 3; (E) Immunofluorescence images of HIF-1α in 4T1 cells after different treatments. Scale bar = 50 µm; (F) Cell viability of 4T1 cells after different treatments in normoxia or hypoxic conditions. n = 5. Data are presented as mean ± SD. Significance was compared by one-way ANOVA followed by Dunnett’s multiple comparisons test or two-way ANOVA followed by Tukey’s multiple comparisons test. *P < 0.05, ****P < 0.0001, ns: (not significant) P ≥ 0.05. HIF-1α: Hypoxia-inducible factor-1α; SD: standard deviation; ANOVA: analysis of variance.





