




fig4
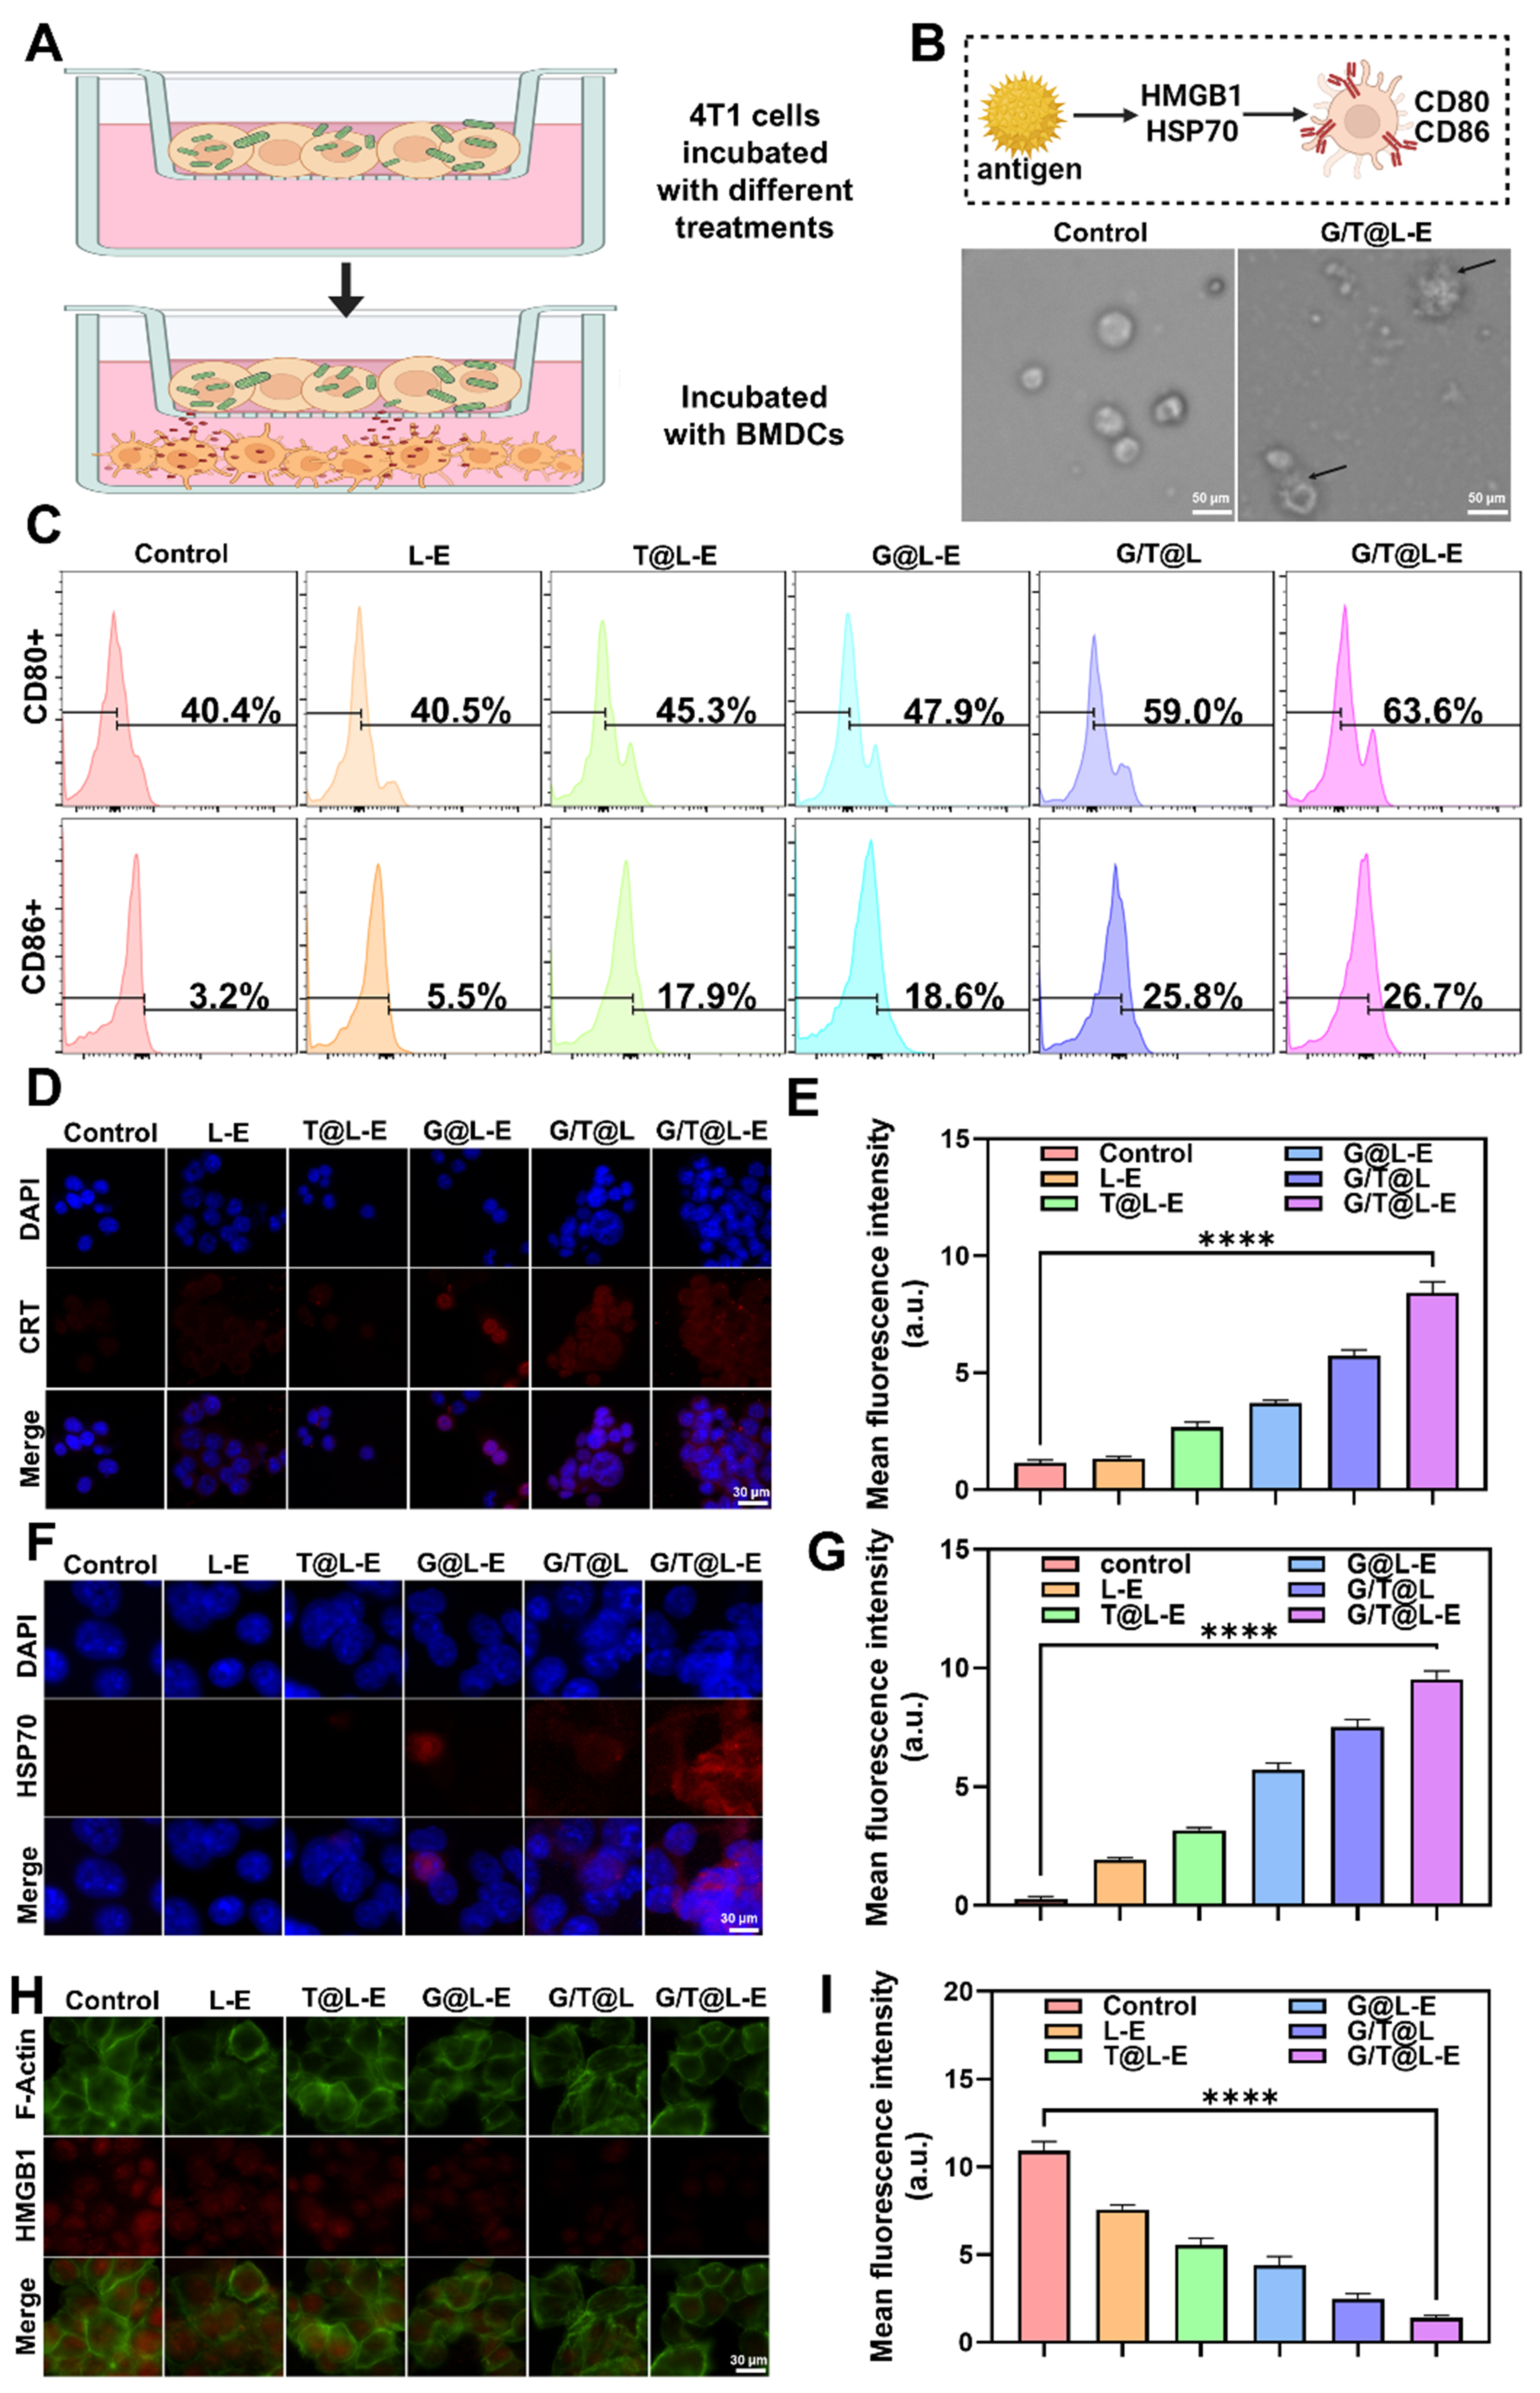
Figure 4. In vitro ICD induction of G/T@L-E against 4T1 cells. (A) Schematic diagram of the experiment to explore DC maturation in vitro; (B) Optical microscopic images of DCs following incubation. Scale bar: 50 µm; (C) FCM analysis of CD80 and CD86 expression on CD11c+DCs following various treatments; (D) Immunofluorescence images of CRT of 4T1 cells after each treatment. Scale bar: 30 µm; (E) The corresponding fluorescence intensities of CRT quantified by ImageJ software. n = 3; (F) Immunofluorescence images of HSP70 in 4T1 cells after each treatment. Scale bar: 30 µm; (G) The corresponding fluorescence intensities of HSP70 quantified by ImageJ software. n = 3; (H) Immunofluorescence images of HMGB1 in 4T1 cells after each treatment. Scale bar: 30 µm; (I) The corresponding fluorescence intensities of HMGB1 quantified by ImageJ software. n = 3. Data are presented as mean ± SD. Significance was compared by one-way ANOVA followed by Dunnett’s multiple comparisons test or two-way ANOVA followed by Tukey’s multiple comparisons test. ****P < 0.0001. Some elements in (A and B) were created with BioRender.com. ICD: Immunogenic cell death; DC: dendritic cell; FCM: flow cytometry; CRT: calreticulin; HSP70: heat shock protein 70; HMGB1: high mobility group box 1; SD: standard deviation; ANOVA: analysis of variance; BMDCs: bone marrow-derived dendritic cells; DAPI: 4′,6-diamidino-2-phenylindole.





