




fig5
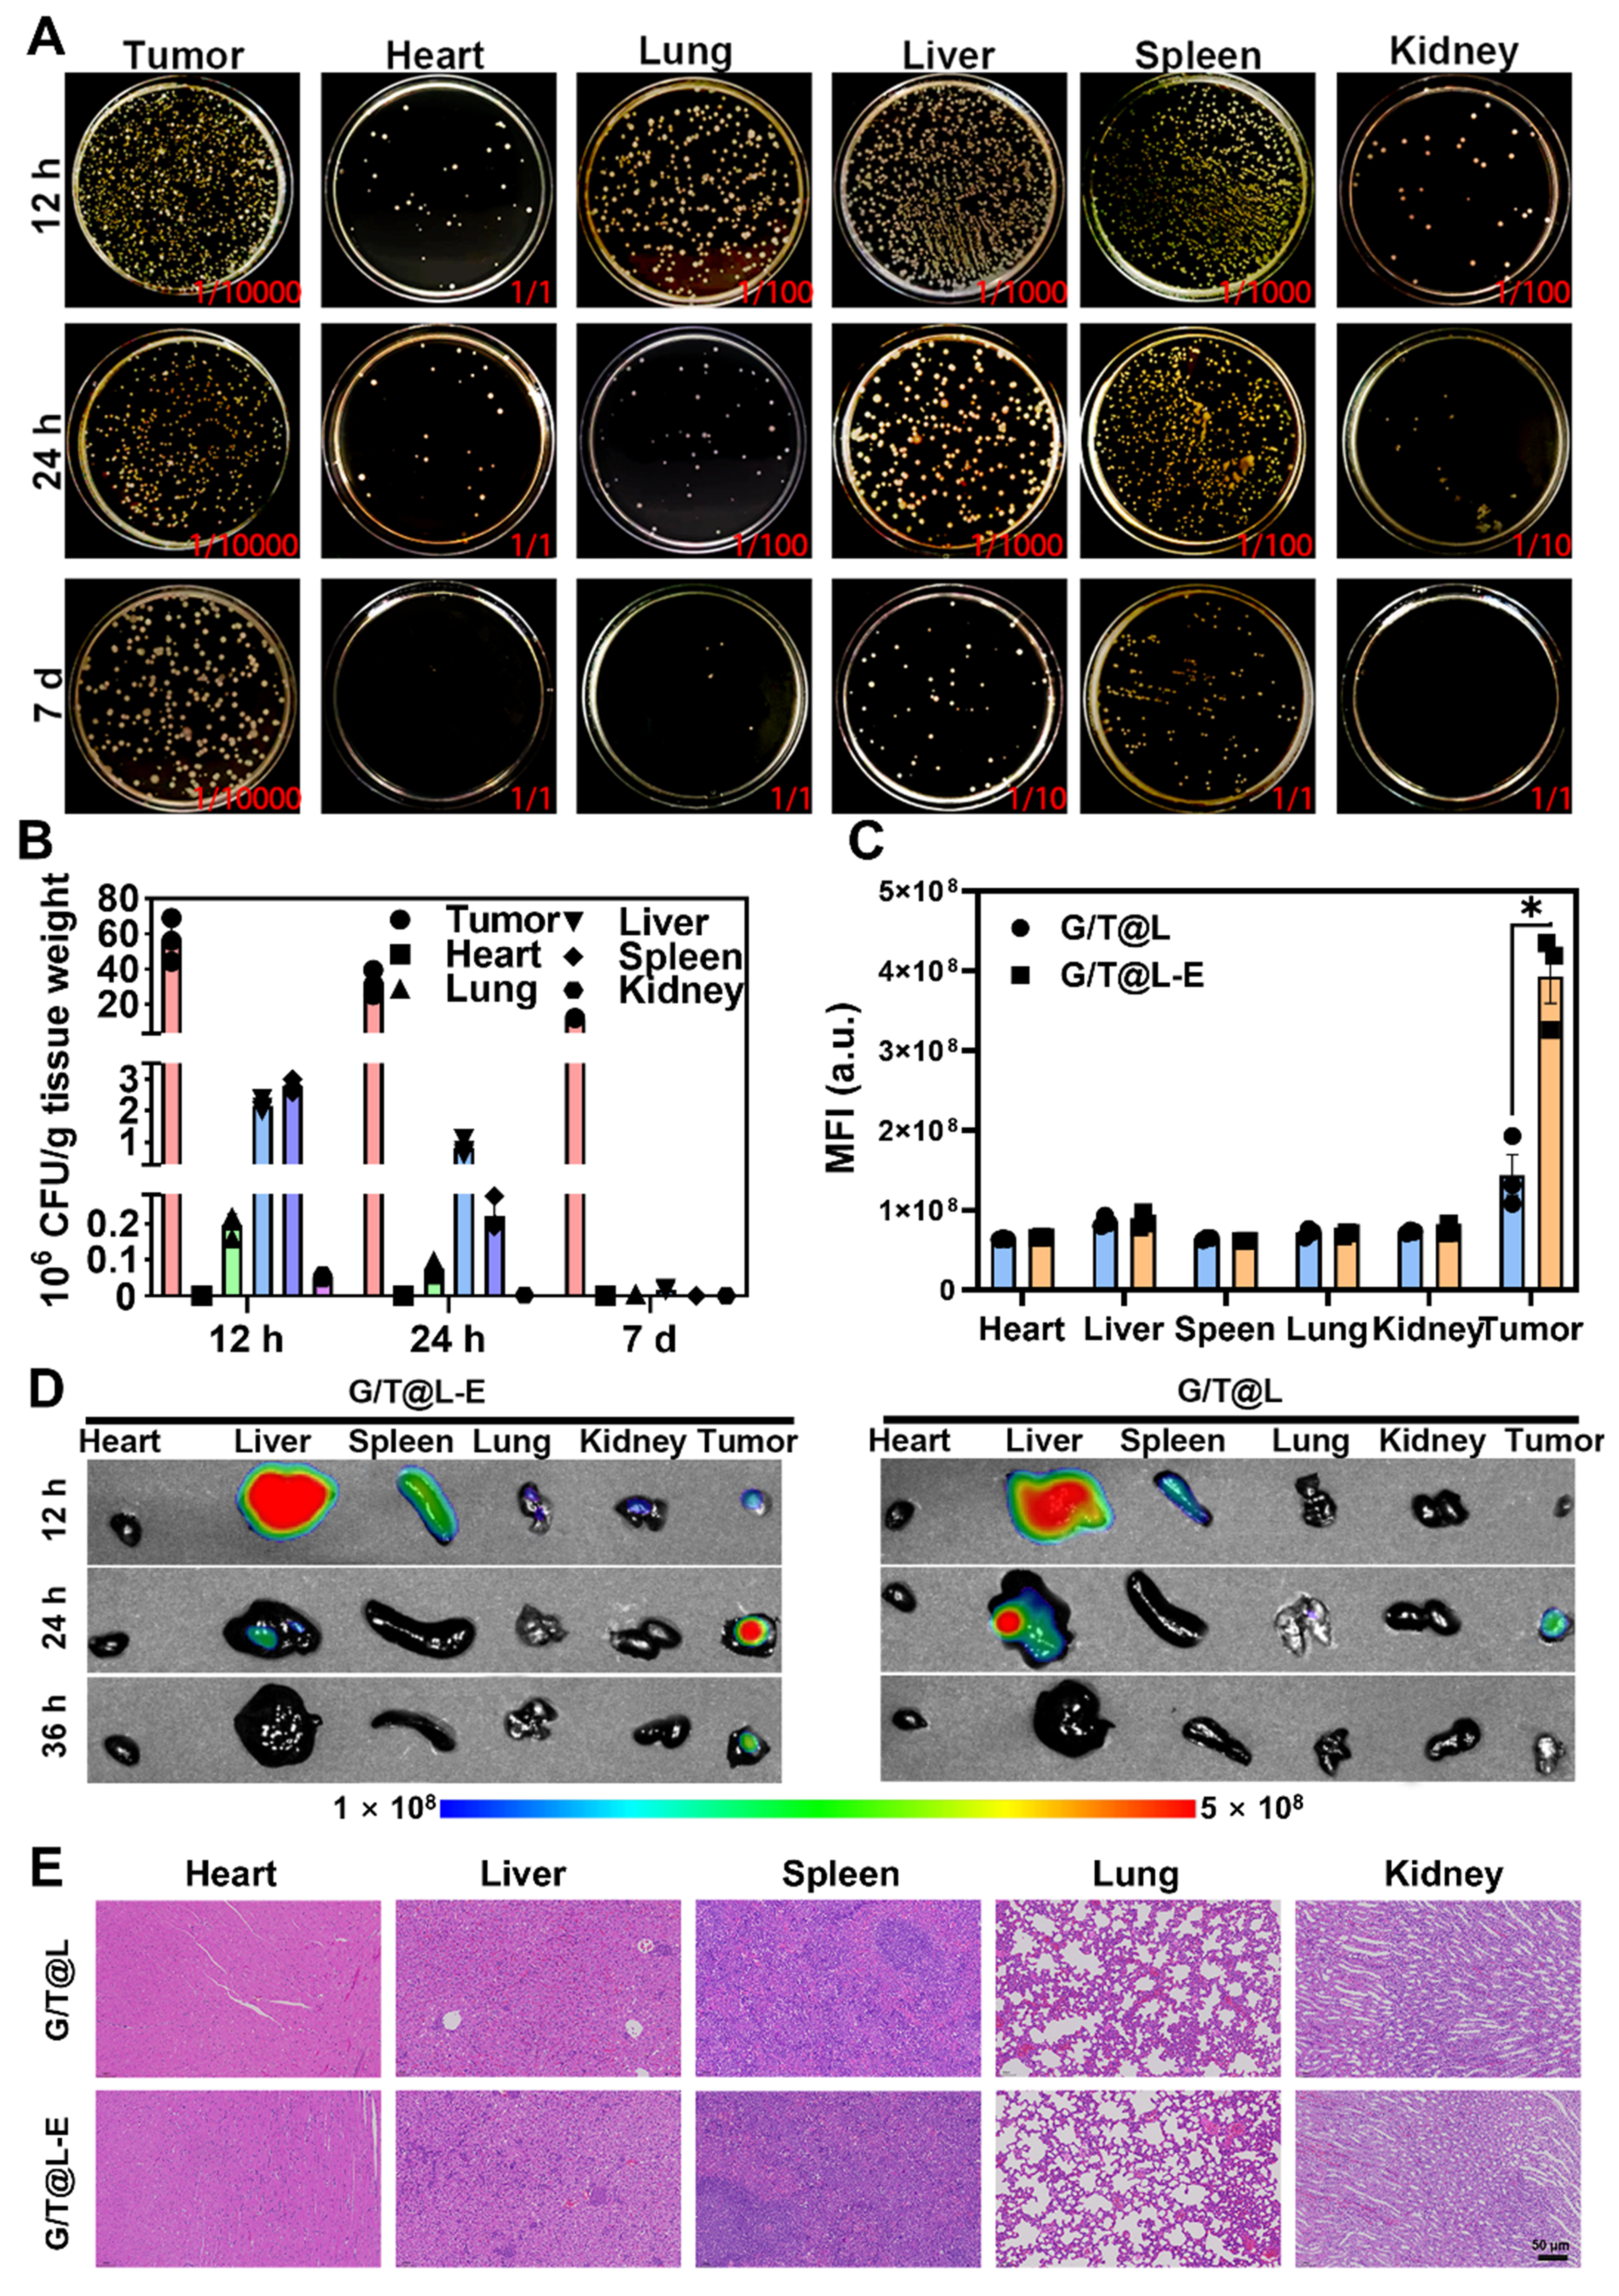
Figure 5. In vivo distribution of G/T@L-E. (A and B) Representative images and quantified CFU counts from chromogenic LB agar with serial dilutions of organs. n = 3; (C) Corresponding fluorescence intensity in 24 h and (D) in vivo fluorescence images of major organs and tumors post-injection after 12, 24, and 36 h. n = 3; (E) H&E-stained images obtained from major organs of 4T1-bearing Balb/c mice after injection of G/T@L or G/T@L-E in 24 h. Scale bar = 50 μm. Data are presented as mean ± SD. The significances were compared by two-way ANOVA followed by Tukey’s multiple comparisons test. *P < 0.05. CFU: Colony-forming unit; LB: Luria-Bertani; SD: standard deviation; ANOVA: analysis of variance; MFI: mean fluorescence intensity.





