

fig3
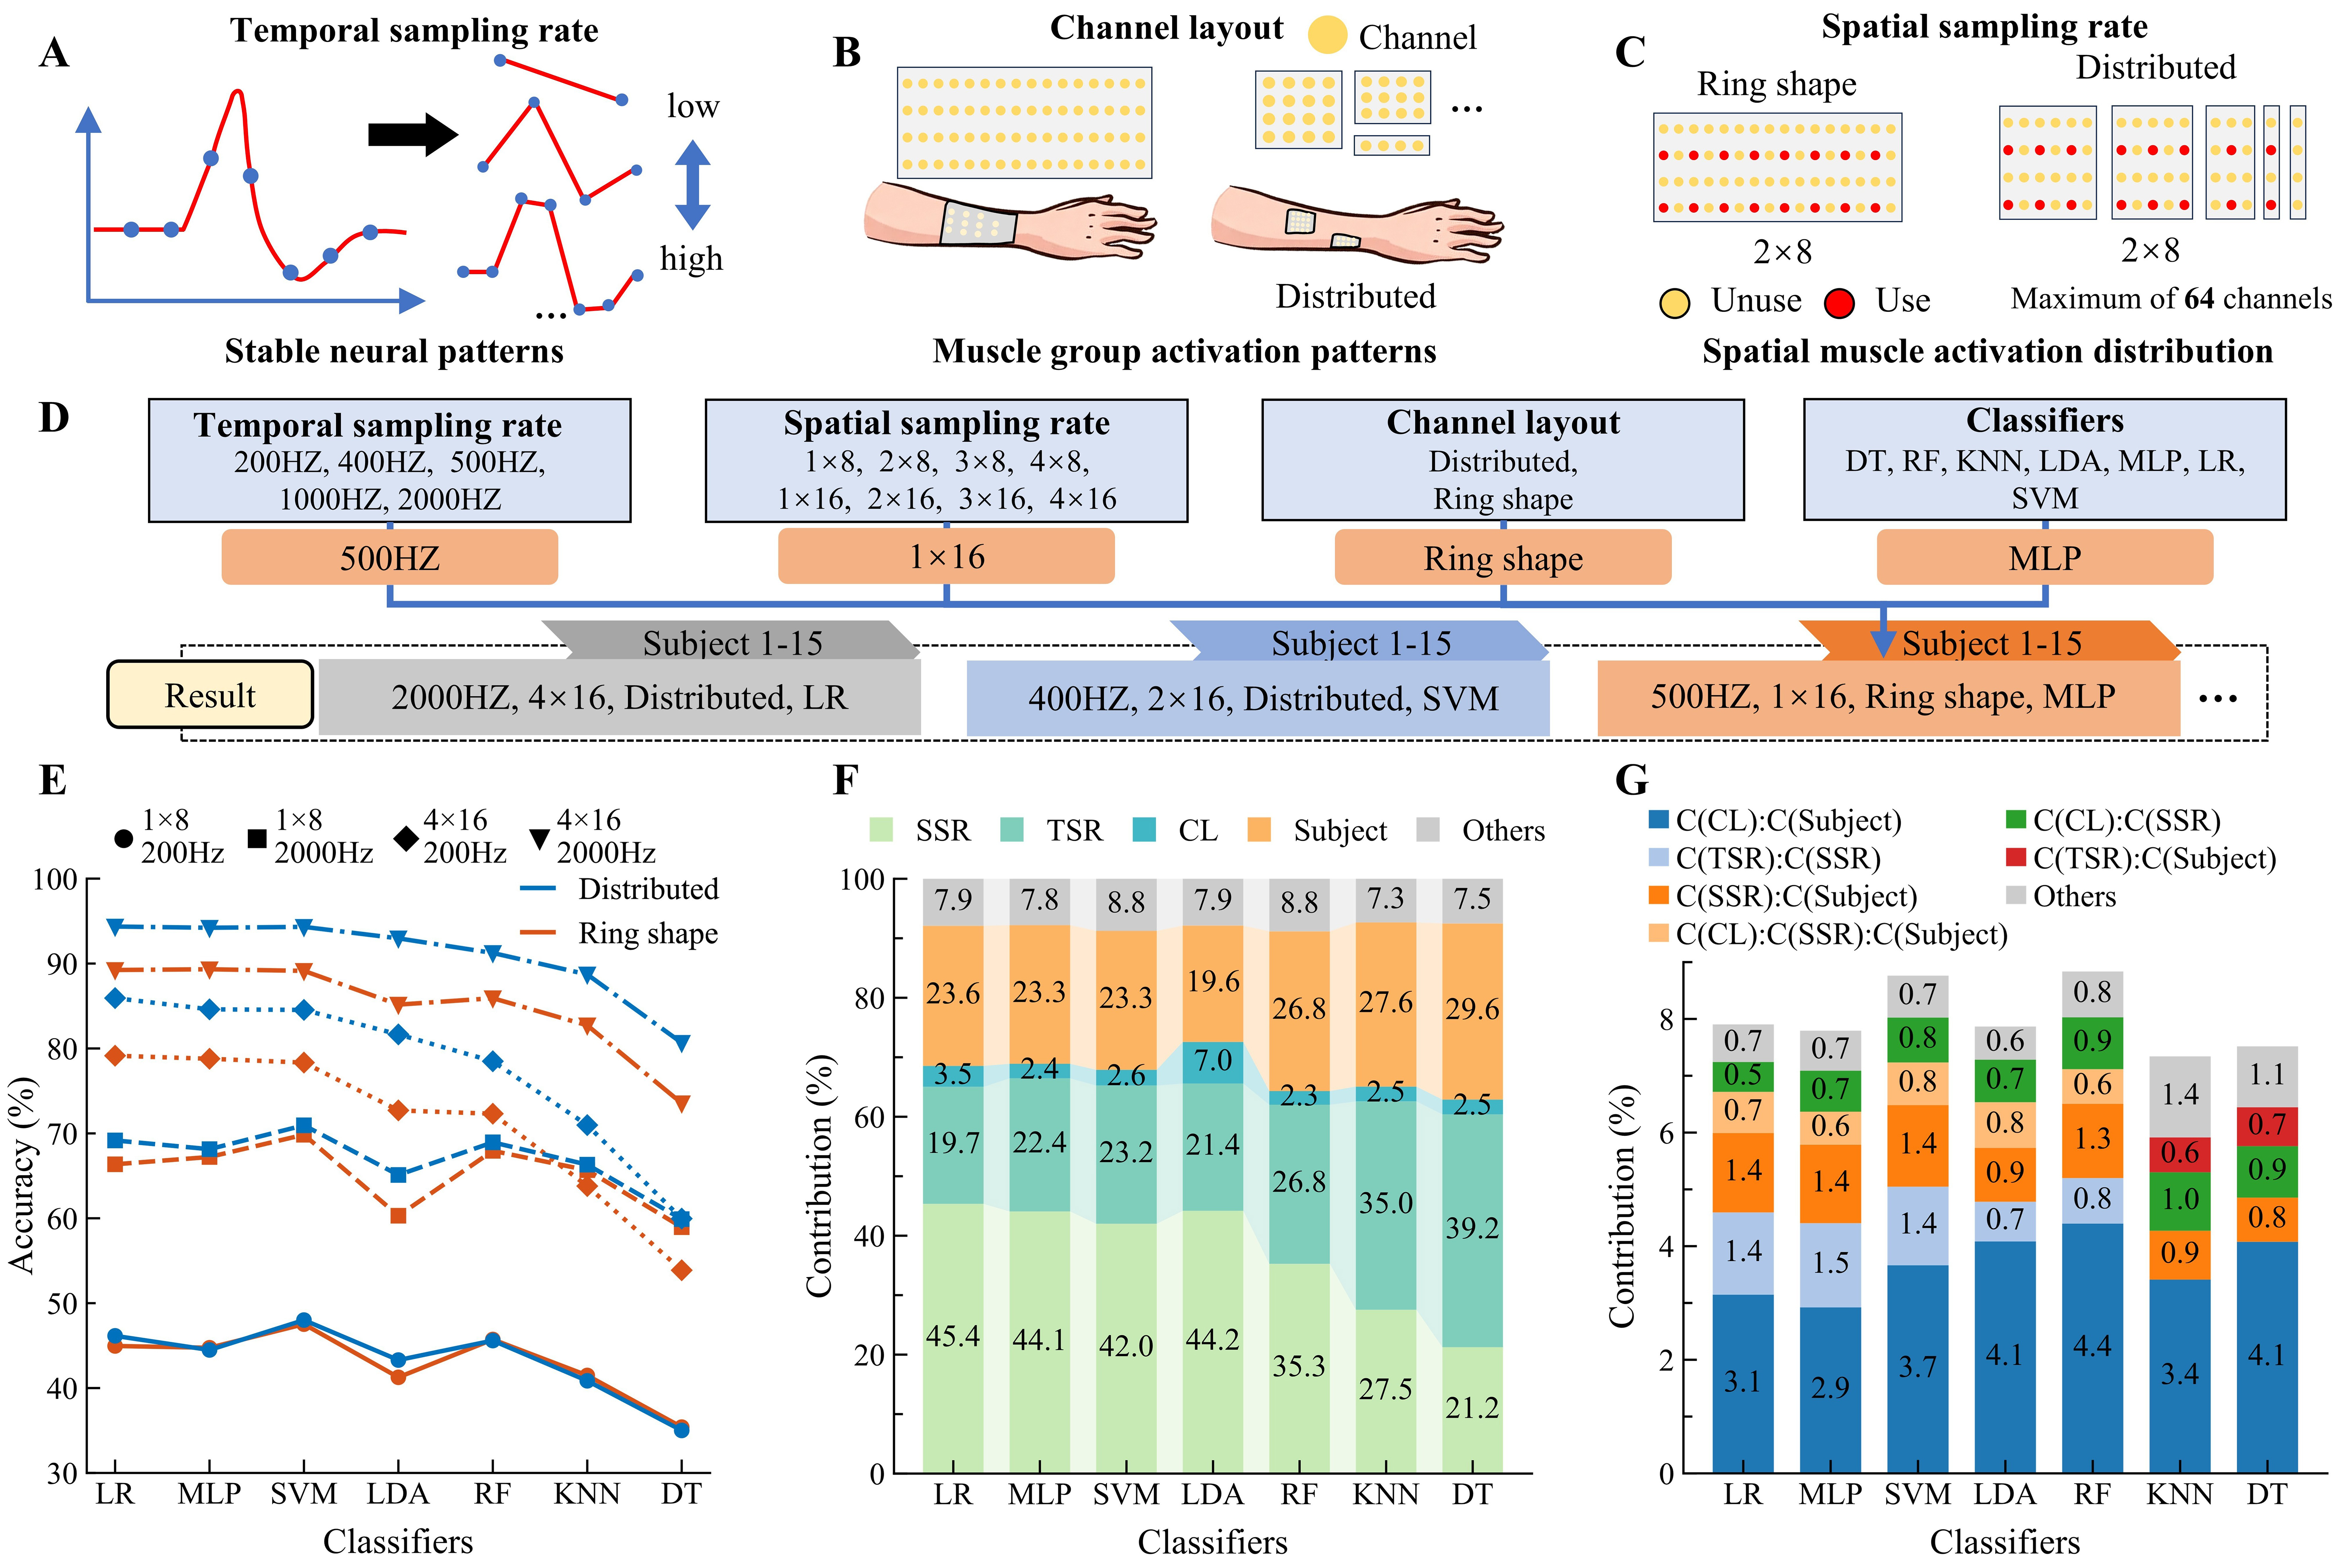
Figure 3. Variation in the recognition accuracy of low-complexity algorithms with different signal quality levels. (A-C) Schematics of experimental settings for TSR, CL, and SSR; (D) Evaluation of recognition accuracy under different combinations of data properties; (E) Recognition accuracy under various data properties. Higher data quality enables high accuracy even with low-complexity algorithms; ANOVA results for main effects (F) and higher-order interactions (G), identifying TSR and SSR as dominant factors. TSR: Temporal sampling rate; CL: channel layout; SSR: spatial sampling rate; ANOVA: analysis of variance; DT: decision tree; RF: random forest; KNN: k-nearest neighbours; LDA: linear discriminant analysis; MLP: multi-layer perceptron; LR: logistic regression; SVM: support vector machine.