


fig5
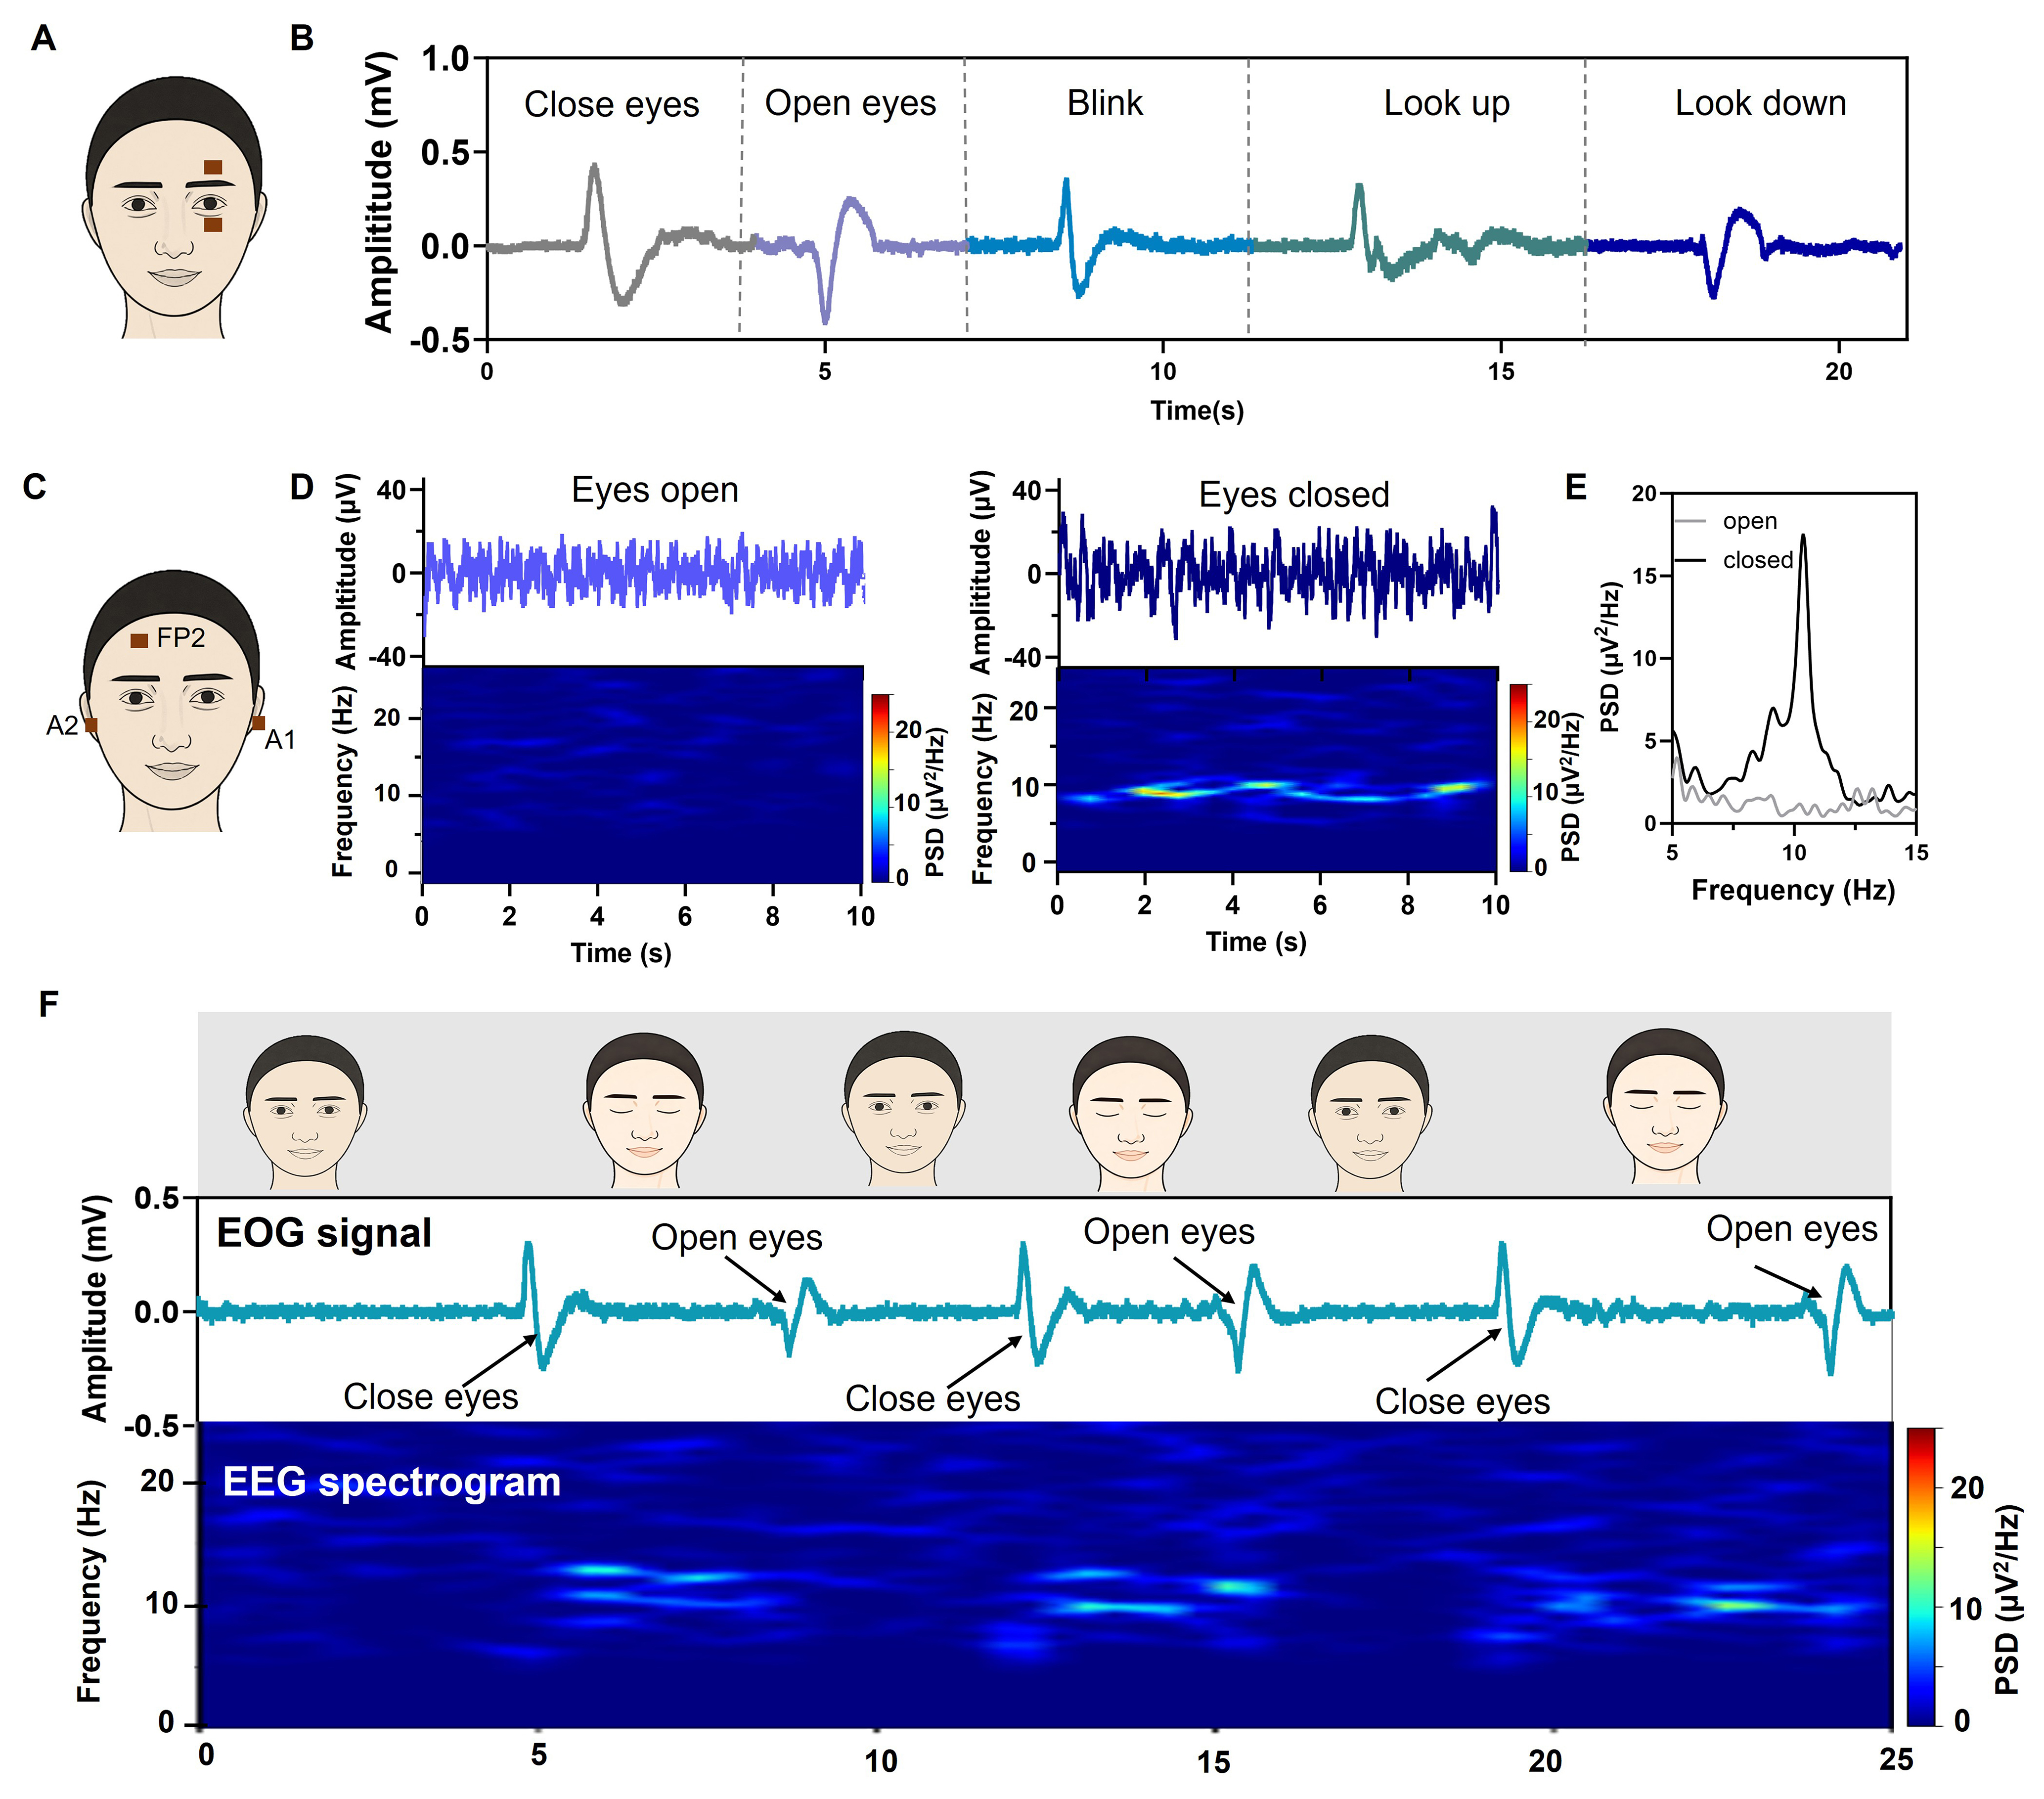
Figure 5. High-quality EOG and EEG monitoring using the air-gap-free nanomesh electrode. (A) Schematic of the experimental configuration for EOG monitoring with nanomesh electrode; (B) EOG signals recorded during various ocular activities; (C) Schematic illustration of EEG measurement setup using the nanomesh electrode; (D) EEG signals recorded during eyes-open and eyes-closed states, and corresponding spectrogram for α rhythms analysis; (E) PSD analysis of EEG signals during eyes-open and eyes-closed states; (F) EOG signals and EEG spectrogram during the eye-opening-closing cycle. EOG: Electrooculography; EEG: electroencephalography; PSD: power spectral density.


