

fig5
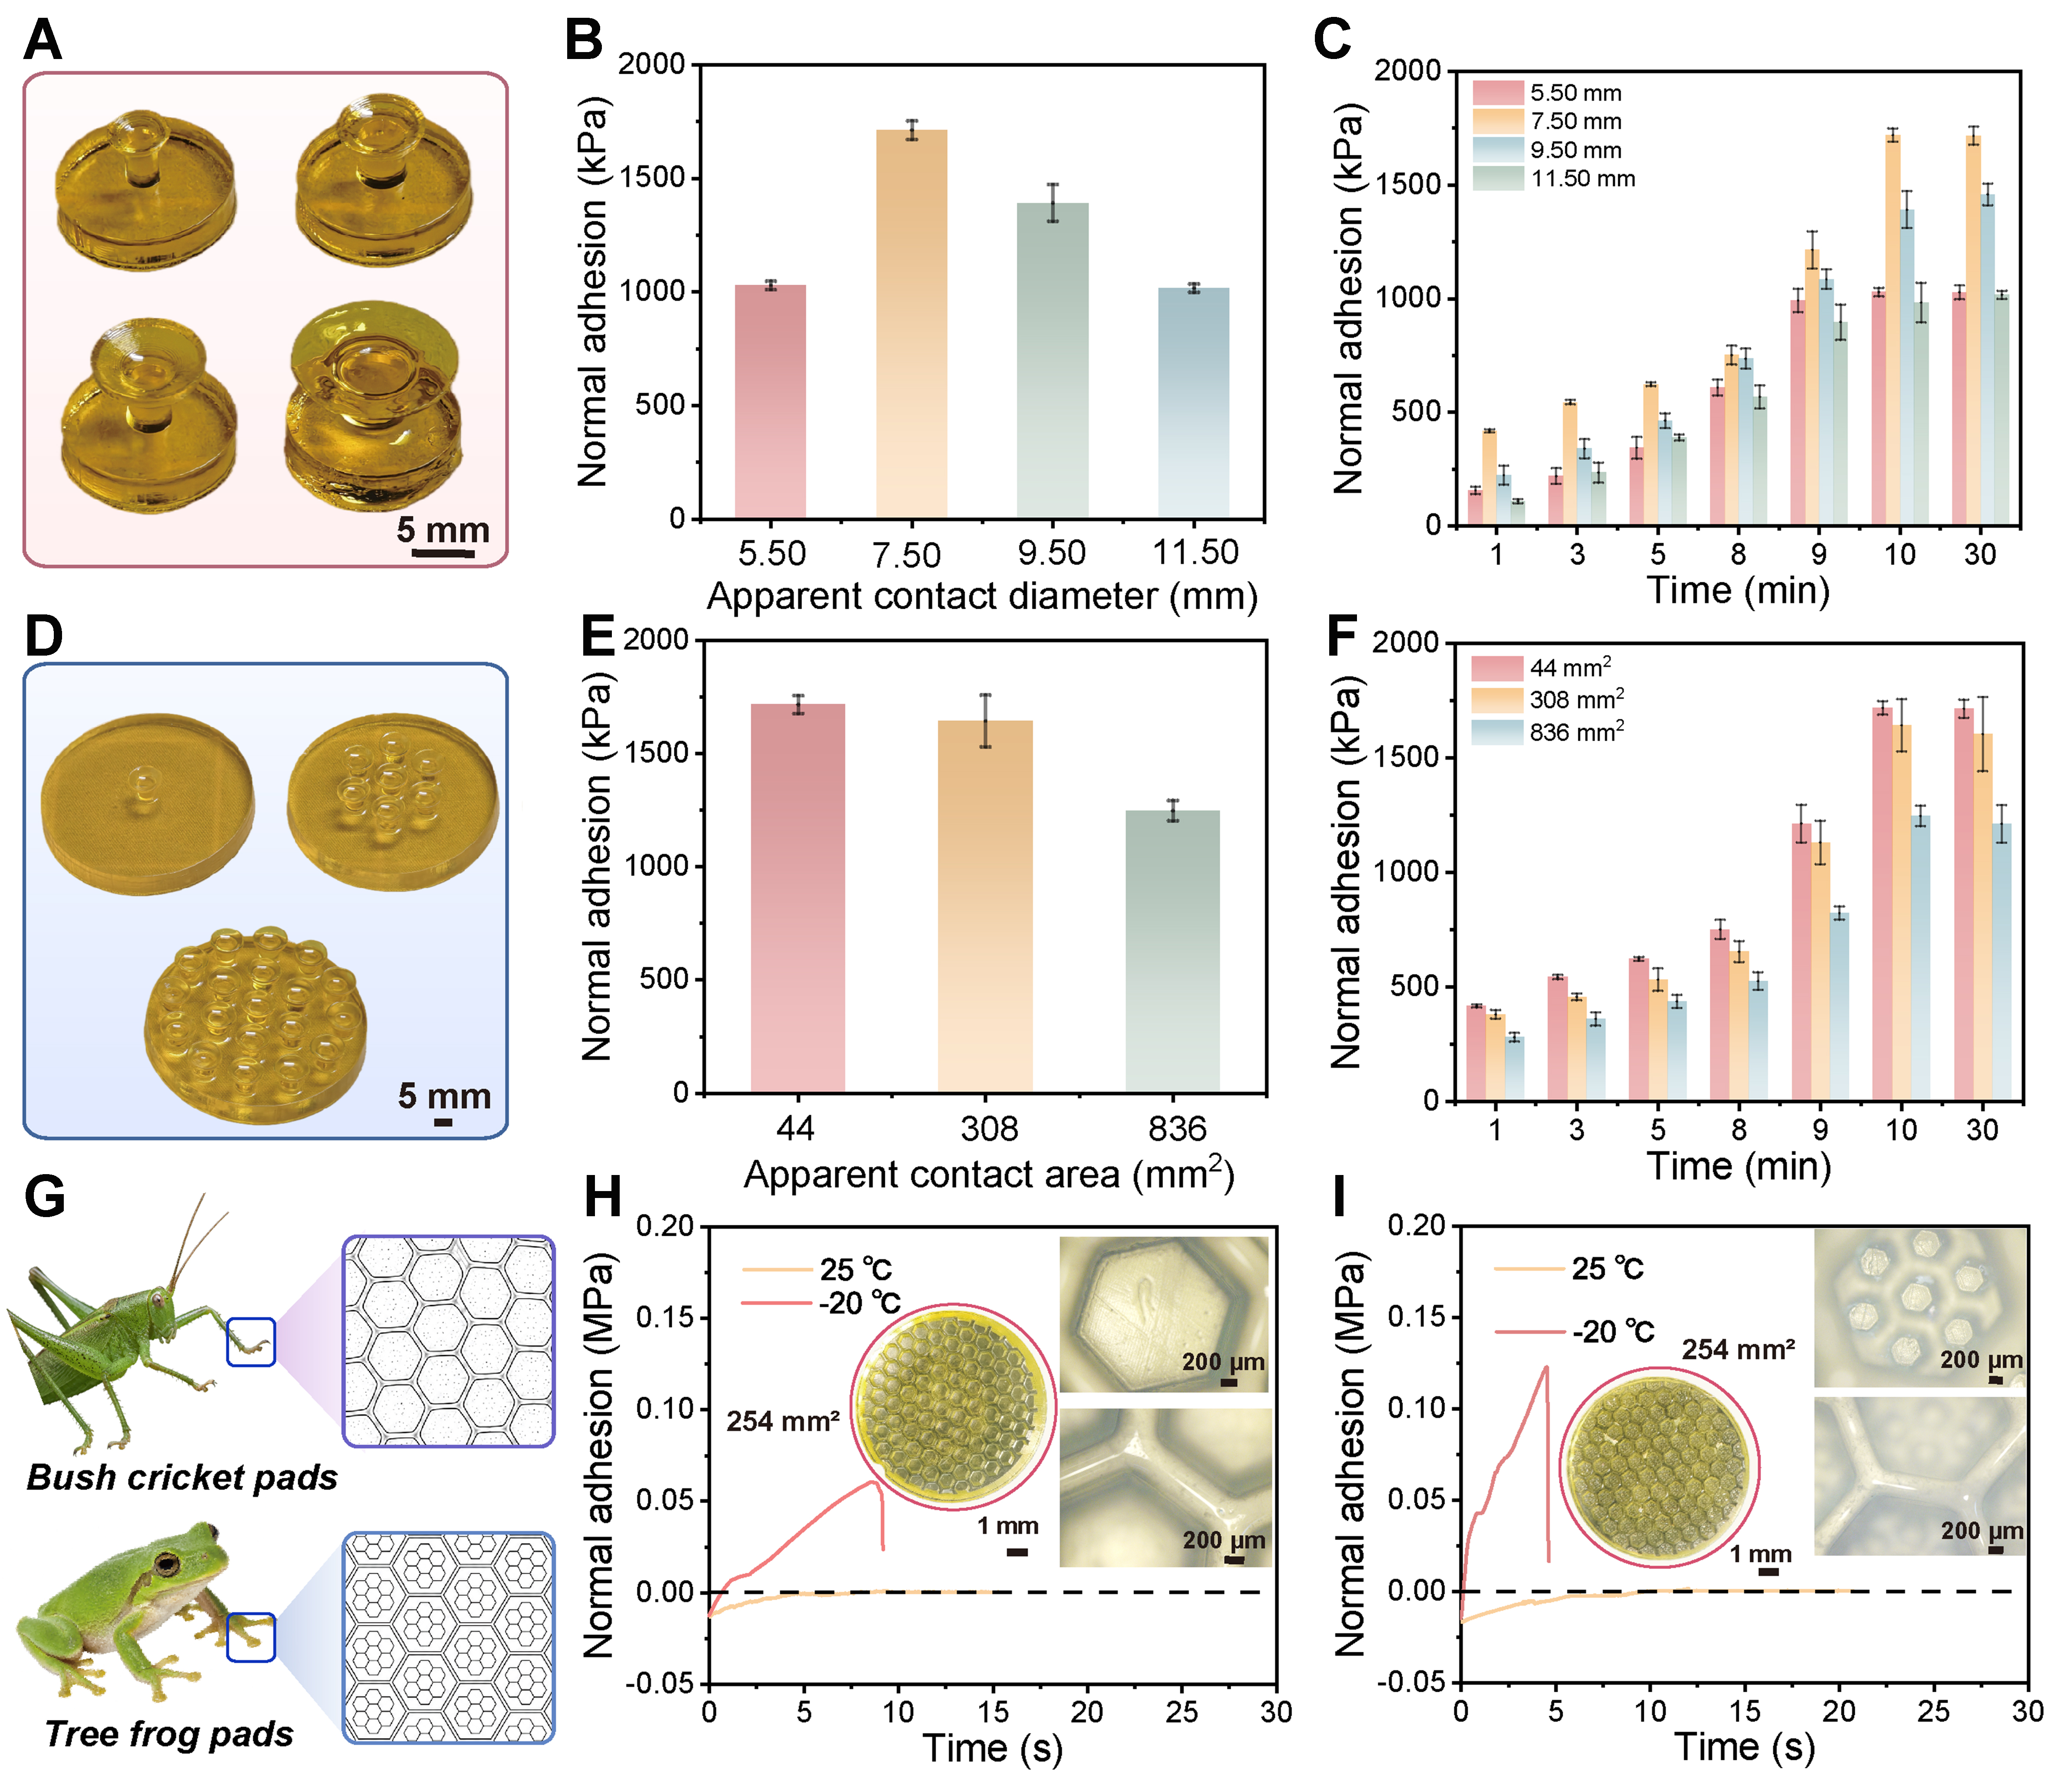
Figure 5. Adhesion performance of ice-activated hydrogel suction cups and arrays with different structures. (A) Photos of a single hydrogel suction cup with different apparent contact diameters; (B) Adhesion of a single hydrogel suction cup with different apparent contact diameters; (C) Adhesion of a single hydrogel suction cup at different freezing times; (D) Photos of hydrogel suction cup arrays with different apparent contact areas; (E) Adhesion of hydrogel suction cup arrays with different apparent contact areas; (F) Adhesion of hydrogel suction cup arrays at different freezing times; (G) Schematic illustration of the bush cricket pads and the tree frog pads; (H) Adhesion of hydrogel bush cricket pads at 25 and -20 °C; (I) Adhesion of hydrogel tree frog pads at 25 and -20 °C. Error bars represent ± SD (n = 3). The elements in (A and D) were photographed by the authors. SD: Standard deviation.