fig6
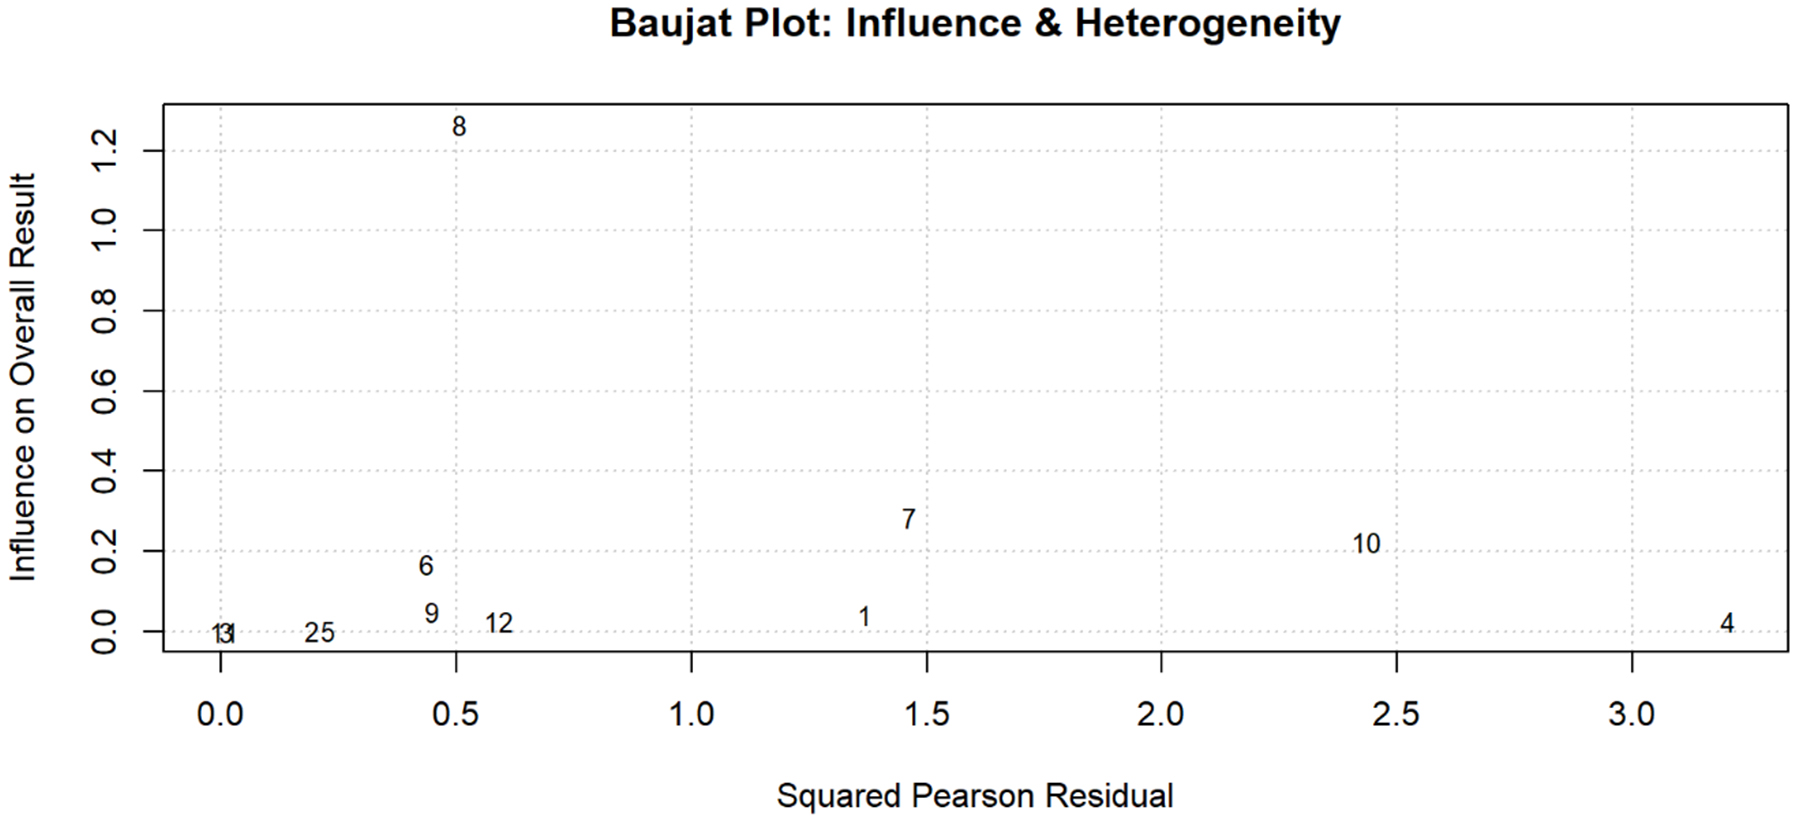
Figure 6. Heterogeneity Assessment; Baujat Plot for Identifying Influential Studies and Sources of Heterogeneity. Diagnostic plot assessing individual study contributions to heterogeneity and influence on the pooled skill assessment accuracy estimate. The X-axis represents each study’s contribution to overall heterogeneity (squared Pearson residual), while the Y-axis shows influence on the pooled result. Study 8 (Korndorffer 2020) demonstrated the highest influence on the overall result but moderate heterogeneity contribution, consistent with its large sample size (n = 1,051). Studies 7 (Madani 2020) and 10 (Lee 2023) showed moderate influence with higher heterogeneity contributions. Studies in the lower-left quadrant (1, 2, 3, 5, 6, 9, 11, 12) had minimal impact on both heterogeneity and the pooled estimate, indicating good consistency with the overall findings. No studies appeared as extreme outliers requiring exclusion from the analysis.