


fig4
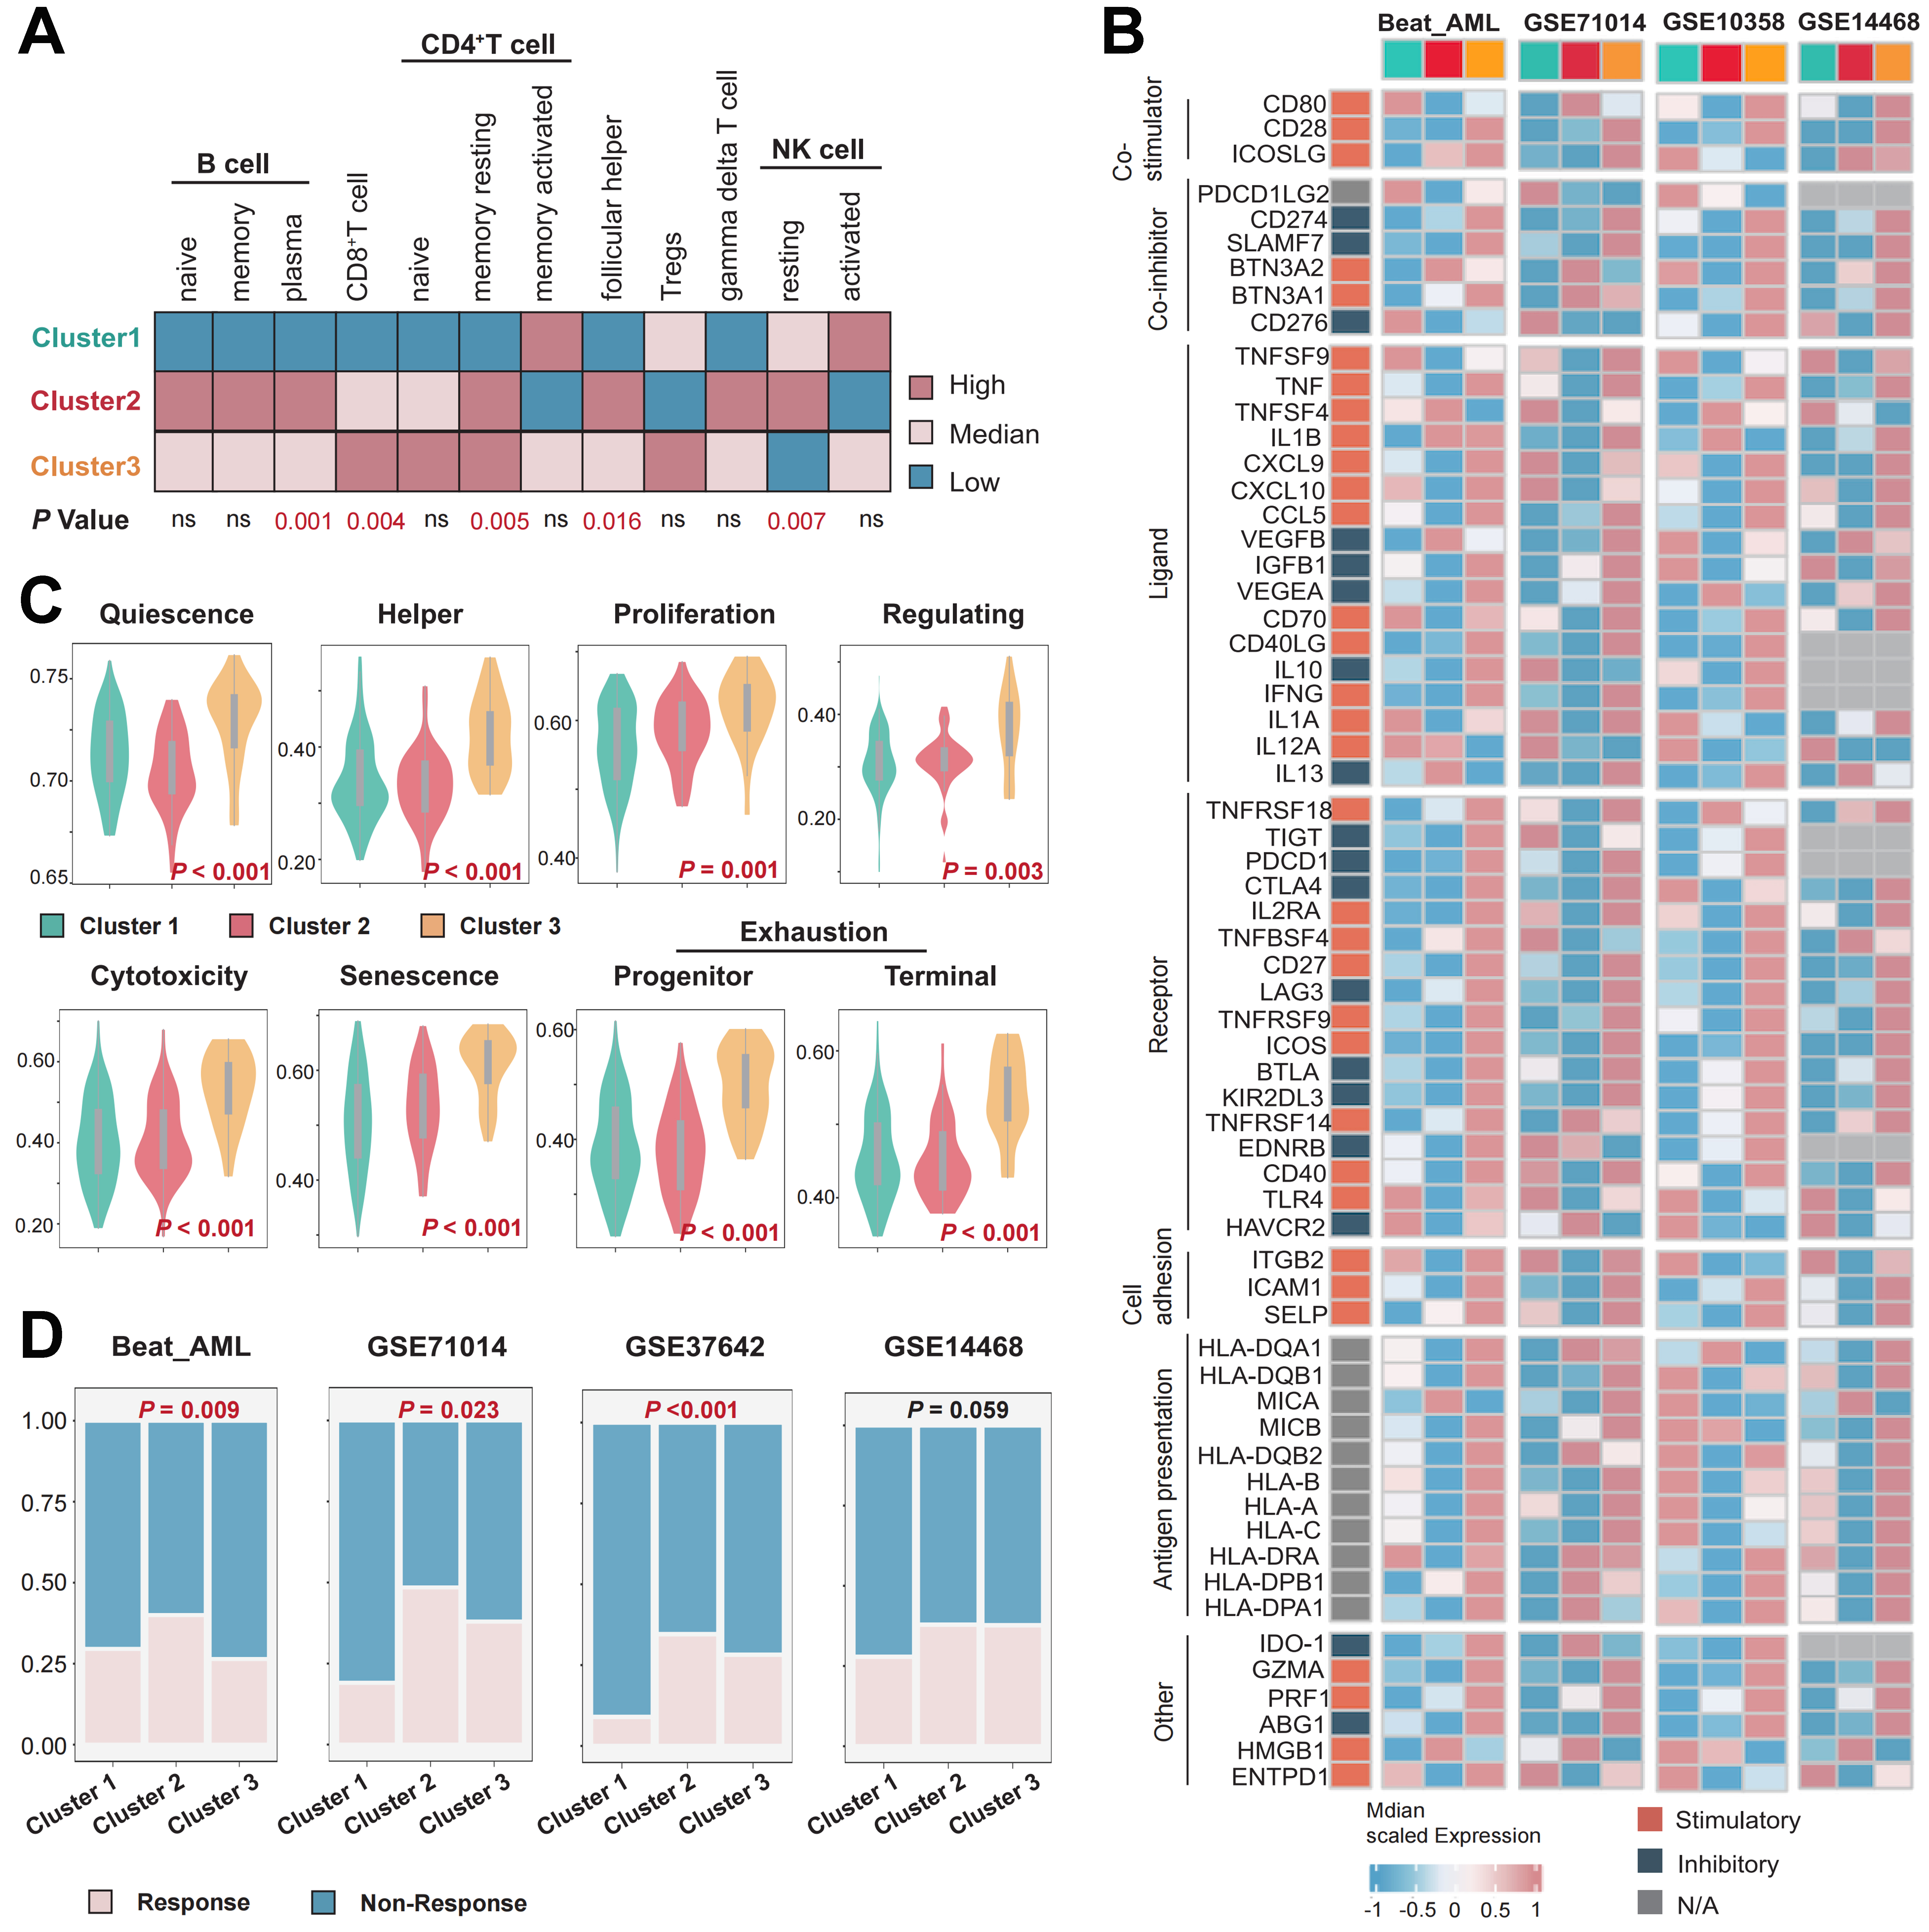
Figure 4. Differences in the immune microenvironment and immune therapy response among the three subtypes. (A) Immune cell infiltration landscape across different clusters; (B) Differences in the expression levels of immune regulatory molecules in multiple cohorts, including Beat-AML, GSE71014, GSE10358, and GSE14468; (C) Differences in T cell states in the TCGA-LAML cohort; (D) Evaluation of immune therapy response across different clusters in the Beat-AML, GSE71014, GSE37642, and GSE14468 cohorts. Differences among three or more groups were assessed with the Kruskal-Wallis test, categorical variables were analyzed using the chi-square test or Fisher’s exact test. P < 0.05 was considered statistically significant. ns indicates not significant. AML: Acute myeloid leukemia; TCGA-LAML: The Cancer Genome Atlas-Acute Myeloid Leukemia; NK: natural killer.


