





fig2
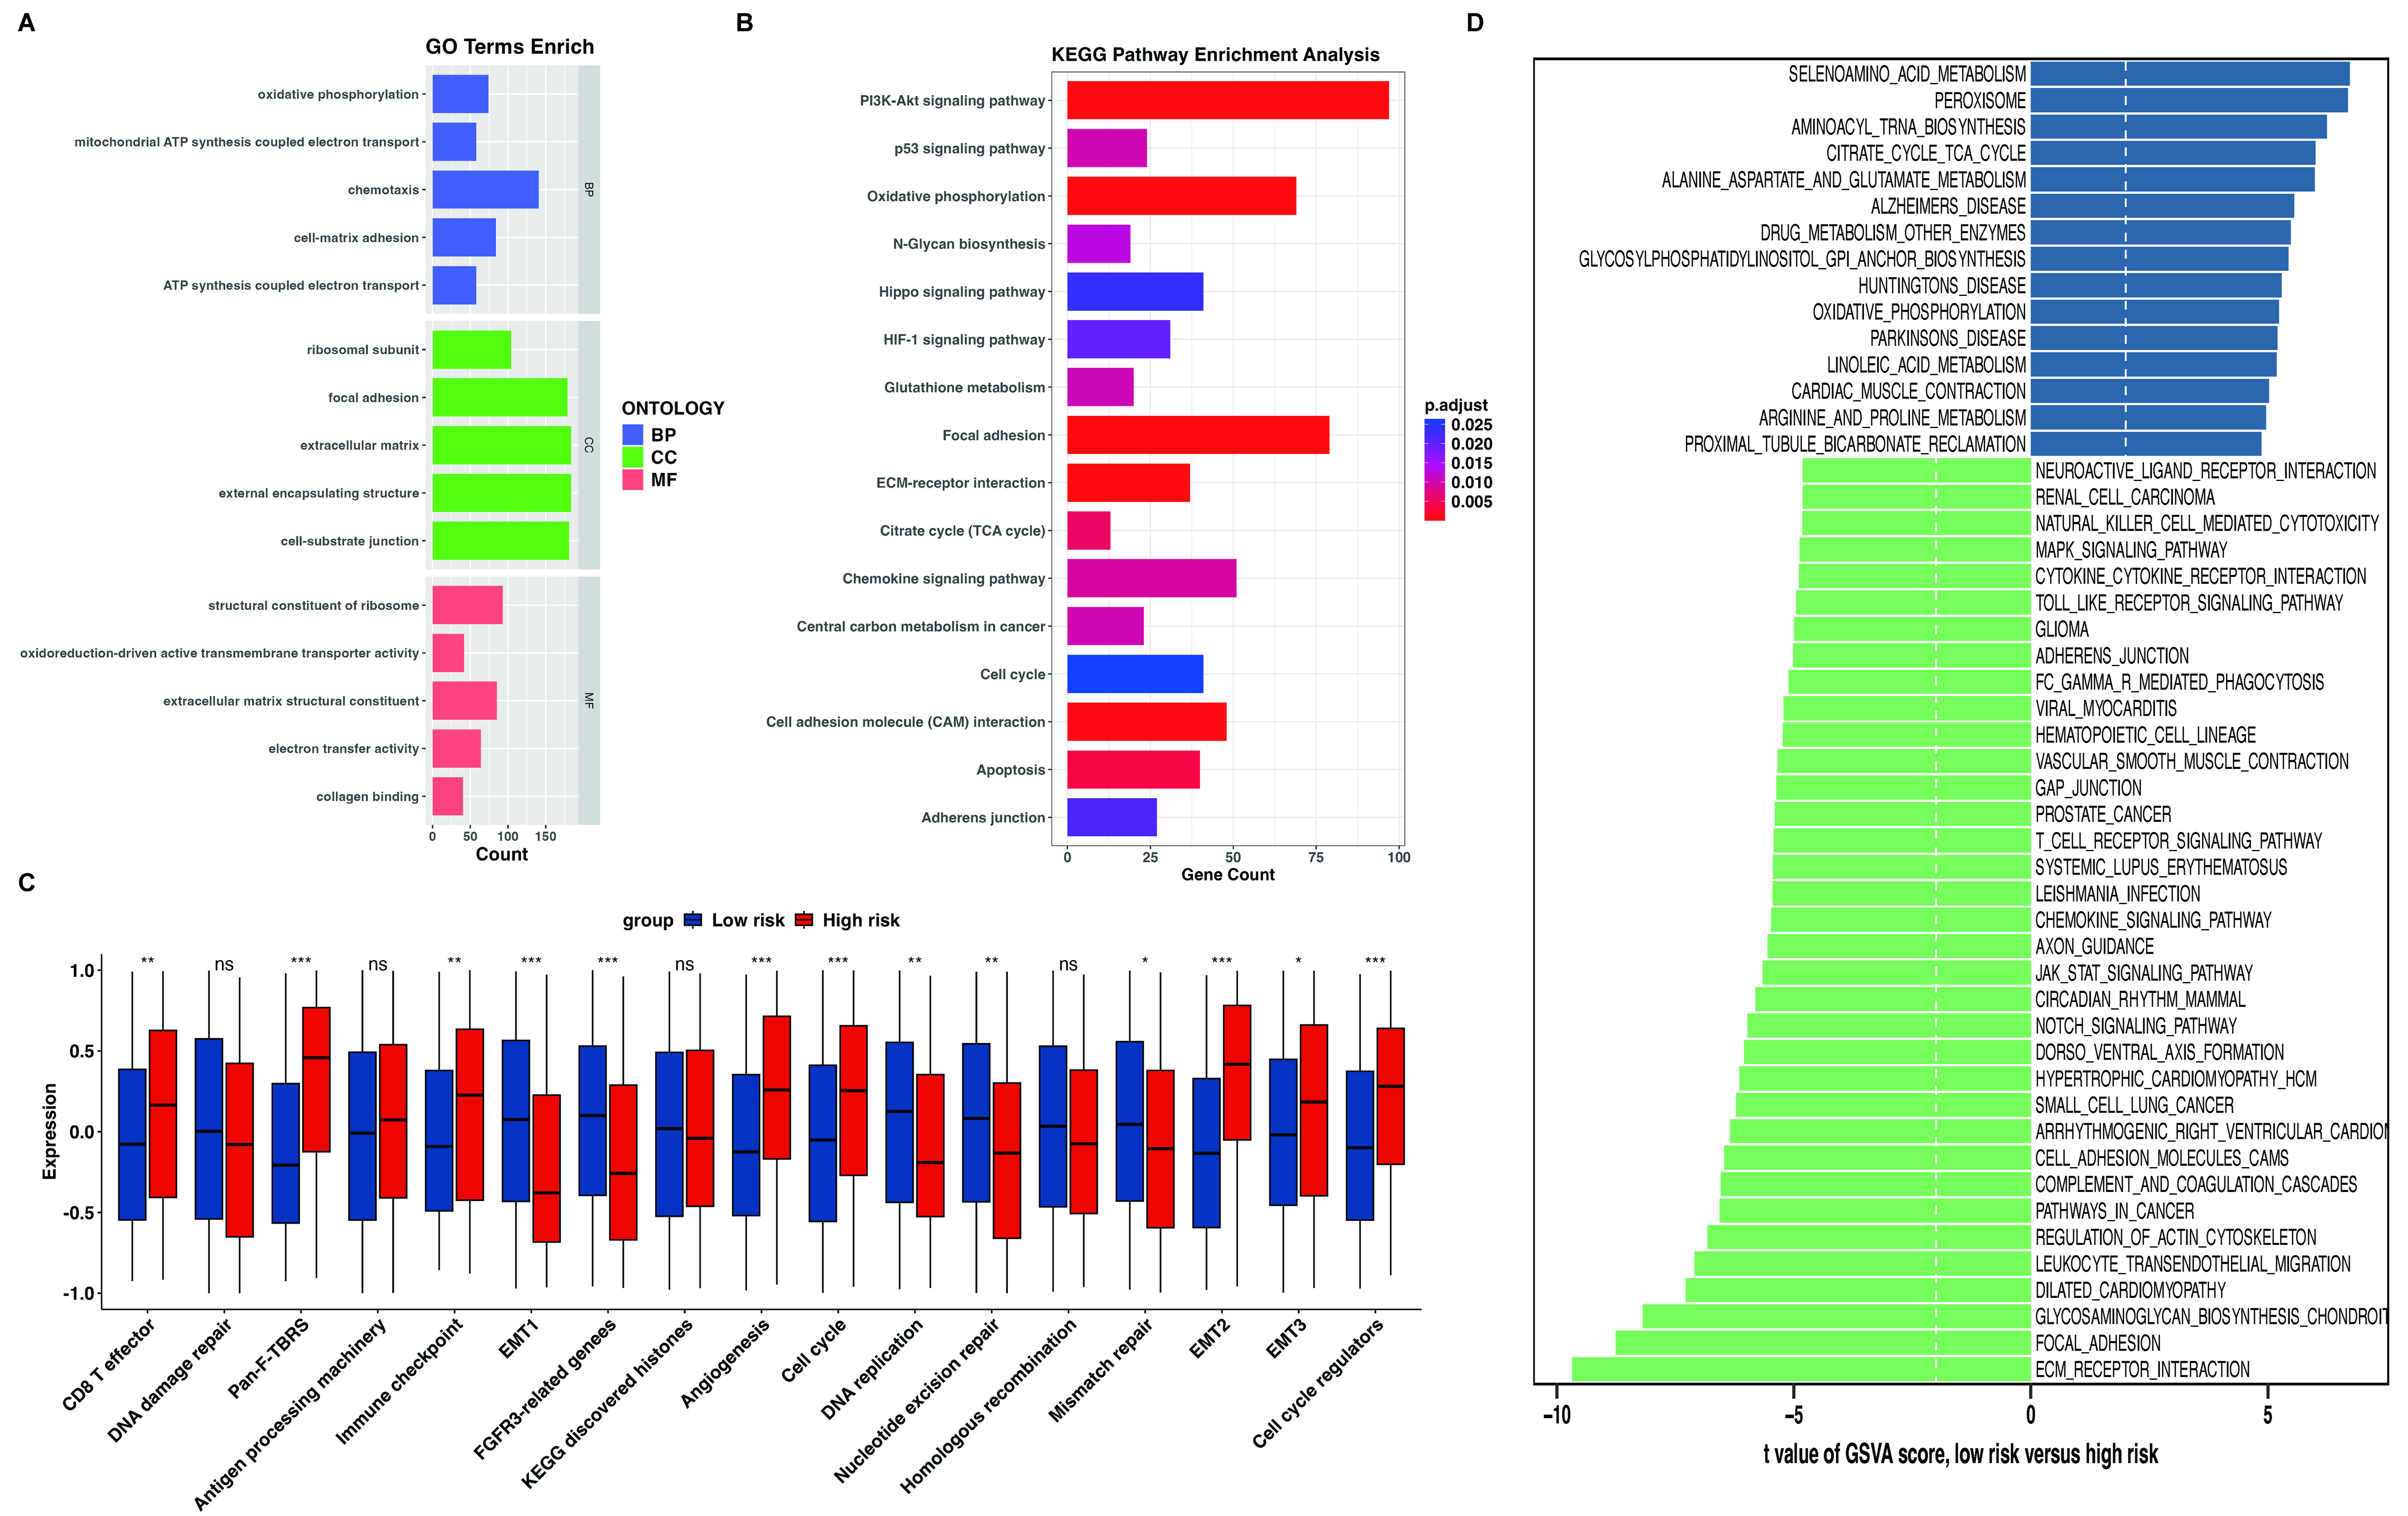
Figure 2. Biological and TME infiltration characteristics in the high- and low-risk groups. (A) Functional enrichment of DEGs via GO analysis comparing the high-risk and low-risk subgroups; (B) KEGG pathway enrichment of DEGs derived from the two groups; (C) GSVA was utilized to quantify and compare varied biological processes across different risk subgroups; (D) Bar charts illustrating the GSVA scores of typical KEGG signaling pathways collected from MSigDB in distinct groups. ns indicates P ≥ 0.05, * indicates P < 0.05, ** indicates P < 0.01, and *** indicates P < 0.001. TME: Tumor microenvironment; DEGs: differentially expressed genes; GO: Gene Ontology; KEGG: Kyoto Encyclopedia of Genes and Genomes; GSVA: Gene Set Variation Analysis; ATP: adenosine triphosphate; BP: biological process; CC: cellular component; MF: molecular function; ECM: extracellular matrix; TCA: tricarboxylic acid cycle.





