





fig6
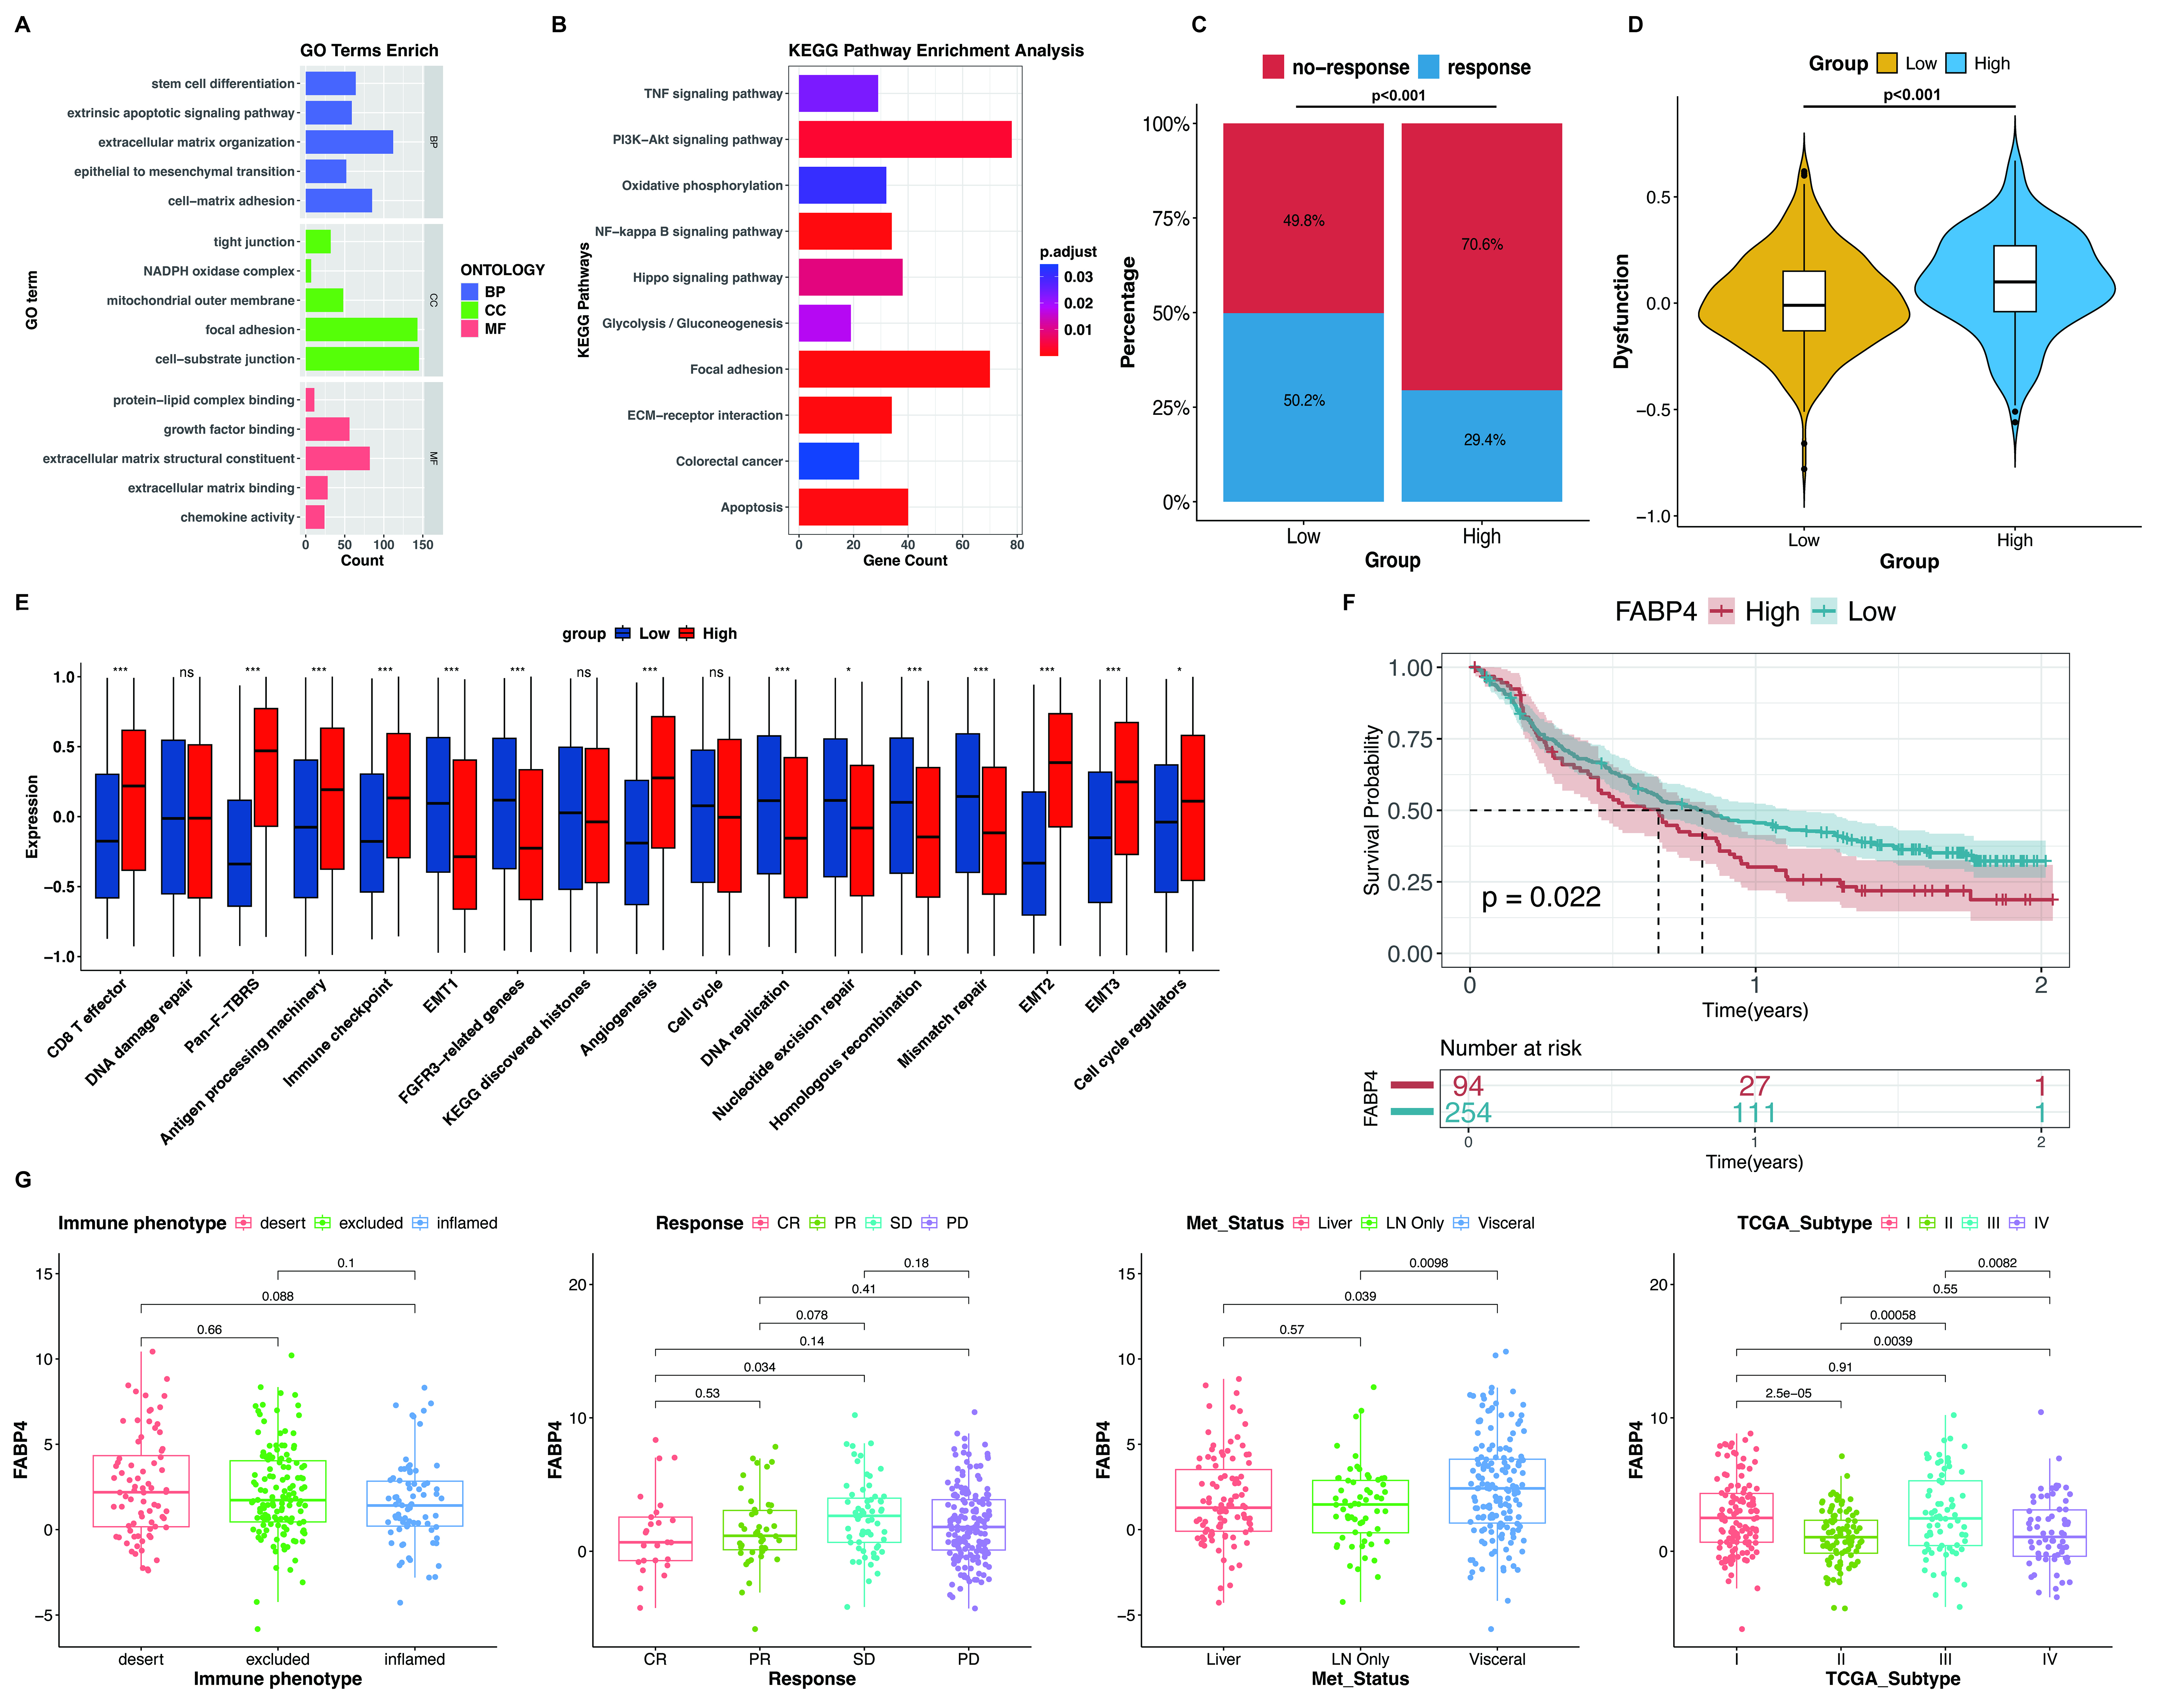
Figure 6. Correlation of biological signatures and immunotherapy response with FABP4 expression levels. (A) Functional GO enrichment of DEGs identified from FABP4-high and FABP4-low subgroups; (B) KEGG pathway enrichment based on DEGs screened from the two groups; (C) Variations in the proportion of responsive cases to immune treatment among different FABP4 expression subgroups; (D) The dysfunction score in the two groups was detected by TIDE analysis; (E) GSVA analysis was used to detect the differences in biological processes between the two groups; (F) Survival outcomes of the two patient groups in the IMvigor210 cohort; (G) The correlations between the level of FABP4 and immune phenotype, treatment response, metastatic state, and TCGA subtype. For (D and G), statistical significance was assessed using two-sided Wilcoxon rank-sum tests. For (C), the difference in response proportions between the two groups was evaluated using Pearson’s Chi-square test. * indicates P < 0.05, and *** indicates P < 0.001. GO: Gene Ontology; DEGs: differentially expressed genes; KEGG: Kyoto Encyclopedia of Genes and Genomes; TIDE: tumor immune dysfunction and exclusion; GSVA: Gene Set Variation Analysis; TCGA: the Cancer Genome Atlas; BP: biological process; CC: cellular component; MF: molecular function; CR: complete response; PR: partial response; SD: stable disease; PD: progressive disease.





