


fig2
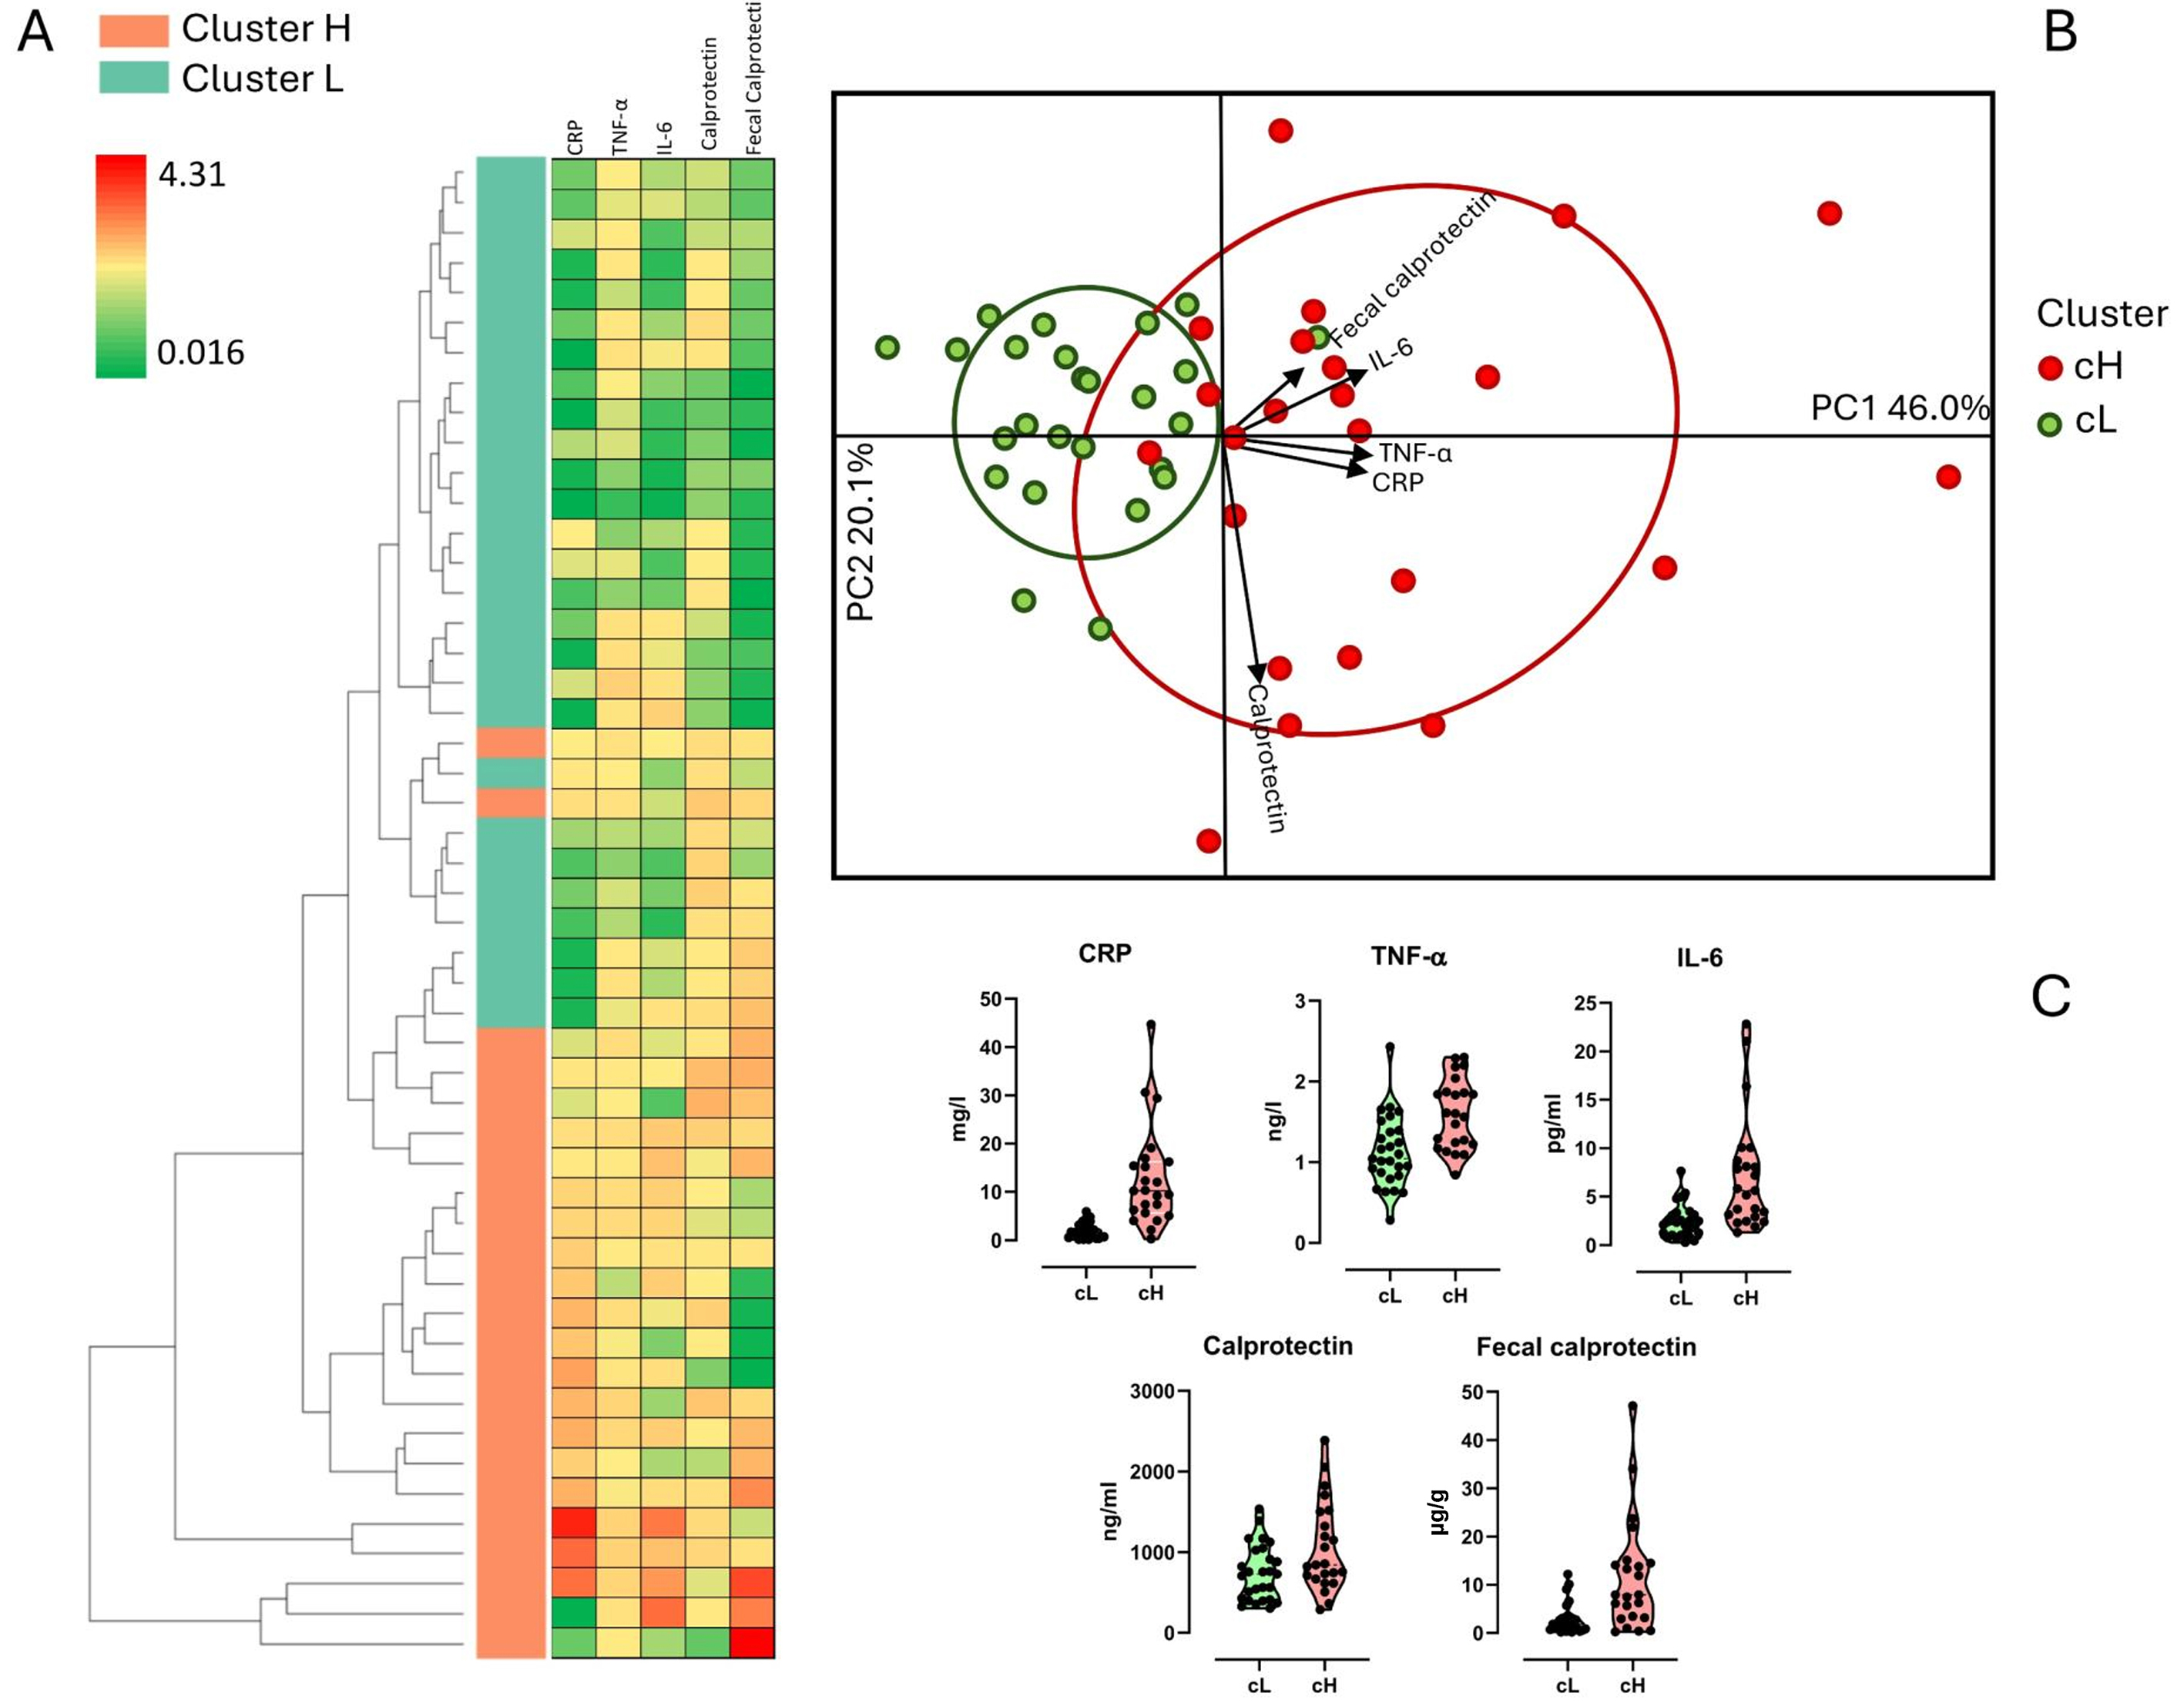
Figure 2. Clustering of subjects based on inflammatory markers. Stratification into two distinct clusters, namely cH (cluster high) and cL (cluster low), was based on levels of C-reactive protein (CRP), tumor necrosis factor-alpha (TNF-α), interleukin-6 (IL-6), serum calprotectin (Calprotectin), and fecal calprotectin. (A) Heatmap depicting an unsupervised model of inflammatory variables; high and low abundances are represented by red and green colors, respectively; (B) Biplot illustrating subjects according to inflammatory markers; (C) Violin plot displaying inflammatory marker levels grouped by cluster.


