


fig3
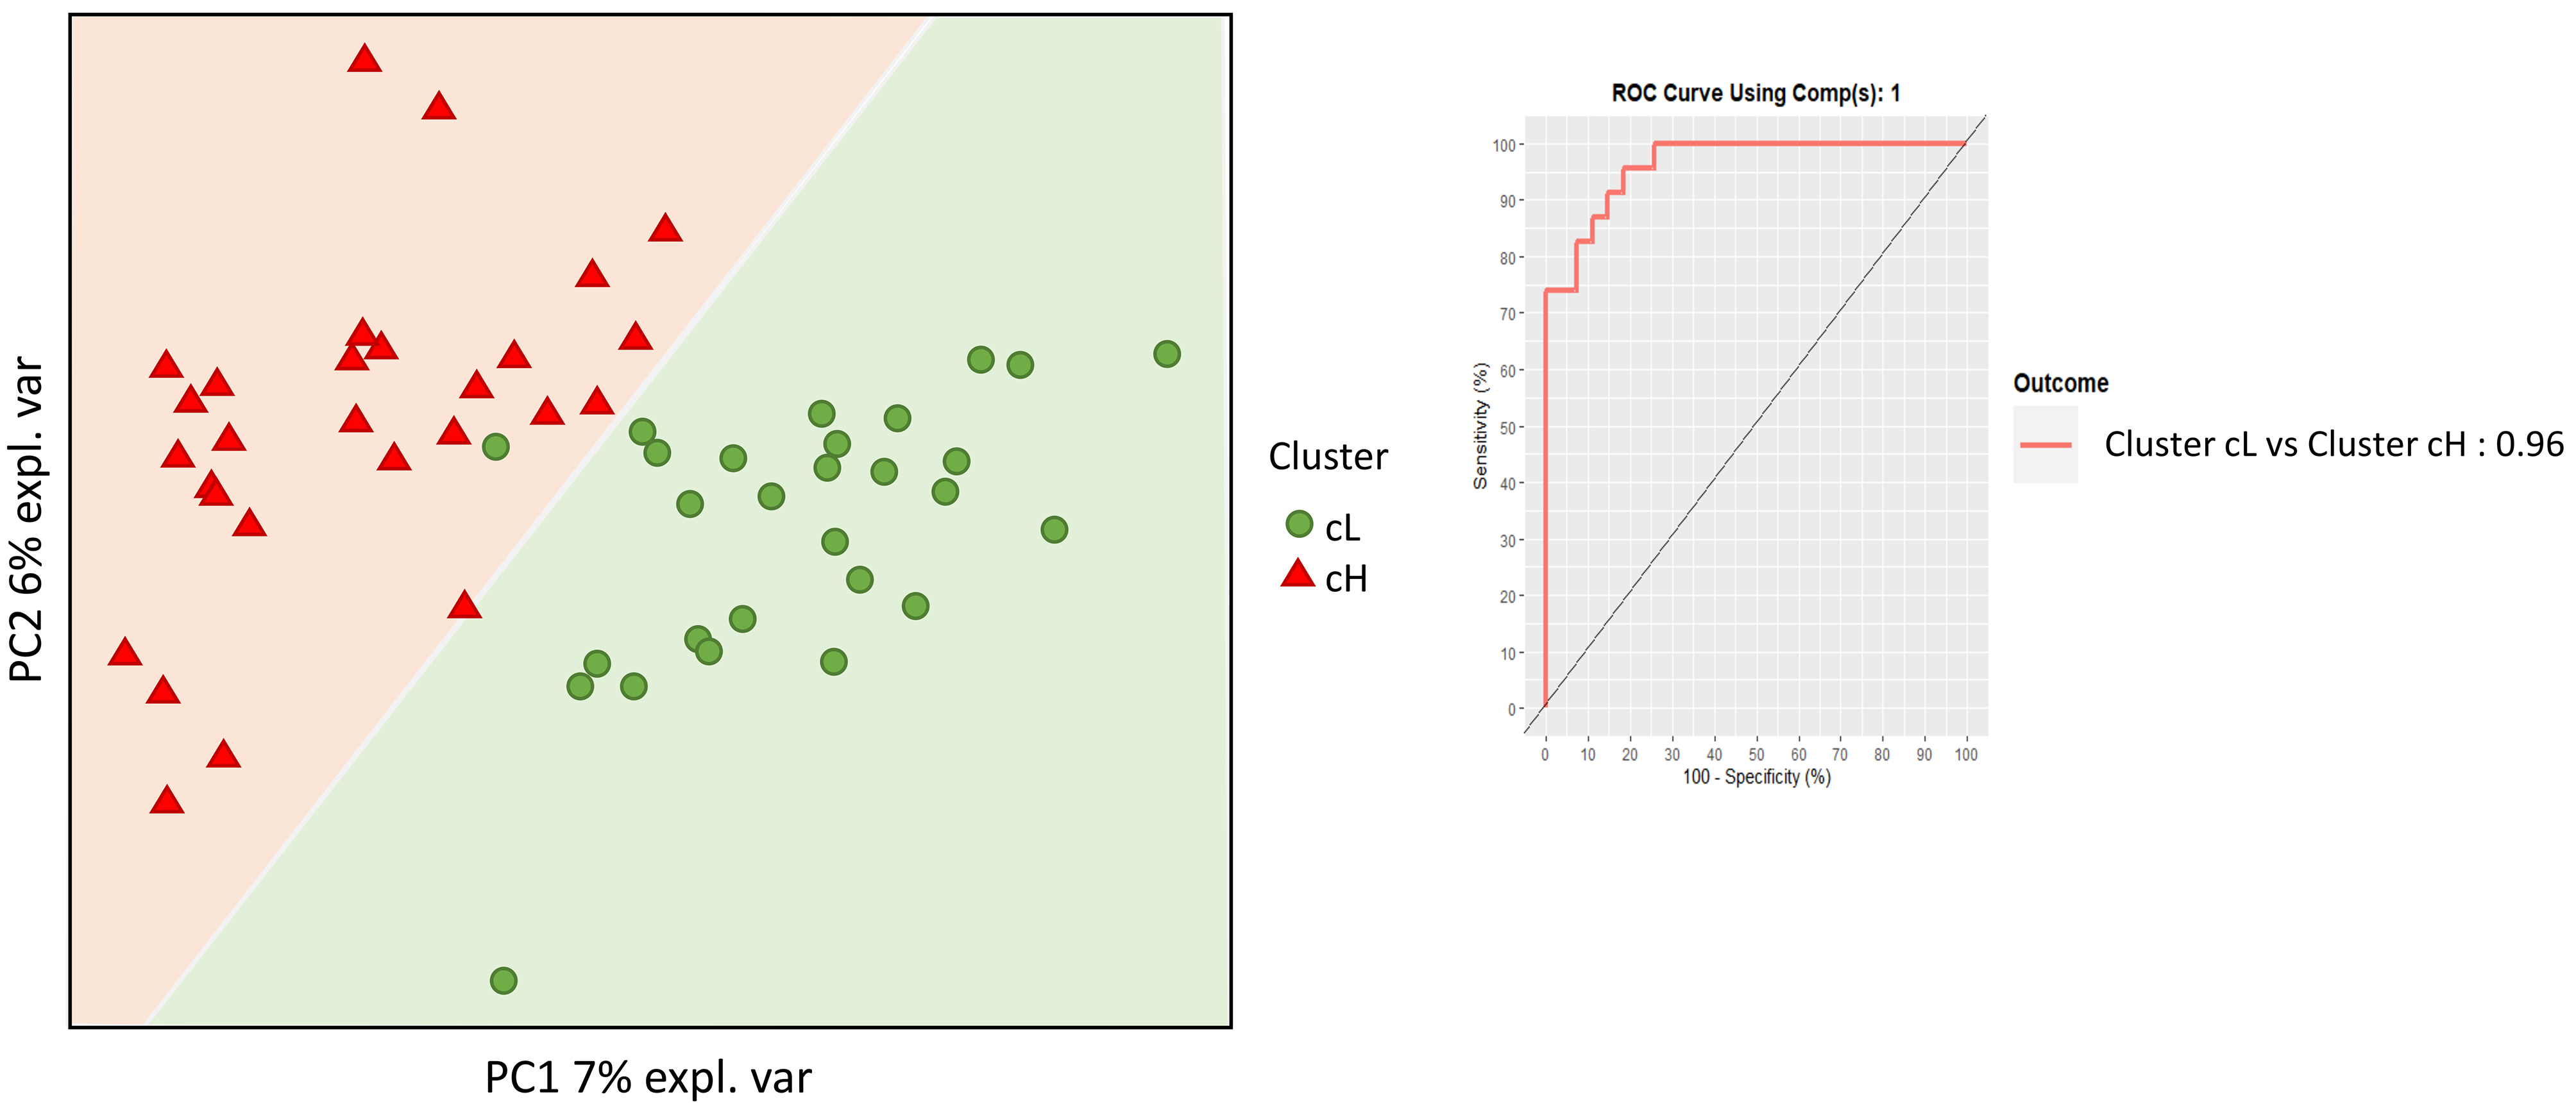
Figure 3. Supervised beta-diversity PLSDA. Microbiota analysis was performed using supervised beta-diversity PLSDA to distinguish between the cL and cH clusters. This analysis shows the arrangement of subjects according to their microbiota composition. The receiver operating characteristic (ROC) curve and the area under the curve (AUC) are presented to assess the microbiota’s discriminatory power between the two clusters. PLSDA: Partial least squares discriminant analysis; cL: lower inflammation; cH: higher inflammation.


