fig4

Effect of a polyphenol-rich dietary pattern on subjects aged ≥ 60 years with higher levels of inflammatory markers: insights into microbiome and metabolome

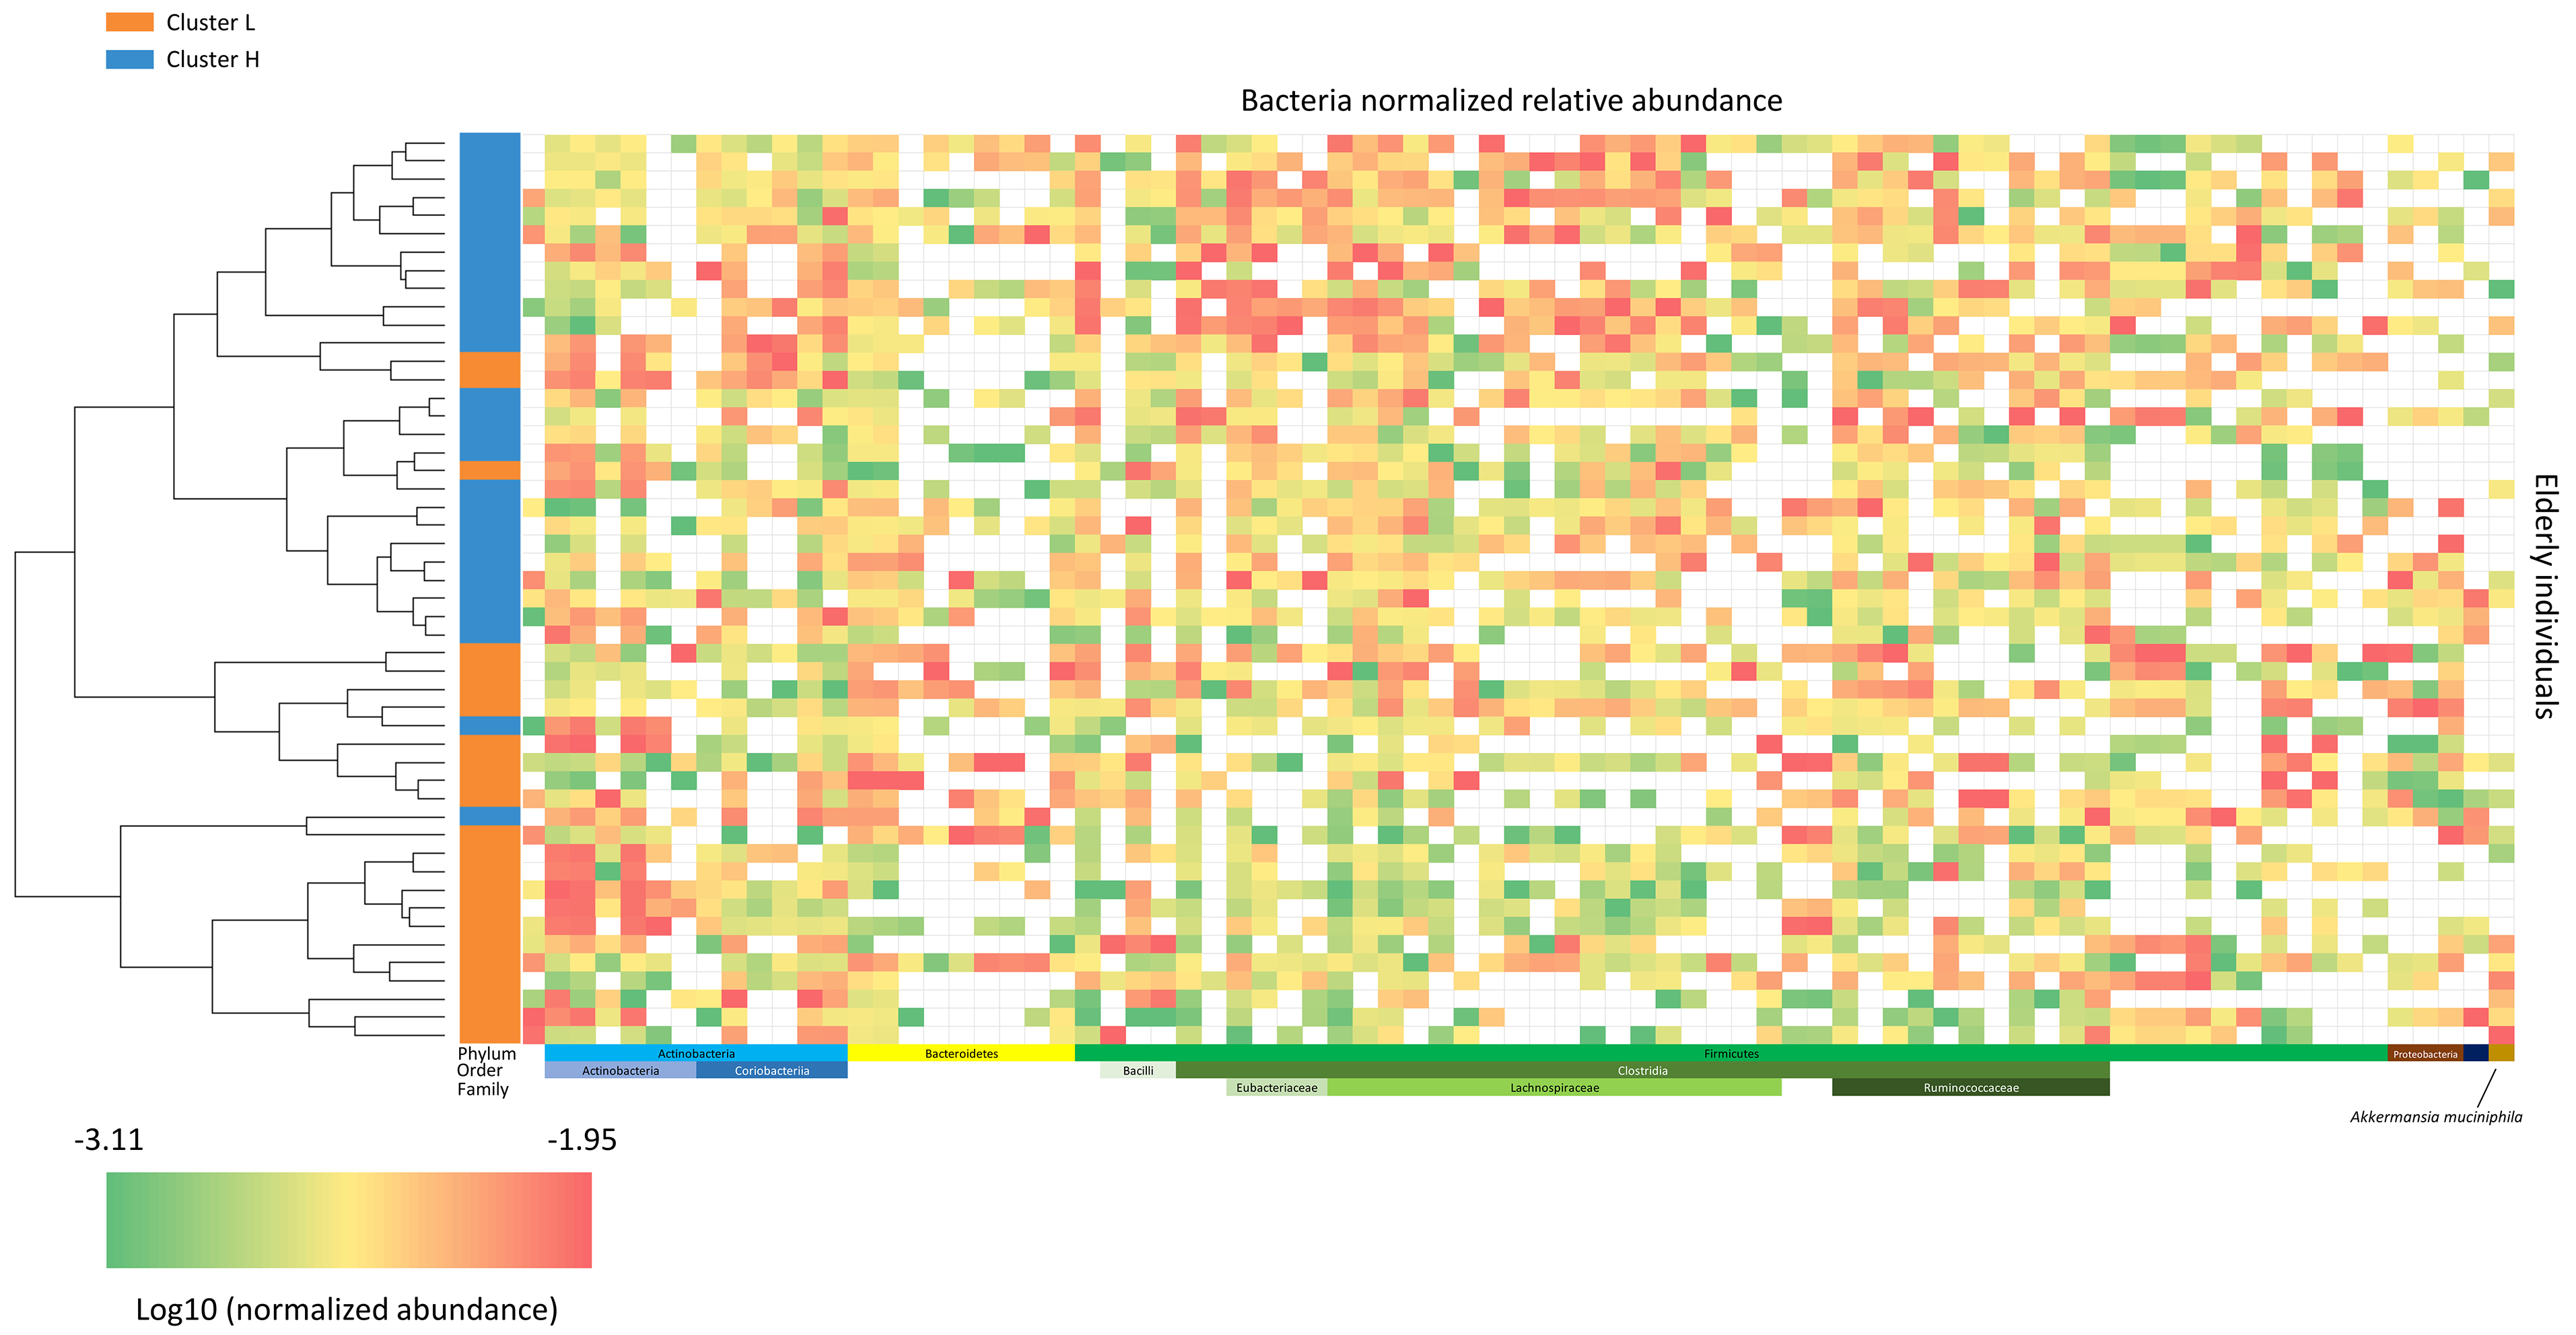
Figure 4. Microbiota heatmap. This heatmap illustrates the normalized relative abundance (log10 scale) of bacterial taxa for each subject. Lower bacterial levels are shown in green, and higher levels in red. The color-coded bar on the left indicates subjects’ cluster membership (cL or cH), arranged according to the hierarchical clustering tree. cL: Lower inflammation; cH: higher inflammation.

Microbiome Research Reports
ISSN 2771-5965 (Online)

Portico

All published articles are preserved here permanently:

https://www.portico.org/publishers/oae/

Portico

All published articles are preserved here permanently:

https://www.portico.org/publishers/oae/