


fig5
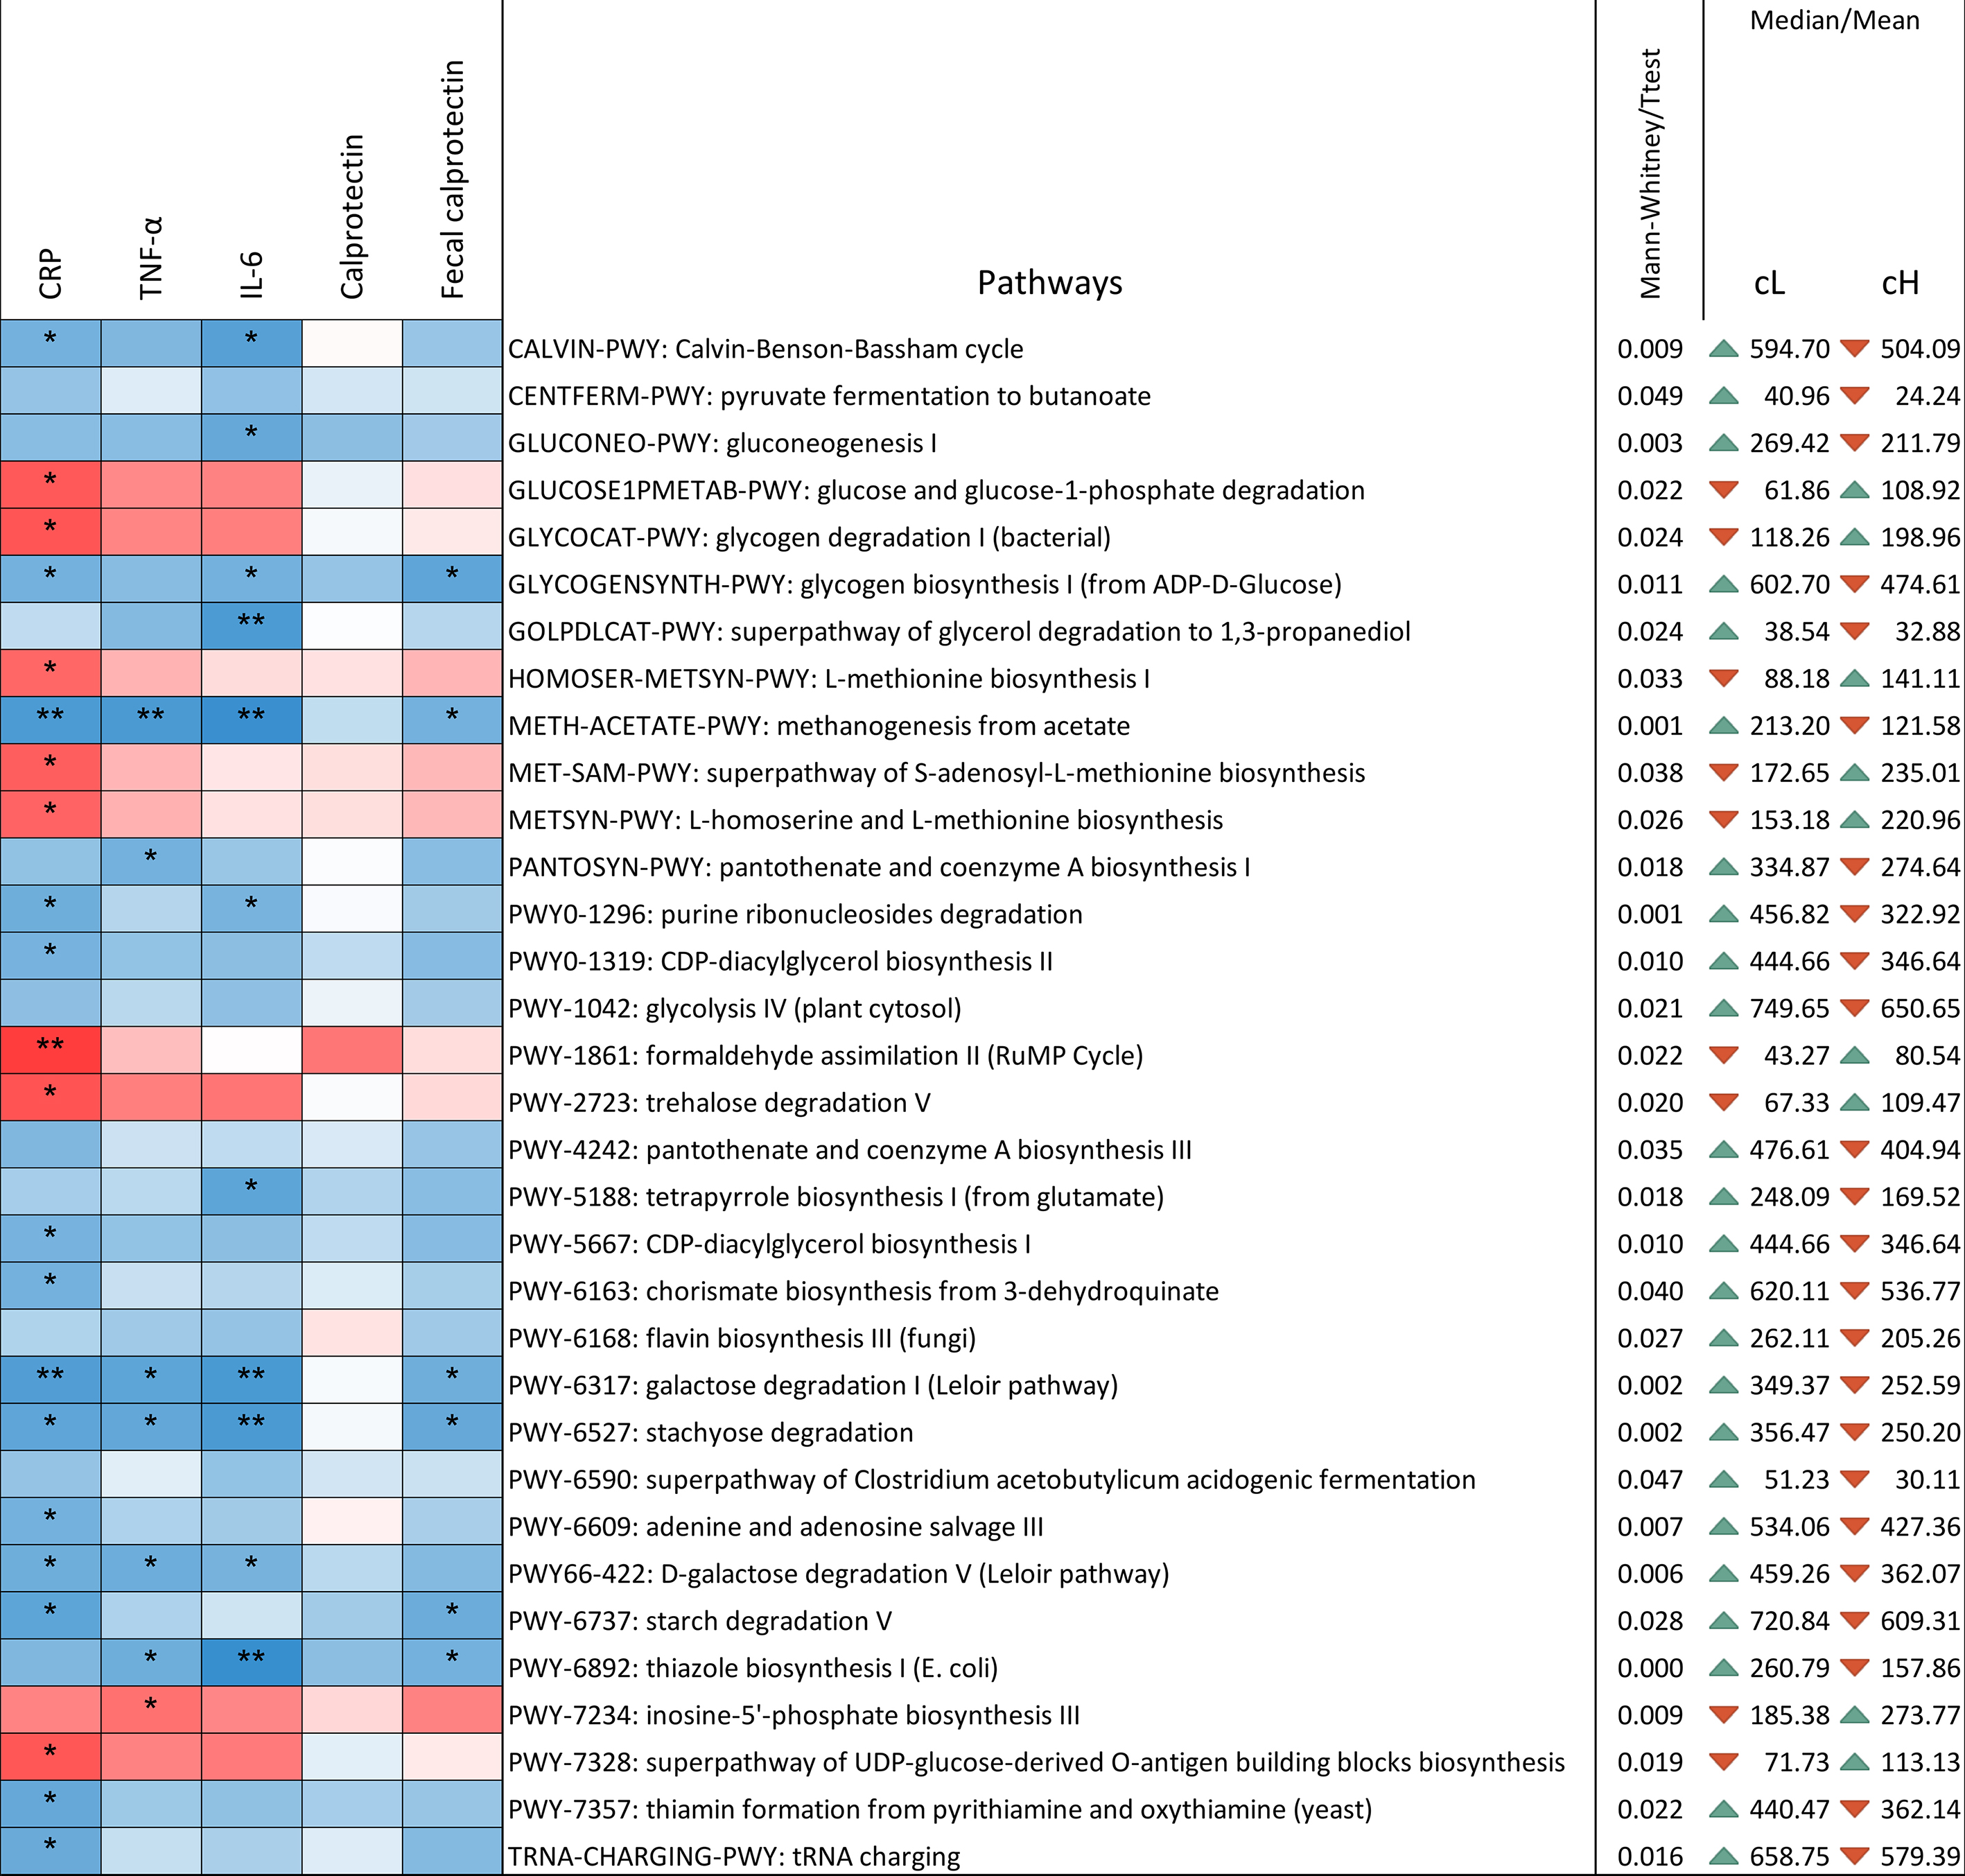
Figure 5. Correlation between pathways and inflammatory markers determined using the Kendall test. The ꞇ index defines the color scale (blue for negative correlation, red for positive correlation), and asterisks indicate significance levels: *0.1 < P < 0.05; **0.001 < P < 0.01; ***P < 0.001. Only pathways showing differential presence between cL and cH are displayed. P-values were computed using both parametric (t-test) and non-parametric (Mann-Whitney U) tests, according to the results of the Shapiro-Francia normality test. Mean or median values, depending on the applied test, are reported. The triangular indicator denotes whether the level is higher (green) or lower (red) in one cluster relative to the other. Values are normalized and expressed as copies per million for genes associated with each pathway. cL: Lower inflammation; cH: higher inflammation.


