


fig6
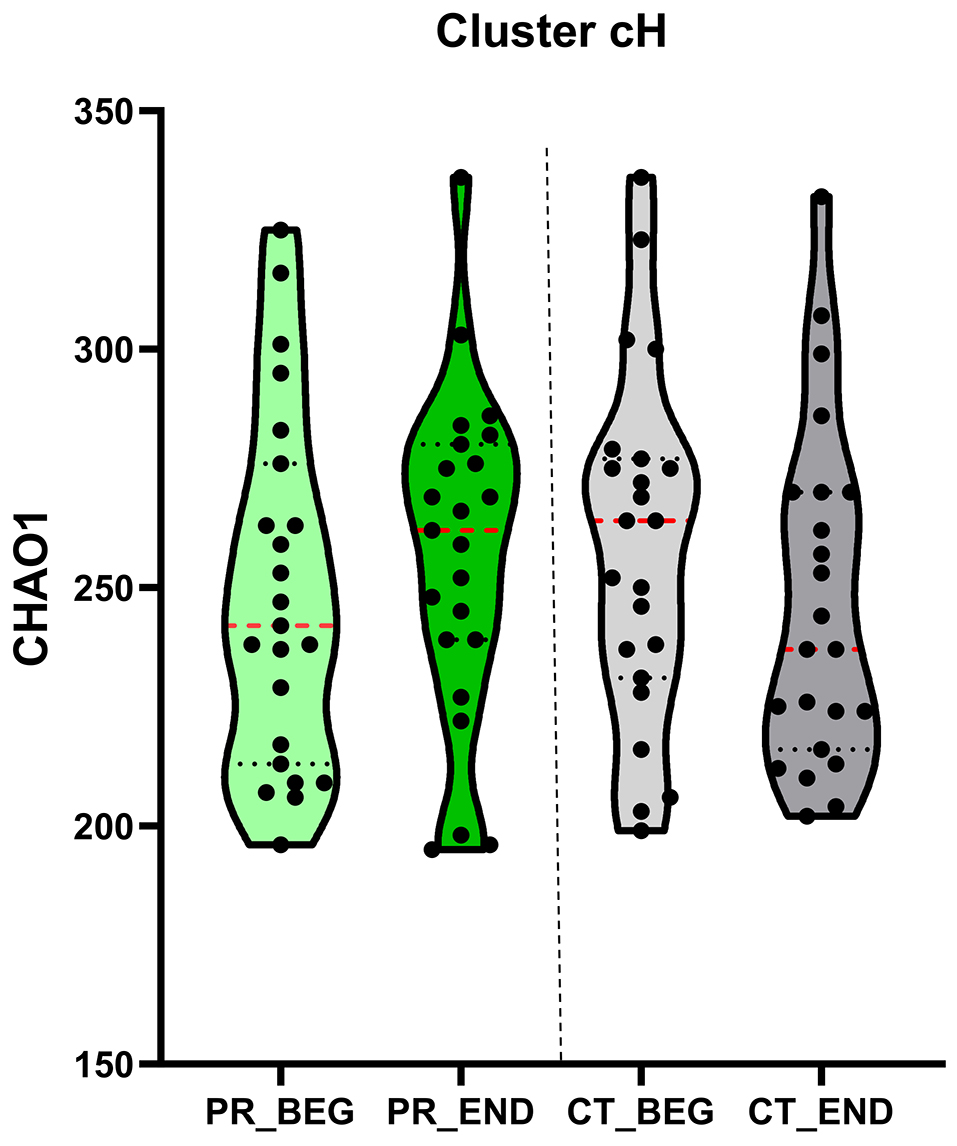
Figure 6. Alpha diversity. A Violin plot illustrates the results of the non-parametric repeated-measures ANOVA (ANOVA-RM) analysis of alpha diversity (Chao1 index) over the treatment period. Alpha-diversity indices are presented, with median values highlighted in red for each time point. BEG: Baseline; END: end; CT: control diet; PR: polyphenols-rich diet; ANOVA: analysis of variance; ANOVA-RM: repeated measures analysis of variance.


